Dokumen ini memberikan ringkasan proses debug untuk memahami penggunaan API dan Layanan di konsol Google Cloud dan juga lonjakan latensinya.
Pertama, ikuti langkah-langkah berikut untuk mengidentifikasi ID percakapan dengan latensi tinggi:
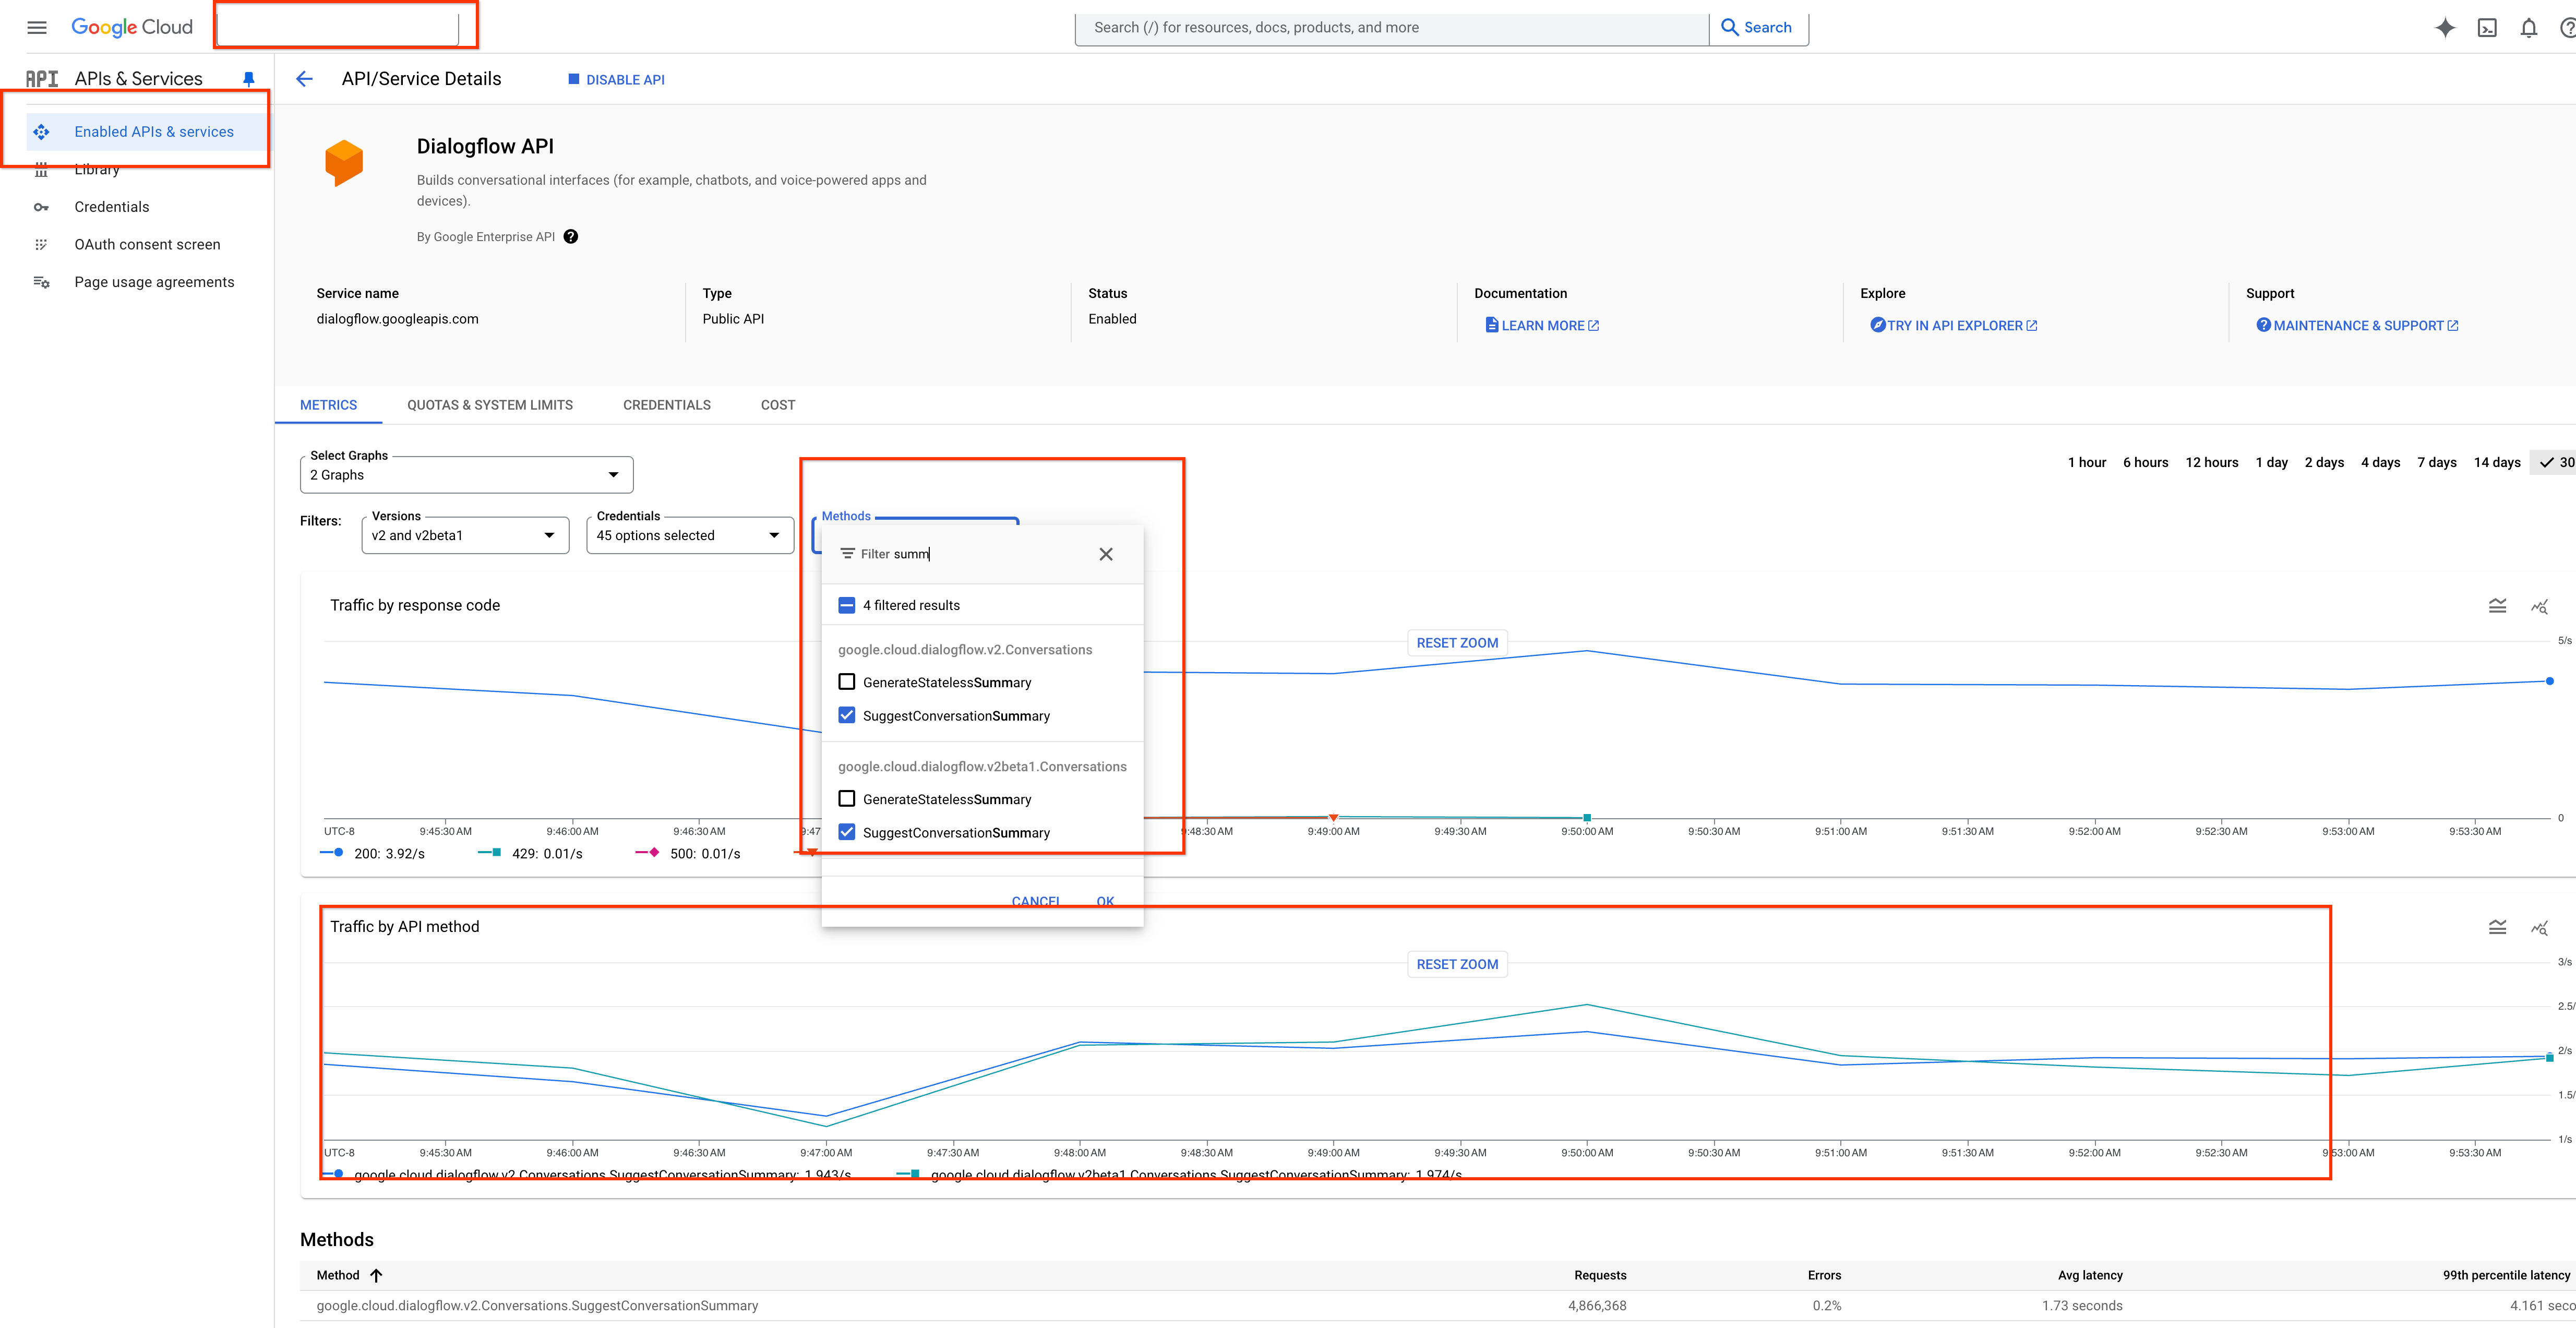
- Buka Google Cloud konsol dan buka APIs & Services.
- Klik Enabled APIs and Services.
- Buka Metrics, lalu pilih API method di bagian Methods.
Grafik traffic latensi akan muncul, yang diberi label Traffic by API method.
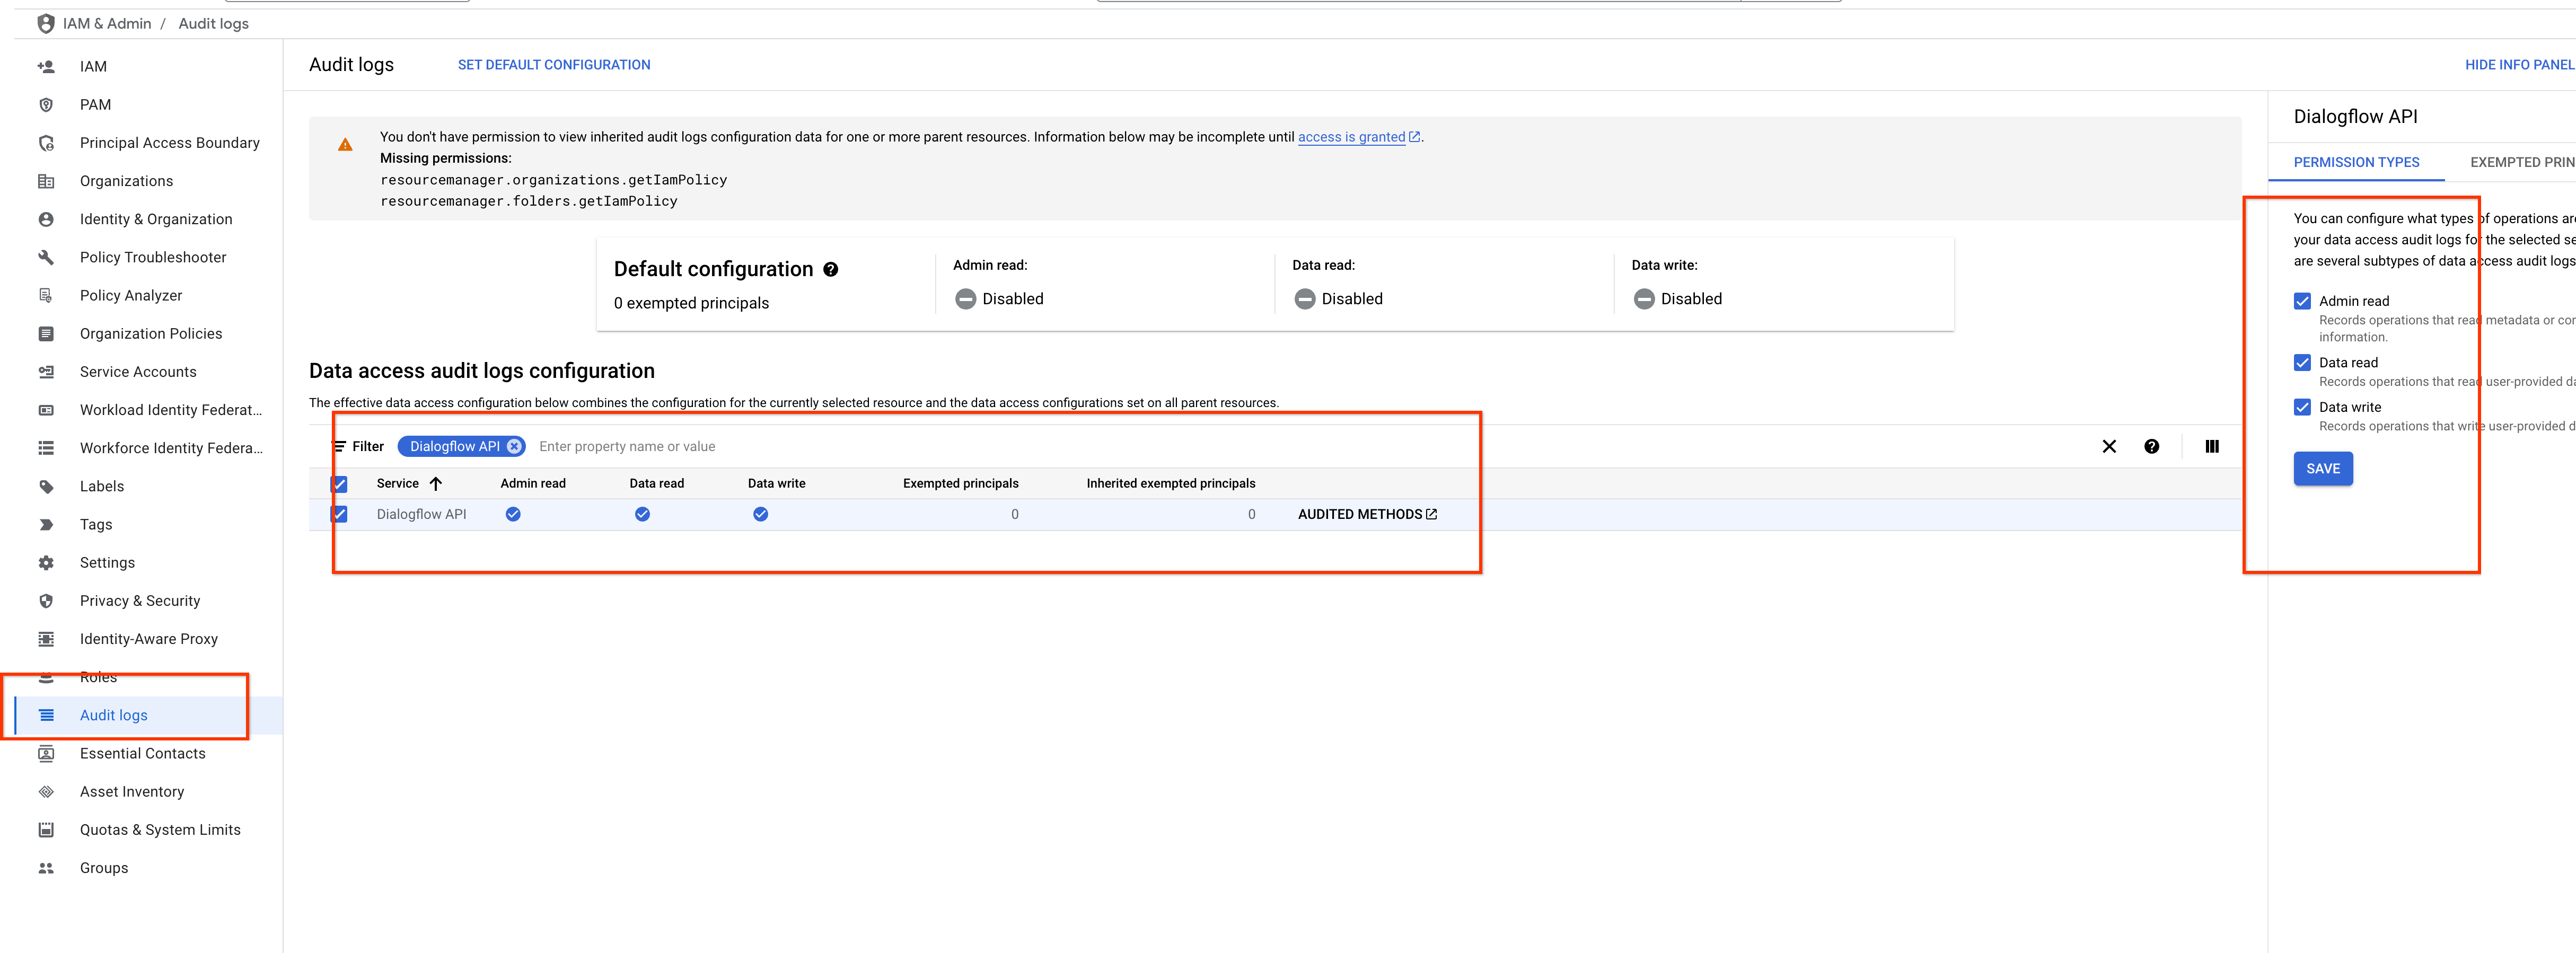
Selanjutnya, pastikan Anda mengaktifkan logging audit.
- Buka Log Audit.
- Centang opsi Admin Read, Data Read, dan Data Write.
- Klik Simpan.
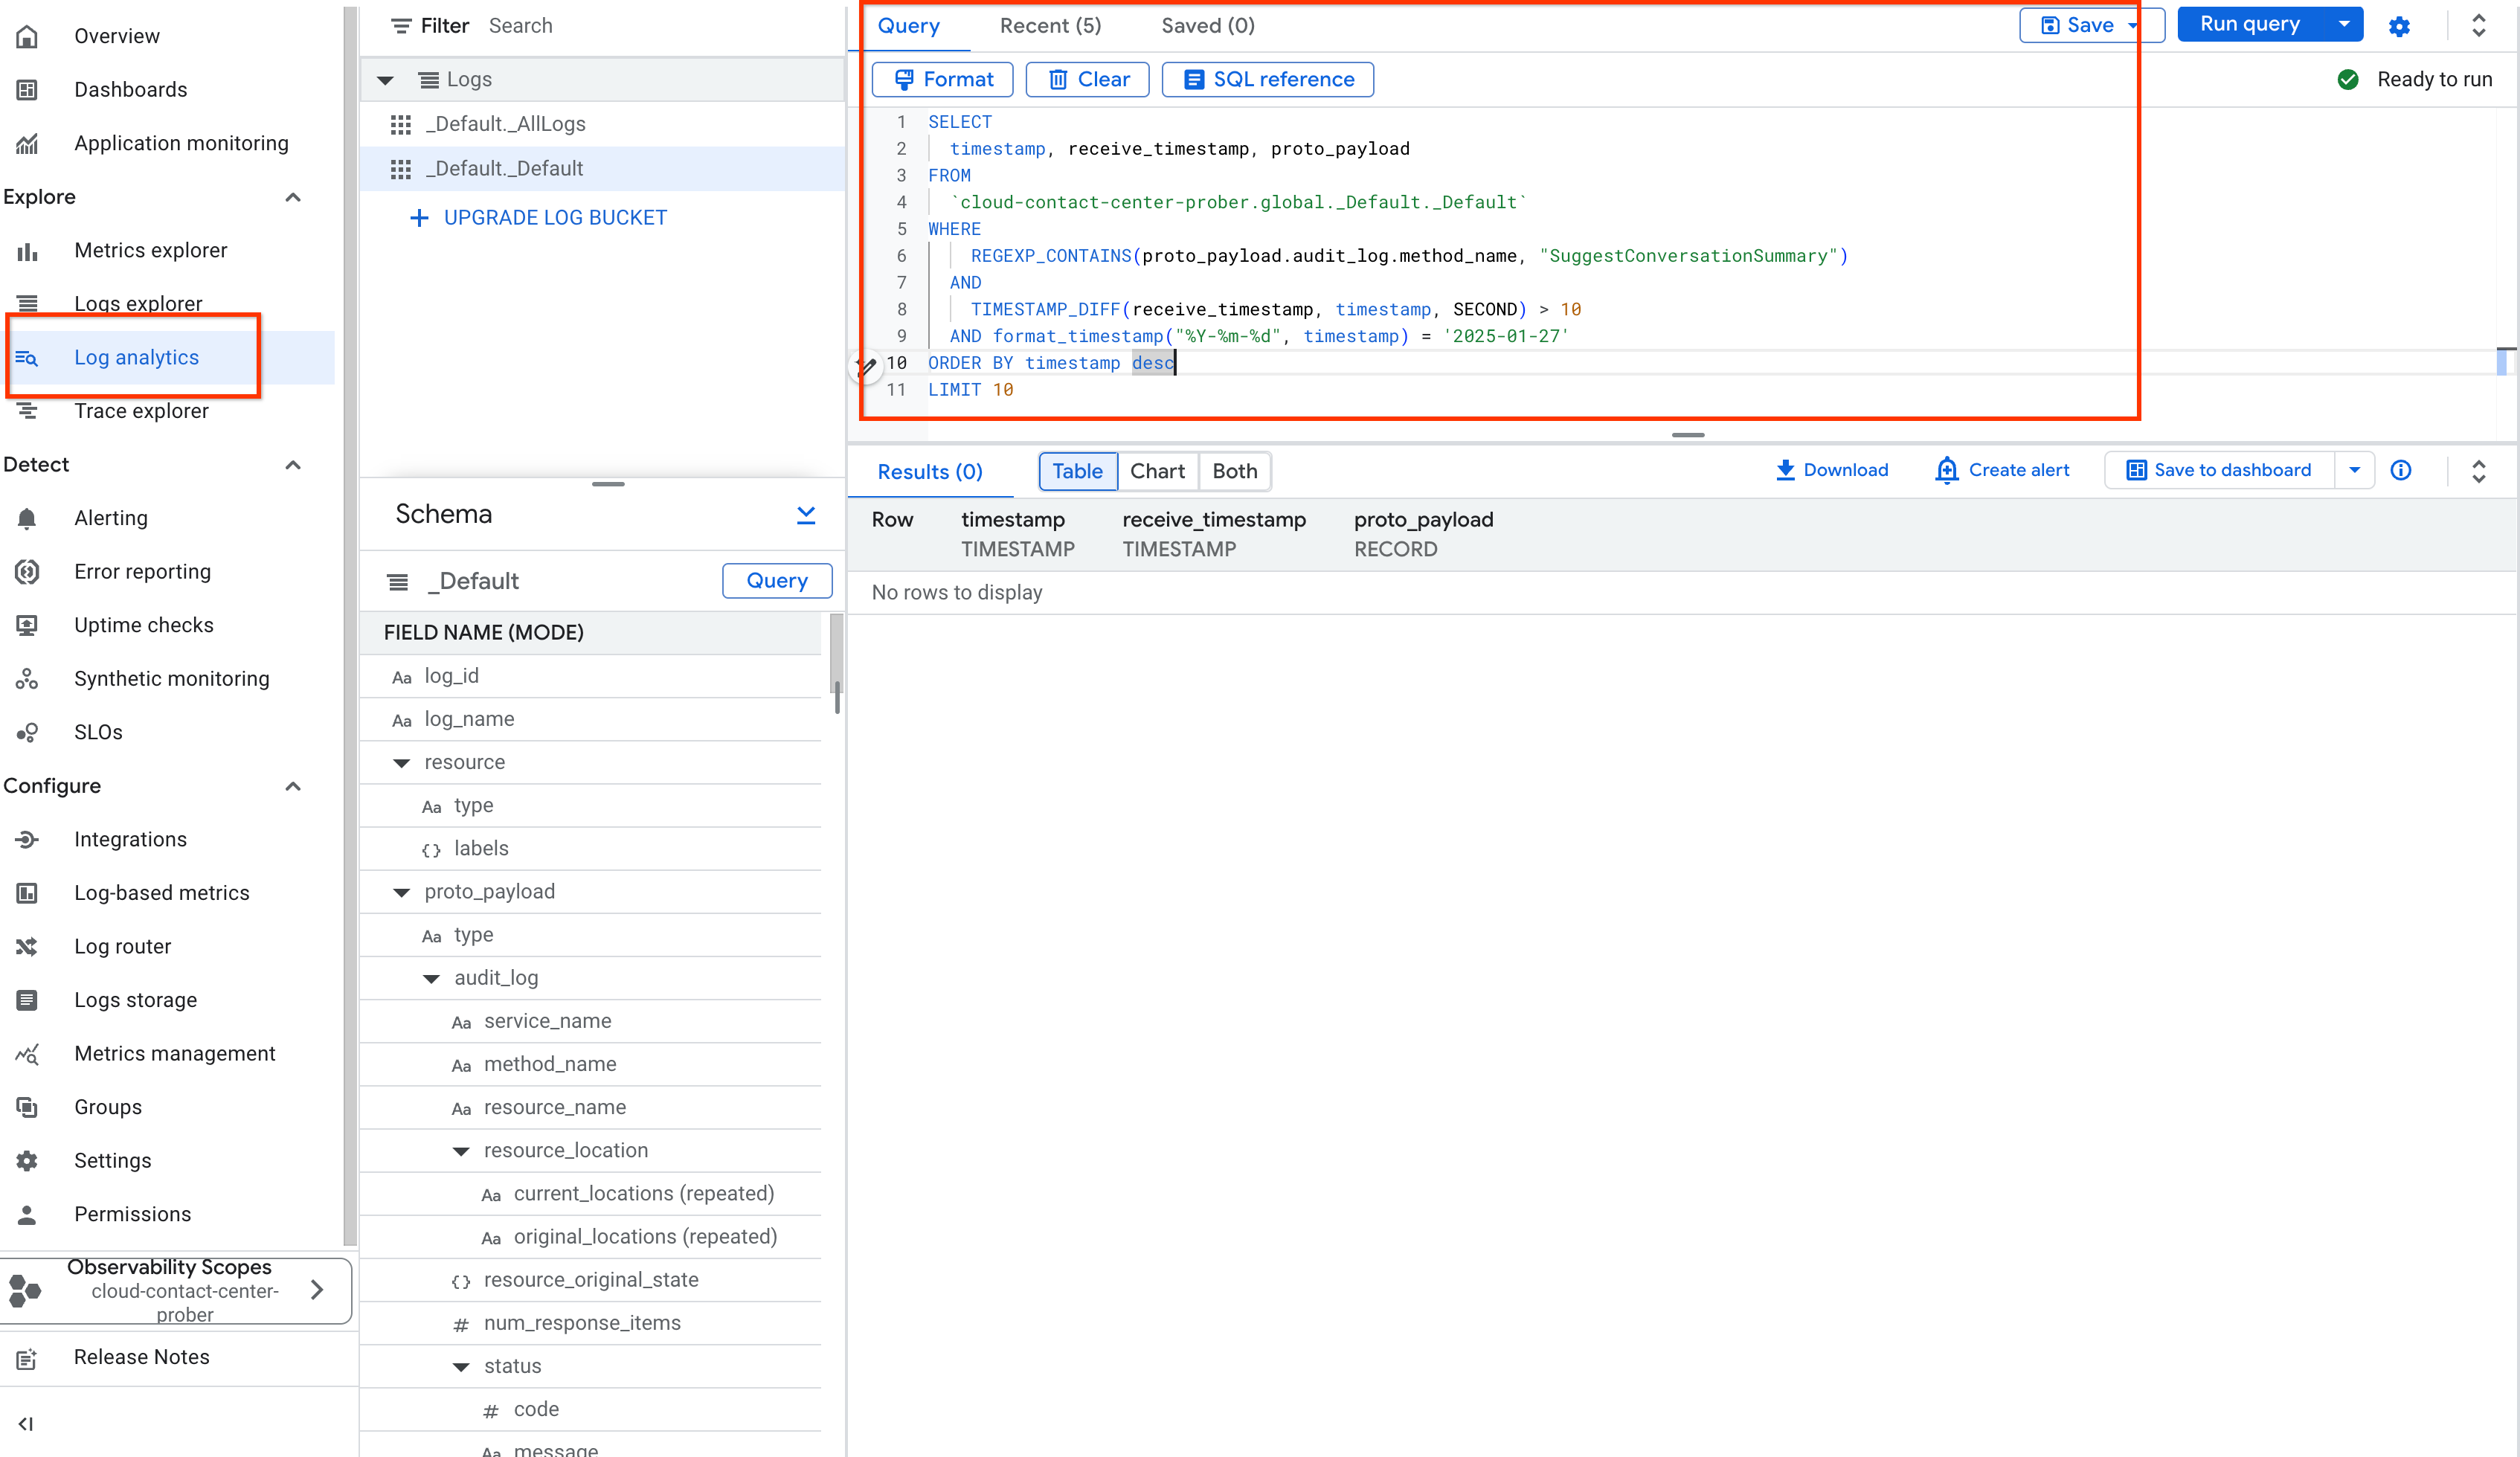
Selanjutnya, identifikasi ID percakapan dengan latensi yang lebih lama dari nilai tertentu di Log analytics. Misalnya, pada screenshot berikut, Anda dapat melihat percakapan yang berdurasi lebih dari 10 detik pada hari tertentu.
- Buka Log Analytics.
- Berikan waktu terhadap TIMESTAMP_DIFF.
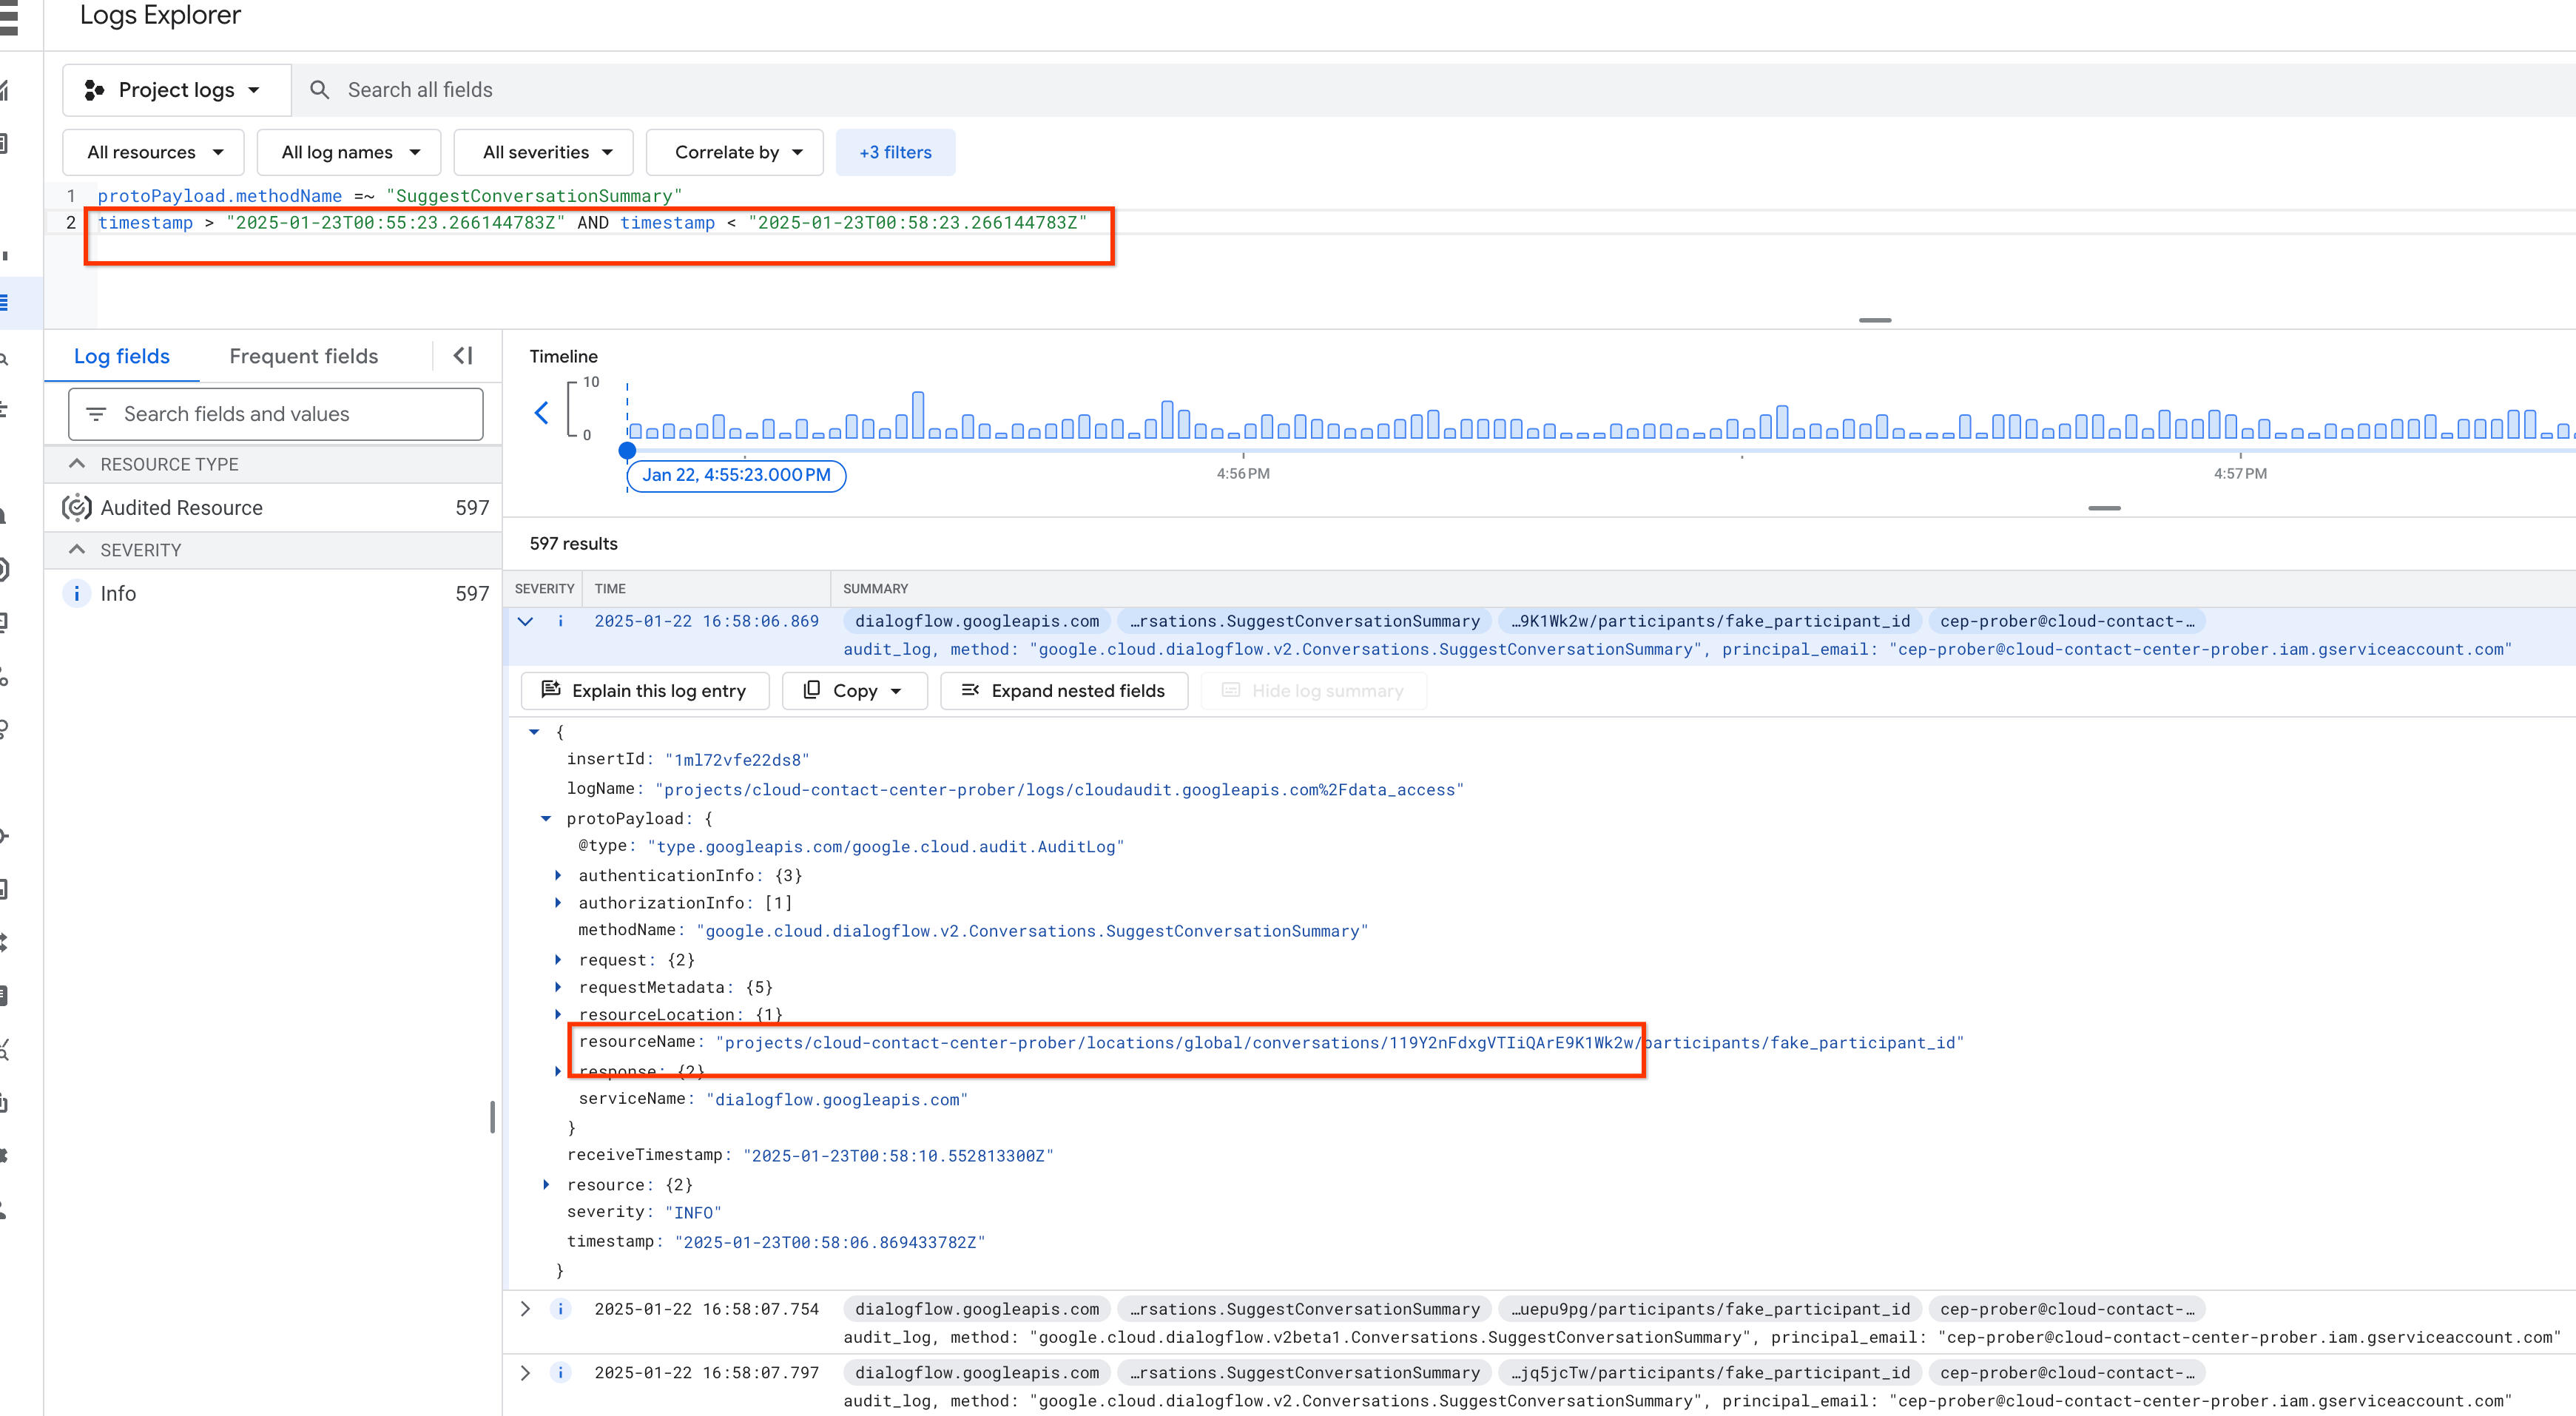
Atau, gunakan stempel waktu untuk mengidentifikasi percakapan tertentu selama periode tertentu di Log explorer.
- Masukkan nama metode di protoPayload.methodName.
- Masukkan rentang waktu di Stempel waktu.
- Lihat hasilnya di Kolom log.
Anda dapat mengakses API Agent Assist apa pun dengan Cloud Logging diaktifkan dengan mengikuti semua langkah sebelumnya.