This page covers how to view the tracking logs associated with your Ray clusters and monitor the Ray on Vertex AI metrics. Guidance for debugging Ray clusters is also provided.
View logs
When you perform tasks with your Ray cluster on Vertex AI, tracking logs are automatically generated and stored in both Cloud Logging and open source Ray dashboard. This section describes how to access the generated logs through the Google Cloud console.
Before you begin, make sure to read the Ray on Vertex AI overview and set up all the prerequisite tools you need.Ray OSS dashboard
You can view the open source Ray log files through the Ray OSS dashboard:
In the Google Cloud console, go to the Ray on Vertex AI page.
In the row for the cluster you created, select more actions menu.
Select the Ray OSS dashboard link. The dashboard opens in another tab.
Navigate to the Logs view in the top right corner in the menu:
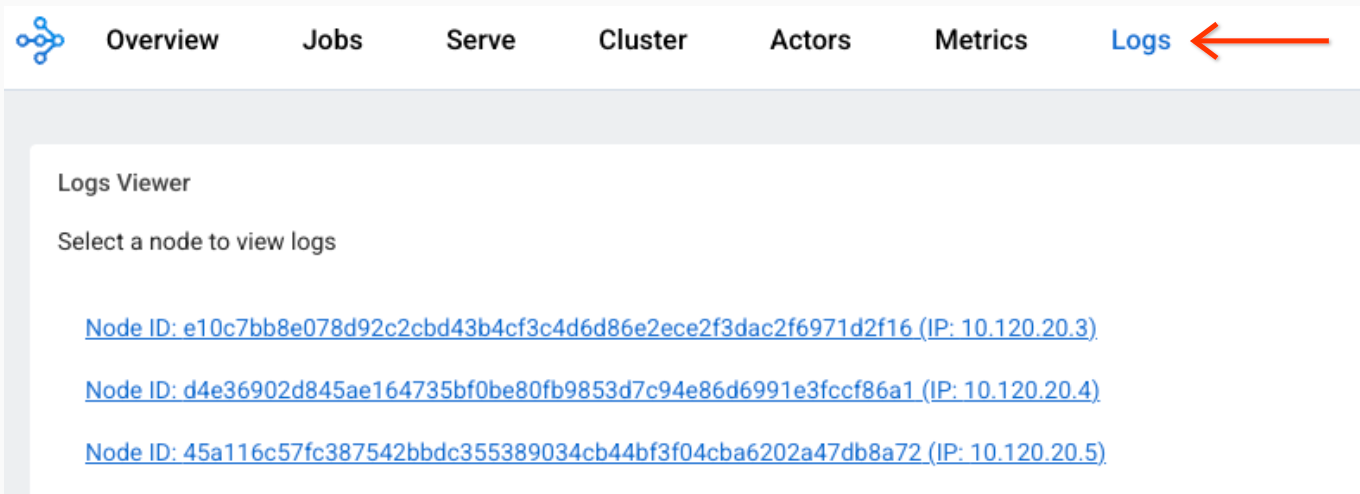
Click each node to see the log files associated with that node.
Cloud Logging console
-
In the navigation panel of the Google Cloud console, select Logging, and then select Logs Explorer:
Select an existing Google Cloud project, folder, or organization.
To display all Ray logs, enter the following query into the query-editor field, and then click Run query:
resource.labels.task_name="ray-cluster-logs"
To narrow down the logs to a specific Ray cluster, add the following line to the query and then click Run query:
labels."ml.googleapis.com/ray_cluster_id"=CLUSTER_NAME
Replace CLUSTER_NAME with the name for your Ray cluster. In the Google Cloud console go to Vertex AI > Ray on Vertex AI where you'll see a list of cluster names in each region.
To further narrow down the logs to a specific log file like
raylet.out, click the name of the log under Log fields -> Log name.You can group similar log entries together:
In the Query results, click a log entry to expand the log.
In the
jsonPayload, click thetailed_pathvalue. A drop-down menu appears.Click Show matching entries.
Monitor metrics
You can view the Ray on Vertex AI metrics in different ways using Google Cloud Monitoring (GCM). Alternatively, you can export the metrics from GCM to your own Grafana server.
Monitor Metrics in GCM
There are two ways you can view the Ray on Vertex AI metrics in GCM.
- Use the direct view under Metrics Explorer.
Import the Grafana dashboard.
Metrics Explorer
To use the direct view under Metrics Explorer, follow these steps:
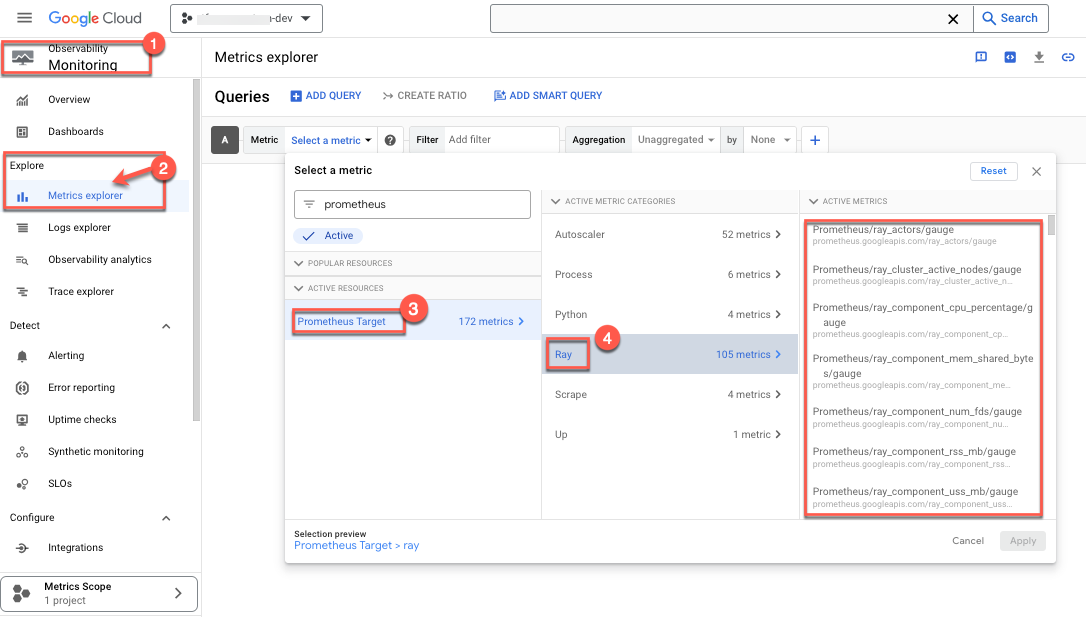
- Go to the Google Cloud Monitoring console.
- Under Explore select Metrics explorer.
- Under Active Resources, select Prometheus Target. Active Metric Categories appears.
Select Ray.
A list of metrics appears:
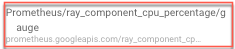
- Select the metrics you want to monitor. For example:
- Choose the cpu utilization percentage as a monitored metric:
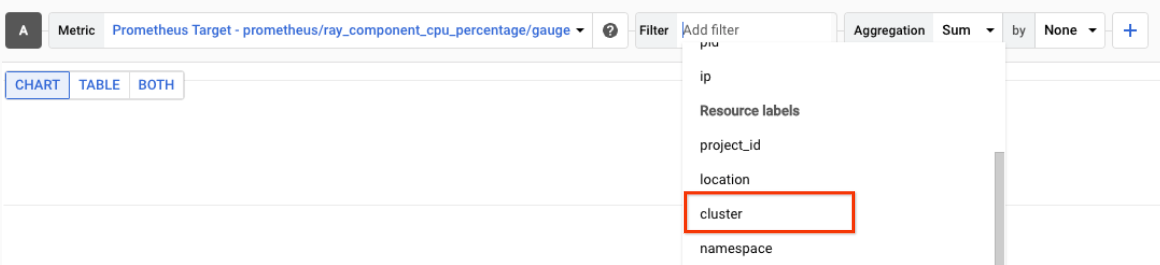
- Select a filter. For example, select cluster:
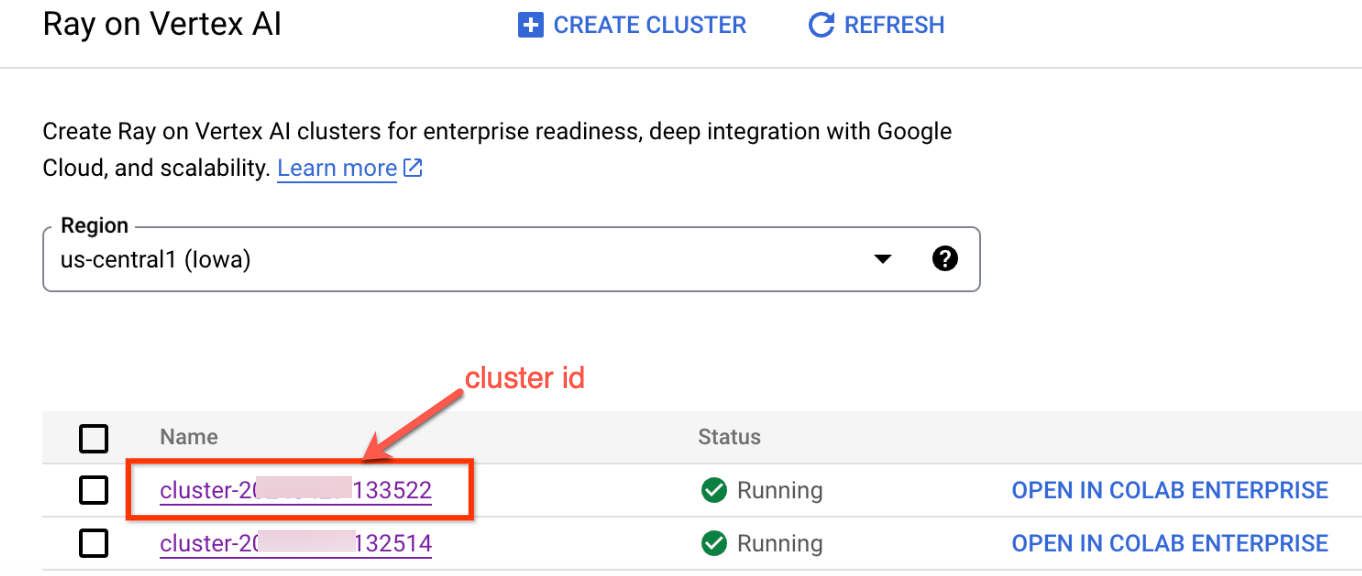
 Use the cluster ID to only monitor the above metrics for a specific cluster. To locate your cluster ID,
follow these steps:
Use the cluster ID to only monitor the above metrics for a specific cluster. To locate your cluster ID,
follow these steps:
In the Google Cloud console, go to the Ray page.
- Be sure you're in the project you want to create the experiment in.
- Under Name a list of cluster IDs appears.
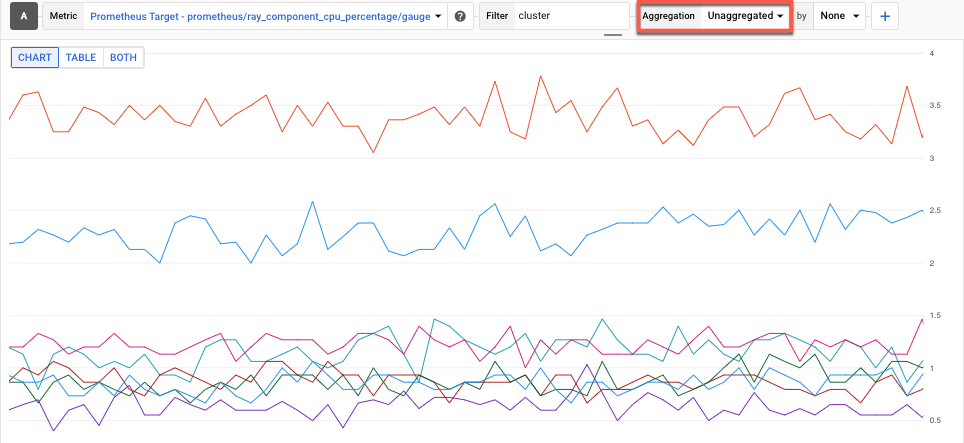
- Select the Aggregation method to view the metrics. That is, you can choose to
view unaggregated metrics, which show each Ray process's CPU utilization:
- Choose the cpu utilization percentage as a monitored metric:
GCM dashboard
To import a Grafana dashboard for Ray on Vertex AI follow the guidelines on the cloud monitoring dashboard, Import your own grafana dashboard.
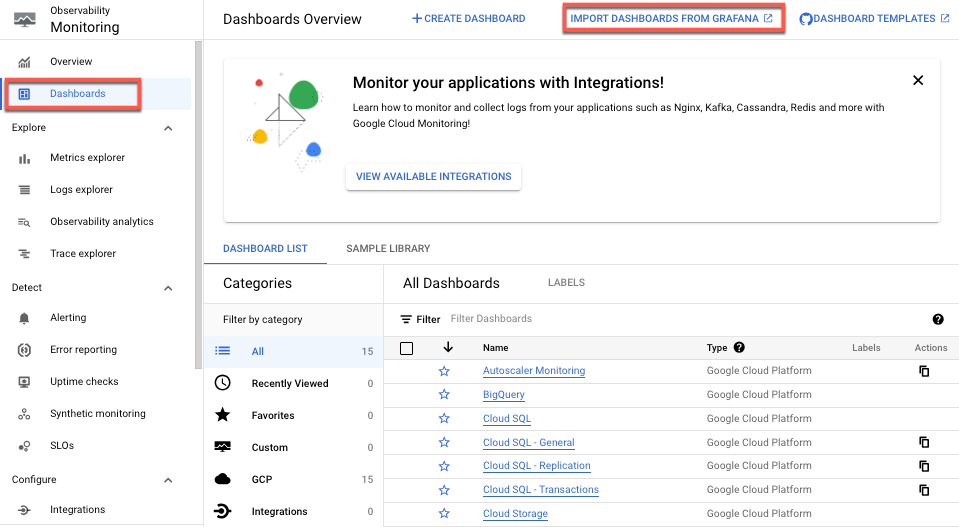
All you need is a Grafana dashboard JSON file. OSS Ray supports this manual setup by providing the default dashboard Grafana JSON file.
Monitor metrics from user-owned Grafana
If you already have a Grafana server running, then there's also a way to export all the Ray cluster on Vertex AI Prometheus metrics to your existing Grafana server. To do so, follow the GMP Query using Grafana guidance. This lets you add a new Grafana data source to your existing Grafana server and use the data source syncer to sync the new Grafana Prometheus data source to Ray on Vertex AI metrics.
It's important that you configure and authenticate the newly added Grafana data source using the data source syncer. Follow the steps provided in Configure and authenticate the Grafana data source.
Once synced, you can create and add any dashboard you need based on the Ray on Vertex AI metrics.
By default, the Ray on Vertex AI metrics collections are enabled. Here's how to disable them using Vertex AI SDK for Python:
vertex_ray.create_ray_cluster(..., enable_metrics_collection=False, ...)
Debug Ray clusters
To debug Ray clusters, use the Head node interactive shell:
Google Cloud console
To access the Head node interactive shell, do the following:
- In the Google Cloud console, go to the Ray on Vertex AI page.
Go to Ray on Vertex AI - Be sure you're in the correct project.
- Select the cluster you want to examine. Basic info section appears.
- In the Access links section, click the link for Head node interactive shell. The head node interactive shell appears.
- Follow the instructions outlined in Monitor and debug training with an interactive shell.