You can add images to Looker dashboards by hard-coding an image URL in a Markdown text tile. However, images in text tiles are static and will not update based on results. What if you want a dashboard image to dynamically change based on a user-selected filter value?
This Best Practices page demonstrates how to achieve a dynamic dashboard image using Liquid and the html parameter.
The solution
The following solution is based on an e-commerce data set that includes a field called users.state, representing the states in a hypothetical ecommerce data set:
dimension: state {
  type: string
  sql: ${TABLE}.state ;;
}
Say that you want to display the image of a state's flag on a dashboard that will update based on the state by which a user chooses to filter the dashboard results.
There are three steps that you need to complete to create the dynamic dashboard image:
- Create an image dimension in LookML.
- Create a dynamic image dashboard tile.
- Add dashboard filters and final touches.
Step 1: Create an image dimension in LookML
To create an image dimension in LookML:
- First, navigate to the project and view file containing the dimension to which you would like to add images. Then, create a new dimension based on that field, specifically for the use of displaying the images.
-
Add an
htmlparameter for defining a Liquid{% if %}conditional statement with thevaluevariable, for each value for which you want to display an image.For example, the
state_flag_imagedimension below establishes a condition for displaying the specified images (withhtml <img>tags) when the value ofstateis"California","New York","Colorado", or"Illinois". For all other states, you can display a "no image available" icon:dimension: state_flag_image { type: string sql: ${state} ;; html: {% if state._value == "California" %} <img src="https://upload.wikimedia.org/wikipedia/commons/0/01/Flag_of_California.svg" height="170" width="255"> {% elsif state._value == "New York" %} <img src="https://upload.wikimedia.org/wikipedia/commons/thumb/1/1a/Flag_of_New_York.svg/1200px-Flag_of_New_York.svg.png" height="170" width="255"> {% elsif state._value == "Colorado" %} <img src="https://upload.wikimedia.org/wikipedia/commons/thumb/4/46/Flag_of_Colorado.svg/255px-Flag_of_Colorado.svg.png" height="170" width="255"> {% elsif state._value == "Illinois"%} <img src="https://upload.wikimedia.org/wikipedia/commons/thumb/0/01/Flag_of_Illinois.svg/1200px-Flag_of_Illinois.svg.png" height="170" width="255"> {% else %} <img src="https://upload.wikimedia.org/wikipedia/commons/thumb/a/ac/No_image_available.svg/1024px-No_image_available.svg.png" height="170" width="170"> {% endif %} ;; } -
Create a value condition for each value for which you would like to display an image. Alternatively, you can create a dynamic image field using the
valueLiquid variable, as described in the How to add images to visualizations Community post.
Next, you can create a dashboard tile for the image dimension.
Step 2: Create a dynamic image dashboard tile
Now that the image dimension (state_flag_image) has been created, you can build an Explore that will become the dynamic image dashboard tile.
Build your Explore with the following criteria:
-
Add a filter for the original dimension (in this case,
state). Set the filter for any value (the state flag will display the "no image available" image in this case, as no specific filter value is selected). This filter value will update according to what the user selects for the dashboard filter. -
Select the image dimension (in this case,
state_flag_image) and any other dimensions that may be necessary to the query that determines the image (for example, if you want to factor in a date, you can include date, etc.). - Change the row limit to one row.
-
Change the visualization type to a single value visualization and hide any other columns except the image dimension (
state_flag_image).
Your Explore will display the first image result in the single value visualization rendered in the Visualization panel. The display image will change based on the filter value the user selects on the final dashboard:

Save the Explore to a dashboard as a tile.
Step 3: Add dashboard filters and final touches
Now you need to add dashboard filters to the dashboard. The filters on the dashboard will update the filter in the Explore to change the image displayed based on user selection.
From the dashboard's edit mode, create the filter:
- Open the Add filter window
- Select the field to filter by. The filter field should be the dimension on which the image dimension is based. In the case of this example, the field for the filter will be state.
- Select the image tile from Step 2 on the Tiles to Update tab.
- Select the original dimension (state in this case) in the inline Field to Filter drop-down menu. Select other tiles to update as desired.
- Customize the filter as desired. If you select the Advanced control option, make sure to deselect the Allow multiple filter values option, which is automatically enabled for the Advanced control option.
Now, the image tile will update with the user filter selection.
When a user chooses to filter by "California", the dashboard will display the state flag and data for the state of California:

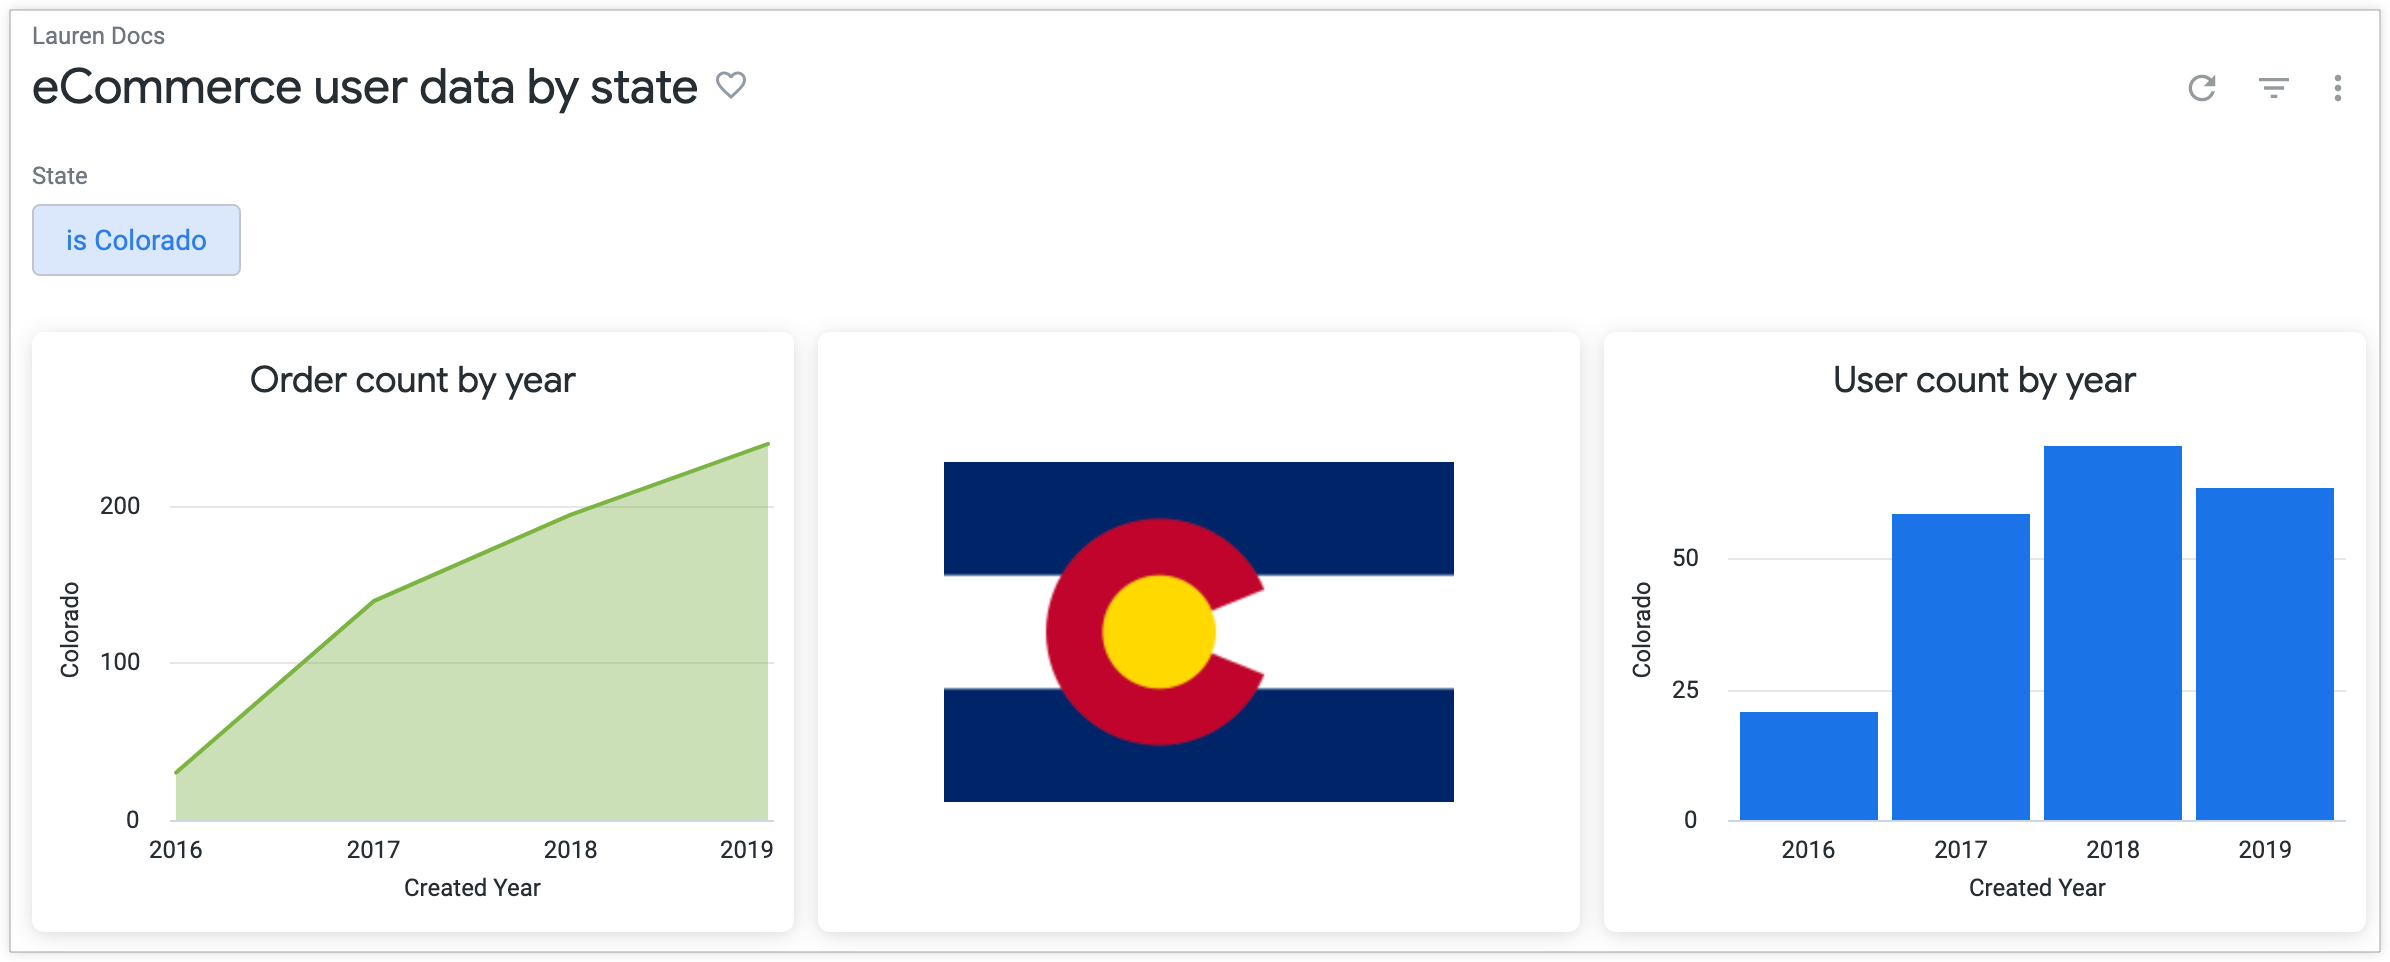
When a user chooses to filter by "Colorado", the dashboard will display the state flag and data for the state of Colorado: