This page applies to Apigee and Apigee hybrid.
View
Apigee Edge documentation.

Apigee lets you create complex alerts based on multiple conditions. The following sections present examples of alerts:
Alert for no 200 response code for 5 minutes
The next example creates an alert when there is no 200 response code (successful request) for 5 minutes.
To create the alert:
-
In the Google Cloud console, go to the Monitoring > Alerting > Policies page.
- Click Select a Metric.
- Deselect the Active button.
Note: If there is no recent API traffic data in your organization, the metric in the next step won't be displayed unless this option is unselected.
- Select a metric as follows:
- Copy and paste the following in the Select a metric field:
apigee.googleapis.com/proxy/response_count
- Select Apigee Proxy.
- In the pane that opens to the right, select Proxy.
- In the next pane to the right, select Apigee proxy response count.
- Click Apply.
- Copy and paste the following in the Select a metric field:
- Add a filter for the response code as follows:
- Click Add filter.
- Click in the Filter field and select response_code from the drop-down menu.
- In the Comparator, select =.
- In the Value field, type 200.
- Click Apply.
Configure the alert trigger
To configure the event that triggers the alert, first click Configure trigger in the left-hand pane. Then do the following steps:
- Under Condition type, select Metric absence.
- In the Alert trigger field, select Any time series violates.
- In the Metric absence time field, select 5 min.
- Optionally, in the Condition name field, enter a name for the condition.
With these settings, an alert will be triggered when the proxy does not receive a 200 response code for 5 minutes.
Click Next to open the Configure notifications and finalize alert pane.
Set up a notification for the alert
In the Configure notifications and finalize alert pane, you can set up a notification that will be sent when an alert is triggered. To do so:
Click in the Notification Channels field. If you have already created a channel for the notification, such as an email address or SMS number, you can select it under Notification Channels.
Otherwise, you need to add a channel by selecting Manage Notification Channels. This opens the Notification channels pane, where you can add one or more channels. See Manage notification channels for more information. When you are done, return to the Configure notifications and finalize alert pane.
Note: You may need to click the refresh button next to Manage Notification Channels to display a new channel after you create it. Once you have selected one or more notification channels, click OK.
- In the Documentation field, you can add a message that will be sent with the notification. For example, the message might describe the reason for the alert, and contain links to documentation explaining how to respond to it.
- Click Next to review the details of the alert. If you are satisfied with them, click Create Policy to create the alerting policy.
Traffic spike alert
The following sections show how to create an alert that is triggered when the number of API requests over a 1 minute period exceeds 3600.
To create the alert:
In the Google Cloud console, go to the Monitoring > Alerting > Policies page.
- Click Select a Metric.
- Deselect the Active button.
Note: If there is no recent API traffic data in your organization, the metric in the next step won't be displayed unless this option is unselected.
- Select a metric as follows:
- Copy and paste the following in the Select a metric field:
apigee.googleapis.com/proxy/request_count
- Select Apigee Proxy.
- In the pane that opens to the right, select Proxy.
- In the next pane to the right, select Apigee proxy request count.
- Click Apply.
- Copy and paste the following in the Select a metric field:
- In the Transform data pane:
- Under Within each time series:
- In the Rolling window field, select 1 min.
- In the Rolling window function, select rate.
- Under Across time series, under Time series aggregation, select sum.
- Under Within each time series:
Configure the alert trigger
To configure the event that triggers the alert, first click Configure trigger in the left-hand pane. Then do the following steps:
- Under Condition type, select Threshold.
- In the Alert trigger field, select Any time series violates.
- In the Threshold position field, select Above threshold.
- In the Threshold value field, enter 60.
The reason you set Threshold value to 60 (rather than 3600) is that the units of Threshold value are per second. So if this threshold is maintained for 1 minute, there will be at least 3600 requests in that time period.
With these settings, an alert will be triggered when the total number of requests over a 1 minute period exceeds 3600.
Click Next to open the Configure notifications and finalize alert pane and following the steps in Set up a notification for the alert.
Latency alert
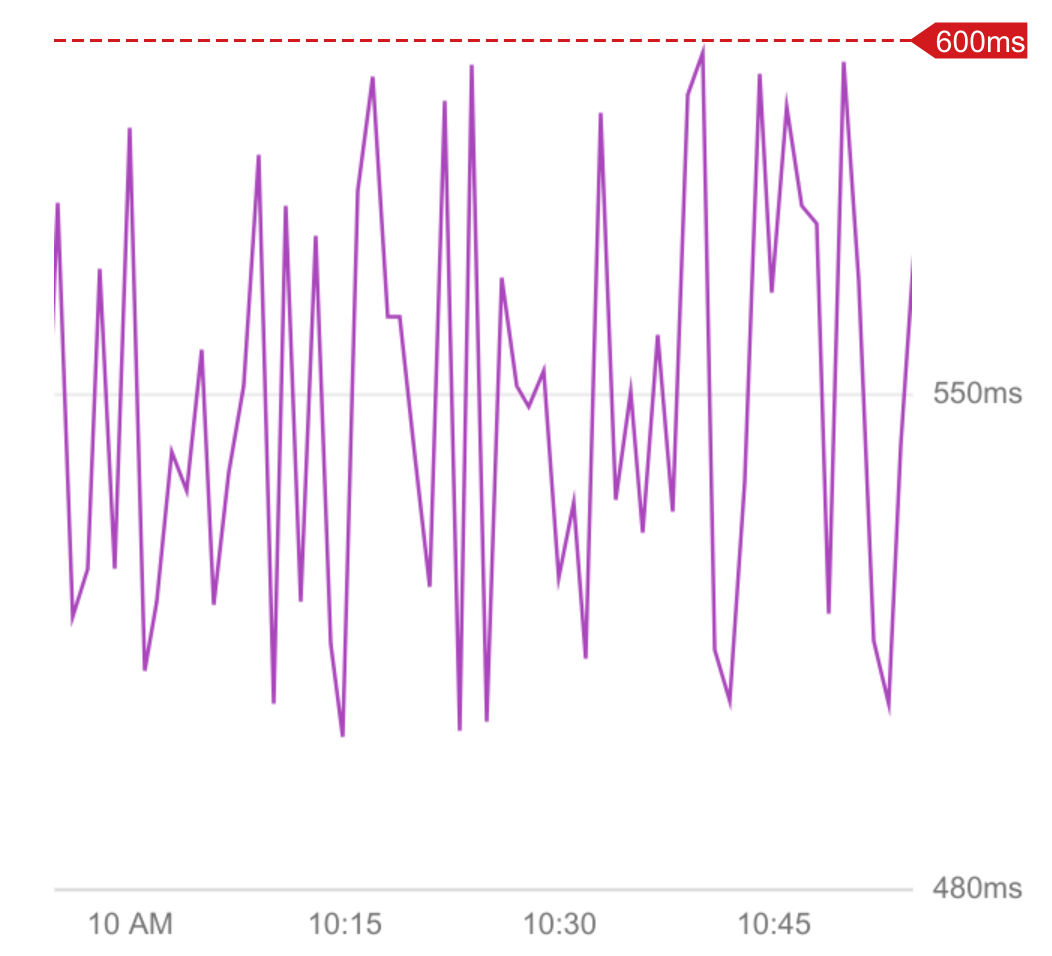
The following examples show how to create an alert that is triggered when the 95th percentile of the average latencies in the responses, over 10 minute intervals, is greater than 600 ms.
- Create the alert using Apigee or Apigee hybrid v1.12
- Create the alert using Apigee hybrid v1.10 or v1.11
Create the alert using Apigee or Apigee hybrid v1.12
To create the alert using Apigee:
In the Google Cloud console, go to the Monitoring > Alerting > Policies page.
- Click Select a Metric.
- Deselect the Active button.
Note: If there is no recent API traffic data in your organization, the metric in the next step won't be displayed unless this option is unselected.
- Select a metric as follows:
- Copy and paste the following in the Select a metric field:
apigee.googleapis.com/proxy/latencies
- Select Apigee Proxy.
- In the pane that opens to the right, select Proxy.
- In the next pane to the right, select Apigee proxy latencies.
- Click Apply.
- Copy and paste the following in the Select a metric field:
- In the Transform data pane, under Within each time series:
- In the Rolling window field, select 10 min.
- In the Rolling window function field, enter 95th percentile.
See Create the alert trigger to configure the event that triggers the alert.
Create the alert using Apigee hybrid v1.10 or v1.11
To create the alert using Apigee hybrid v1.10 or v1.11:
In the Google Cloud console, go to the Monitoring > Alerting > Policies page.
- Click Select a Metric.
- Deselect the Active button.
Note: If there is no recent API traffic data in your organization, the metric in the next step won't be displayed unless this option is unselected.
- Select a metric as follows:
- Copy and paste the following in the Select a metric field:
apigee.googleapis.com/proxyv2/latencies_percentile
- Select Apigee proxy (v2).
- In the pane that opens to the right, select Proxyv2.
- In the next pane to the right, select Percentile of Apigee proxy response latencies.
- Click Apply.
- Copy and paste the following in the Select a metric field:
-
Add a filter as follows:
- Click Add a Filter.
- Click in the Filter field and select percentile from the drop-down menu.
- In the Comparator, select =.
- In the Value field, type 95.
- Click Apply.
- In the Transform data pane, under Within each time series:
- In the Rolling window field, select 10 min.
- In the Rolling window function field, enter mean.
See Create the alert trigger to configure the event that triggers the alert.
Configure the alert trigger
To configure the event that triggers the alert, first click Configure trigger in the left-hand pane. Then do the following steps:
- Under Condition type, select Threshold.
- In the Alert trigger field, select Any time series violates.
- In the Threshold position field, select Above threshold.
- In the Threshold value field, enter 600.
With these settings, an alert will be triggered when the 95th percentile of the latencies is above the threshold of 600 ms.
Click Next to open the Configure notifications and finalize alert pane and following the steps in Set up a notification for the alert.
When you receive a notification and click the View In Apigee button
in the notification email,
the Investigate dashboard
will display a latency graph with the threshold, similar to the example shown: