| title | description | author | tags | date_published |
|---|---|---|---|---|
How to deploy Grafana on Cloud Run with Identity-Aware Proxy using Terraform |
Learn how to deploy Grafana serverless and restrict access to the dashboard. |
cgrotz,annamuscarella |
serverless, identity, proxy, sql |
2022-01-19 |
Christoph Grotz | Strategic Cloud Engineer | Google
Anna Muscarella | Strategic Cloud Engineer | Google
Contributed by Google employees.
This tutorial demonstrates how to deploy Grafana serverless and restrict access to the dashboard. This tutorial is for developers, DevOps engineers, and anyone interested in deploying serverless applications or restricting access to them.
To use this tutorial, you need basic knowledge of Google Cloud, Grafana, and Terraform, and you need to own a domain and be able to modify its A record.
- Run the Terraform script to deploy Grafana on Cloud Run with Cloud SQL as the database and Identity-Aware Proxy (IAP).
- Create a new user for accessing the dashboard.
- Explore and test the capabilities of Identity-Aware Proxy to restrict access to your Grafana dashboard.
This tutorial uses billable components of Google Cloud, including the following:
Use the pricing calculator to generate a cost estimate based on your projected usage.
First, required APIs (including IAM, Cloud Run, Compute Engine, Identity-Aware Proxy, and Cloud SQL) are enabled by the Terraform script. For
details, see the
main.tf Terraform script.
Enabling the APIs is necessary to allow the usage of the APIs during the deployment in your project.
Grafana requires a database for storing users, roles, data sources, and dashboards. Therefore, a Terraform script creates a Cloud SQL instance.
For details, see the
cloudsql.tf Terraform script.
The password for the database user is placed in Secret Manager for secured access. This tutorial uses a MySQL micro instance because only a small amount of data
is stored in MySQL.
The Cloud Run container is deployed using the Google Container Registry mirror of the Grafana container image and started. For details, see the
main.tf Terraform script.
The script also
passes required environment variables to the container,
such as information about the database connection and auth proxy.
To make sure that your Grafana dashboard is useful, a datasource for Cloud Monitoring is provisioned. This tutorial uses the
Grafana provisioning mechanism, which discovers data sources and dashboards
from the disk. Because Cloud Run instances don't have persistent volumes, you can't just place the data source and dashboard file into the file system. As a
workaround, the file is added as a secret to Secret Manager and then mounted to the required location so Grafana can pick up the data source correctly. For
details, see the
main.tf Terraform script.
With this, you have mock data in your dashboard. An alternative is to use
Cloud Storage FUSE, which allows you to mount a Cloud Storage bucket into the file
system, but this requires modifying the Docker image.
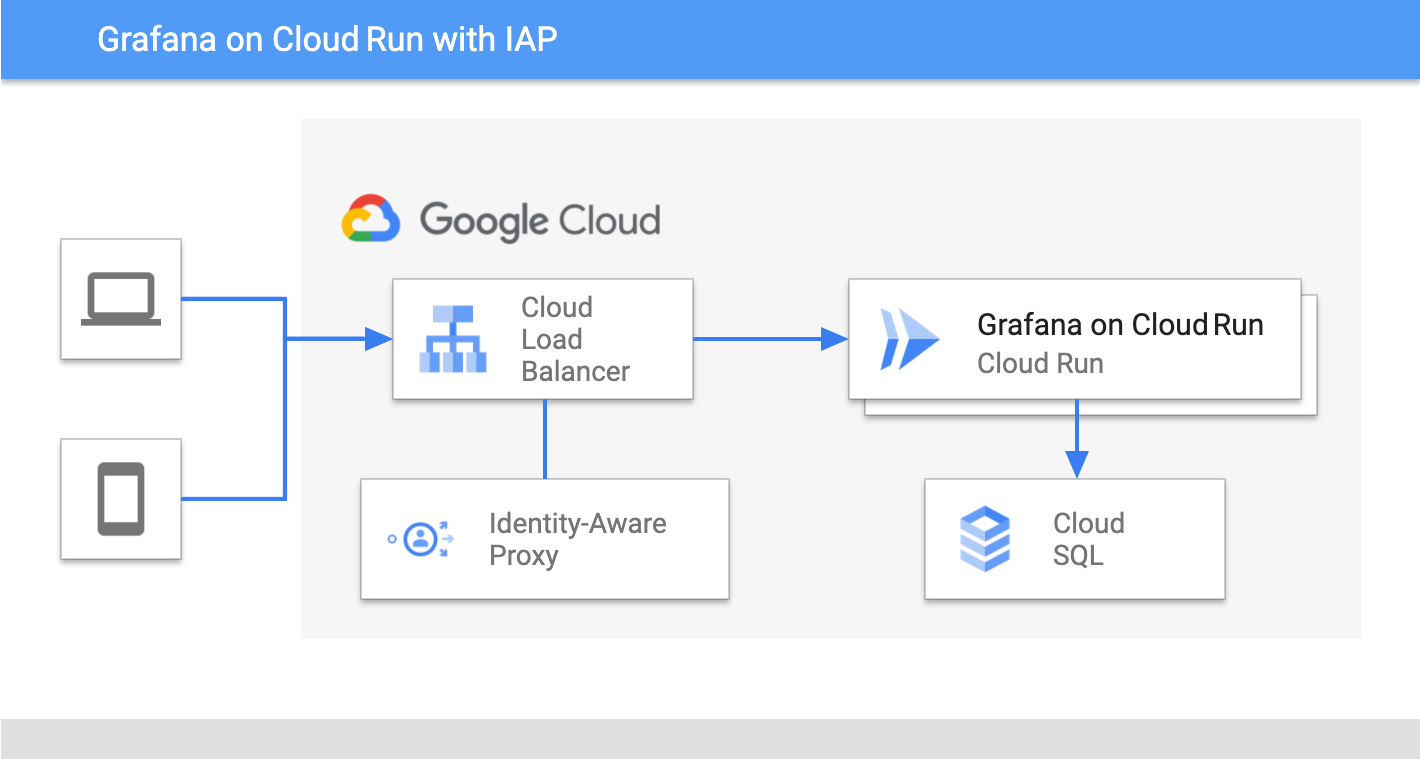
To access your Grafana dashboard, Cloud Load Balancer is configured to service HTTPS traffic from Cloud Run using a serverless network endpoint group (NEG) as a
backend service. Identity-Aware Proxy (IAP) is integrated with the Load Balancer backend service, as shown in the
lb.tf Terraform script. The client ID and
secret are passed to the Load Balancer configuration. IAP provides headers containing the authorization information to applications secured with it.
For more information, see Securing your app with signed headers. Grafana provides the
functionality to receive such header information for authentication.
To complete this tutorial, you need a Google Cloud account, a Google Cloud project with billing enabled, and Terraform installed and enabled.
- Create or select a Google Cloud project.
- Enable billing for your project.
- Choose a region to host your project in, ideally one that’s close to you. For information about available regions, see Regions and zones.
- Make sure that you know the domain name where you will host your Grafana dashboard, and make sure that you are able to edit the A record for this domain.
In this section, you configure an OAuth consent screen for Identity-Aware Proxy.
-
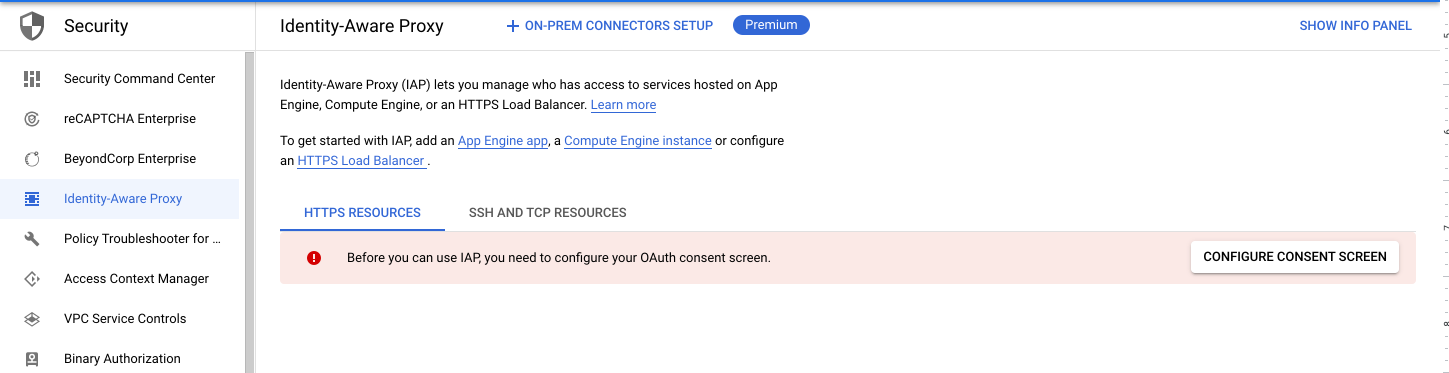
Go to the Identity-Aware Proxy page in the Cloud Console.
If you are prompted to enable the IAP API, then do so.
If you haven't already configured a consent screen, then you are prompted to do so:
-
Click the Configure Consent Screen button, choose Internal under User type, and click Create.
You select Internal to allow only users that are part of your Cloud Identity organization to use Grafana. This option requires you to have a Cloud Identity organization. If you want to enable IAP with external identities, you need to use Google Cloud Identity Platform, which is not covered in this tutorial.
-
Click Save and continue within the Scopes step
-
Enter the app name and user support email address, and then click Save and continue until the process is complete.
If you see the following error message while deploying, this means you have not configured the consent screen for your Google Cloud project:
Error: Error creating Client: googleapi: Error 404: Requested entity was not found.
│
│   with google_iap_client.project_client,
│   on lb.tf line 79, in resource "google_iap_client" "project_client":
│   79: resource "google_iap_client" "project_client" {
│
In this section, you set up the environment in order for the project to deploy.
-
Download the source code for this tutorial:
git clone https://github.com/GoogleCloudPlatform/community.git -
Go to the
codefolder:cd ./community/tutorials/serverless-grafana-with-iap/code -
Set the required environment variables:
export TF_VAR_project_id=$GOOGLE_CLOUD_PROJECT
export TF_VAR_domain=[YOUR_DOMAIN]
Replace
[YOUR_DOMAIN]with the domain on which to host your Grafana dashboard. -
Initialize Terraform:
terraform init
-
Create an execution plan and verify all of the steps:
terraform plan -
Apply the changes:
terraform applyThe deployment may take up to 15 minutes.
-
Confirm that the deployment has been executed successfully.
You should see the IP address of your load balancer printed in the console as in this example:
module.lb-http.google_compute_global_forwarding_rule.https[0]: Creation complete after 11s [id=projects/[YOUR_PROJECT_ID]/global/forwardingRules/tf-cr-lb-https] Apply complete! Resources: 8 added, 0 changed, 0 destroyed. Outputs: external_ip = "[YOUR_EXTERNAL_IP]" -
Copy the value of
external_ip. -
Add an A record from your domain to this IP address.
If you are managing your domain through Google Cloud, then you can do this step in Cloud DNS. If not, an A record can be set through your domain registrar.
-
Wait 10 minutes for Google Cloud Load Balancer to perform certificate checks.
To grant users access to your Grafana instance, you need to grant them the role IAP-Secured Web App User for the resource.
Grant your user account the necessary role with the following command:
gcloud iap web add-iam-policy-binding \
  --resource-type=backend-services \
  --member='user:[YOUR_USER_ACCOUNT_EMAIL_ADDRESS]' \
  --service='tf-cr-lb-backend-default' \
  --role='roles/iap.httpsResourceAccessor'
You can open Grafana by visiting [YOUR_DOMAIN] from the browser. Because the database is automatically provisioned, your user will only have Viewer
permissions in Grafana. If you want to elevate your user to an Admin, you need to access the MySQL instance and modify the user table entry for your user.
Open a new Incognito browser window and visit [YOUR_DOMAIN]. You will be forwarded to your configured OAuth
consent screen. After you log in, you should also have access to Grafana.
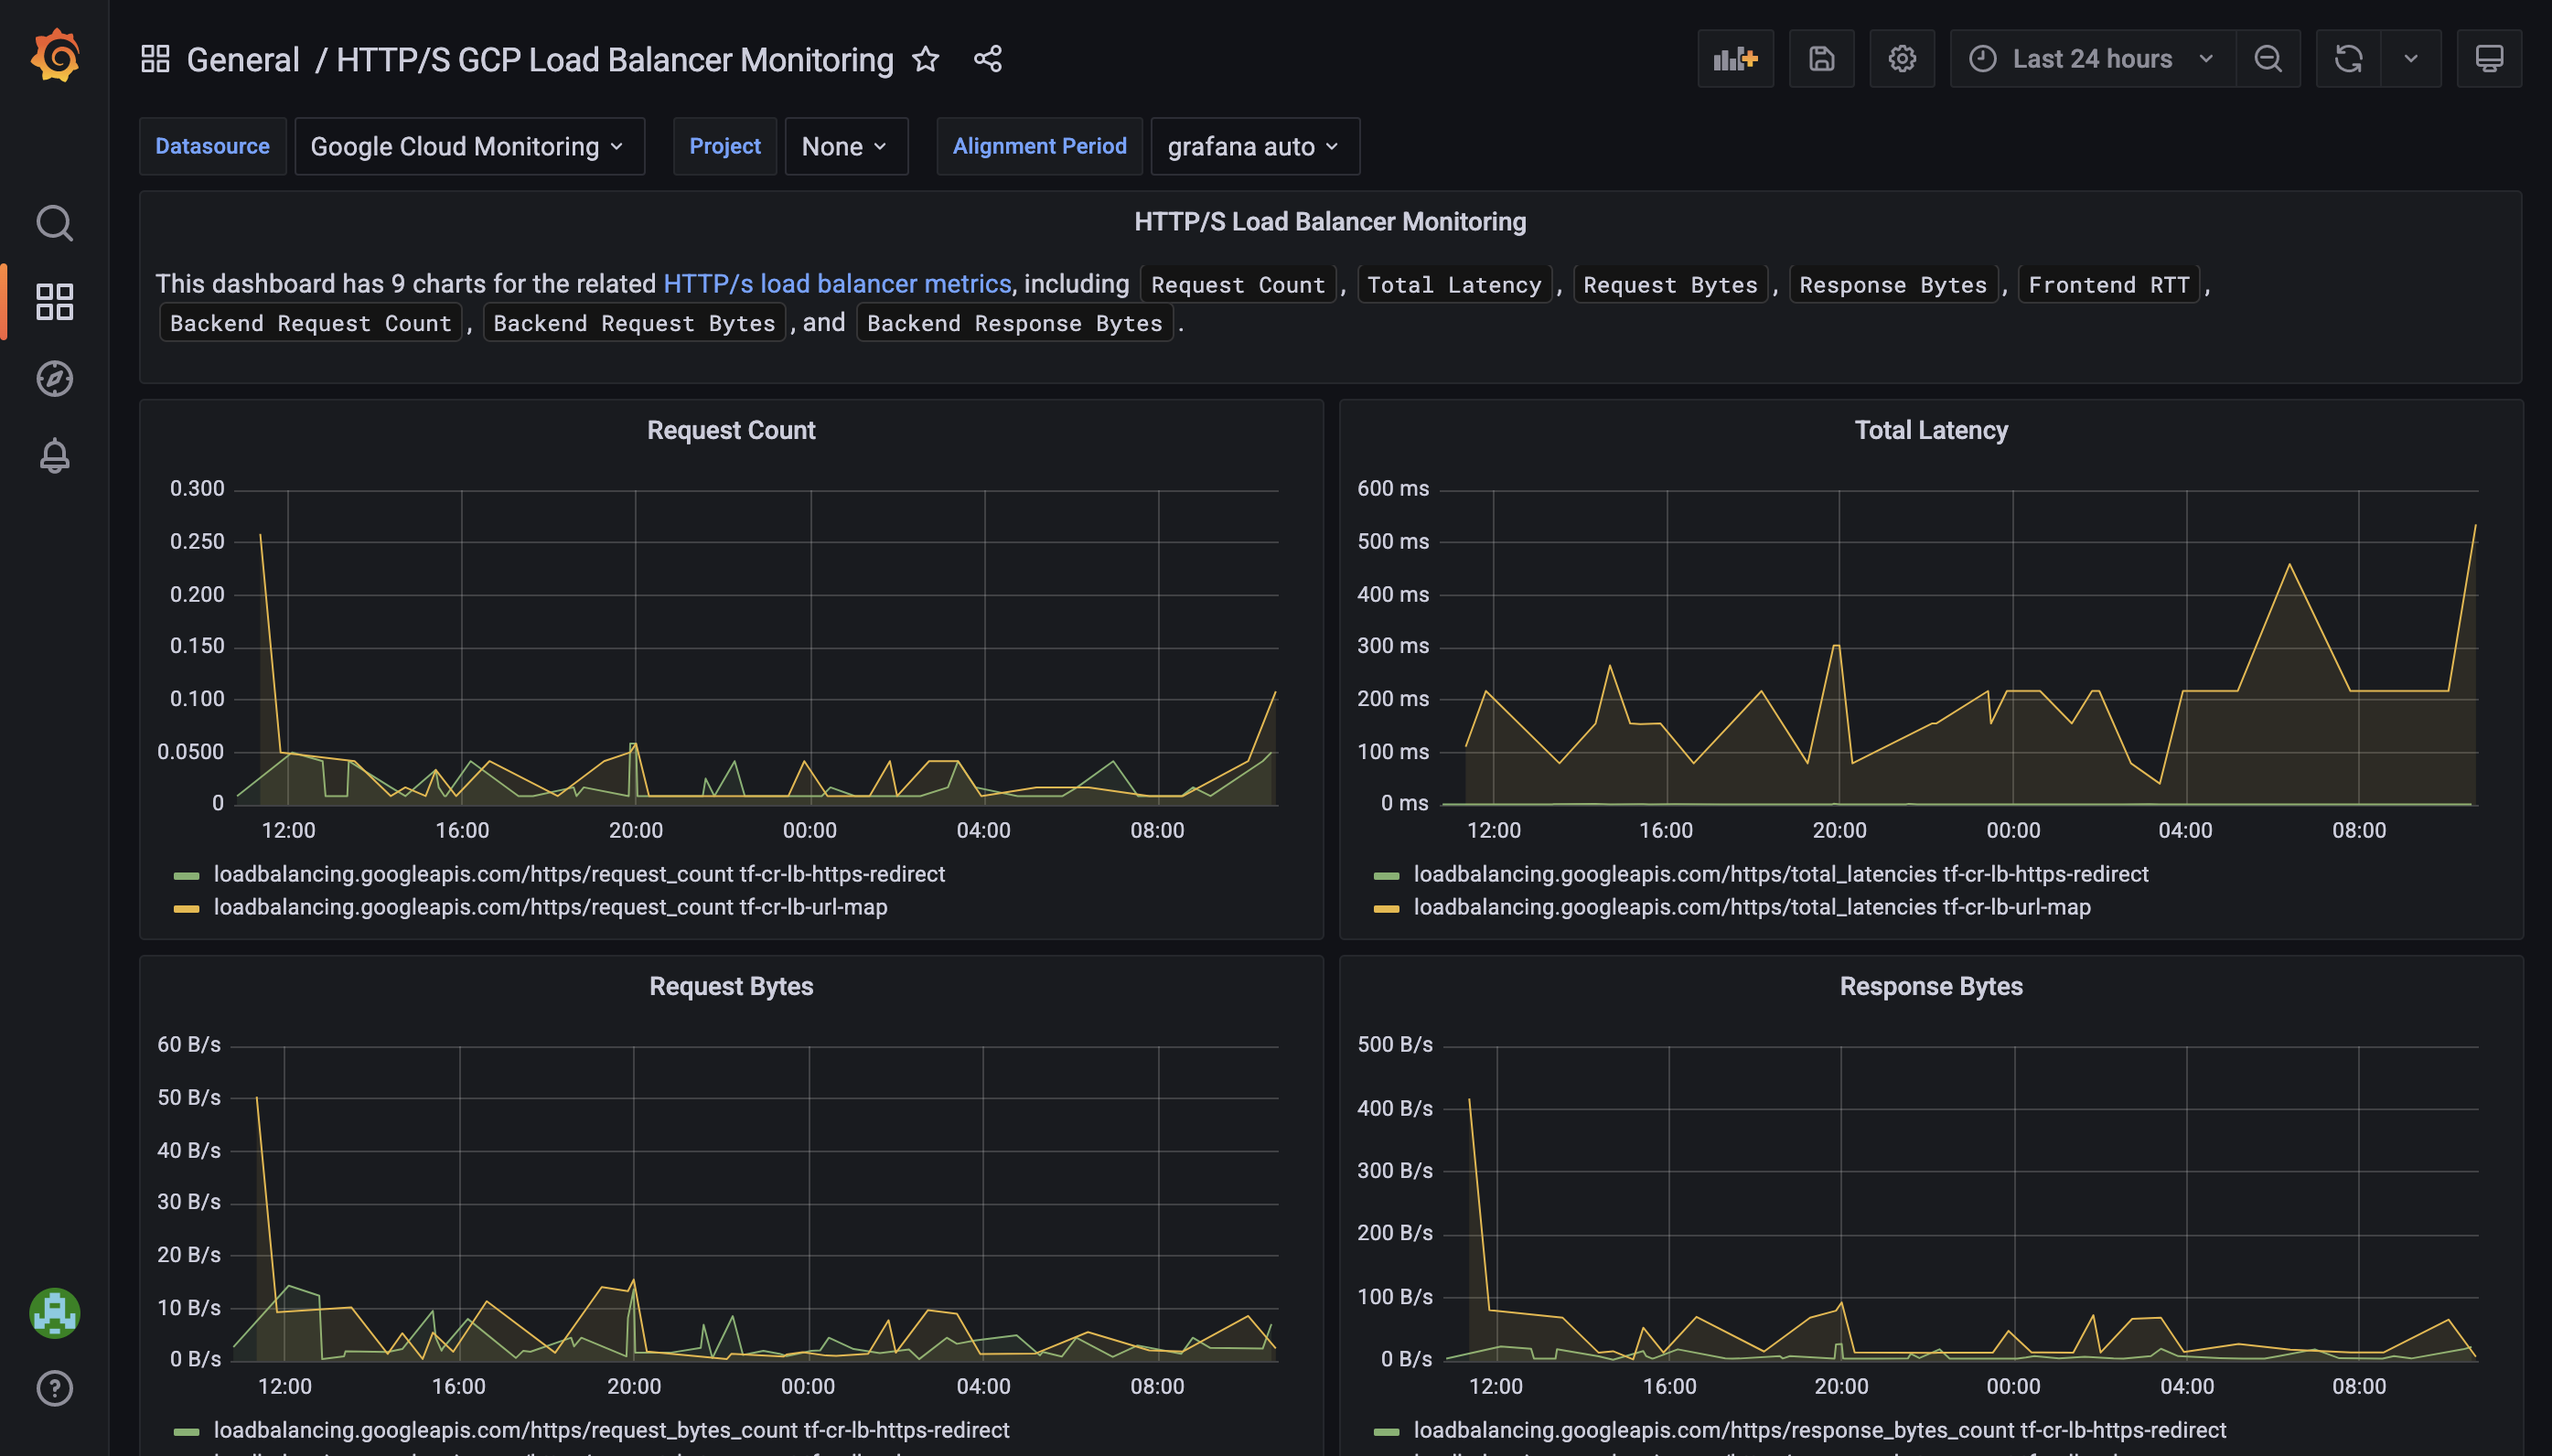
You now have a serverless deployment of Grafana up and running, connected with Google Cloud Monitoring and secured using Identity-Aware Proxy. You can now access and log in to Grafana using your browser and accessing your domain. There should already be a dashboard available monitoring Google Cloud Load Balancing for you. This provides you with reduced worries around properly hosting your Grafana dashboards, while also providing a very low cost solution to hosting Grafana. If you want to use the alerts feature from Grafana, consider keeping some CPU allocated; otherwise alerts might not be triggered.
To avoid incurring charges to your Google Cloud account for the resources used in this tutorial, you can use Terraform to delete most of the resources. If you created a new project for deploying the resources, you can also delete the entire project.
To delete resources using Terraform, run the following command:
terraform destroy
To delete the project, do the following:
- In the Cloud Console, go to the Projects page.
- In the project list, select the project you want to delete and click Delete.
- In the dialog, type the project ID, and then click Shut down to delete the project.
There have been configuration behavior changes in Grafana 9.2 that affect this tutorial. For details, see
the discussion in this GitHub issue.
Because we recommend that you verify the proper signing of the token, we removed the proxy config option.
This could mean that if you are updating from the previous configuration to the updated configuration in
this tutorial, the provider of the users in your user_auth will change, and permissions and roles might
not be carried over.