Cloud SQL Query Insights GA for MySQL: Query Load, Tags, Query Plans!
Abirami Sukumaran
Staff Developer Advocate, Google
Cloud SQL Query Insights GA for MySQL: Query Load, Tags, Query Plans!
Near Real Time Database Performance Insights is key to any application in order to reduce the Mean Time To React and mitigate a possible disaster. As modern full stack developers, we juggle a lot of roles, from development on business requirements to sharing responsibilities with operations’ and administrators in ensuring performance, responsiveness, scalability, flexibility and security. Performance monitoring and troubleshooting (and trouble-shoo-ing) of databases and applications is somewhere on the top of that list too.
I just got tired listing them all. Imagine the plight of development teams who may or may not have the time, bandwidth and expertise to troubleshoot, trace performance issues and analyze complex query plans. That is where the developers, operations team and administrators could use simple, easy to use tools to detect, diagnose, prevent and monitor application and query performance issues. However today database performance troubleshooting requires multiple tools to correlate data, making it a time-consuming task that requires expertise. Also, in a distributed and complex application stack, it is very hard to identify which part of the application is the source of a slow running query.
That’s why we’re excited to announce that Cloud SQL Query Insights for MySQL is now GA! Query Insights is a set of tools to detect, diagnose and prevent performance problems for Cloud SQL for MySQL databases.
Key Benefits of Query Insights
Query Insights helps investigate and detect problematic queries, find the root cause of the problem and find the source, all in a single user journey. My favorite part of Cloud SQL Query Insights for MySQL is that you can go troubleshooting with it as a workflow either top-down or bottom-up. Let me explain. It means, you can monitor database performance at an application level and trace the source of a problematic SQL query across the application stack by model, view, controller, route, user and host top-down or you could go down to the exact data part that caused the load and work your way up the stack. Also there are other cool features that I personally am excited to learn and use, like:
Query insights is supported on all Cloud SQL machine types and available in all Google Cloud regions
Query insights metrics are encrypted at rest and users who have access to the Cloud SQL dashboard can access Query insights metrics on the Query insights dashboard
Query insights can integrate with your existing application monitoring (APM) tools and Google Cloud services by using open standards and APIs
Doesn't occupy any storage space in your Cloud SQL instance, it is always-on with minimum performance impact and no additional cost - you can access one week of data on the Query insights dashboard
Metrics are stored in Cloud Monitoring which means you can leverage the power of Cloud Monitoring and Prometheus to integrate your application logs and traces
In this blog…
We will learn how to use query insights to troubleshoot a slow running pet clinic app. For this, we will create a Cloud SQL for MySQL Instance, create a database, a few tables and insert records using SQL scripts. Build an application on Spring Boot that accesses the Cloud SQL database, containerized by Jib and deployed on Cloud Run. We will use the example from this codelab for creating a small, quick Pet Clinic with Owners, Pets, Vets and Visits information. We will add new functionality to include a performance-intensive query (included in code-snippets). We will see how we can engage Cloud SQL Query Insights for MySQL Query in the journey of performance monitoring and troubleshooting.
Application Architecture
The following diagram shows an overview of the high level technical architecture of the example before we look into the components in the below sections:
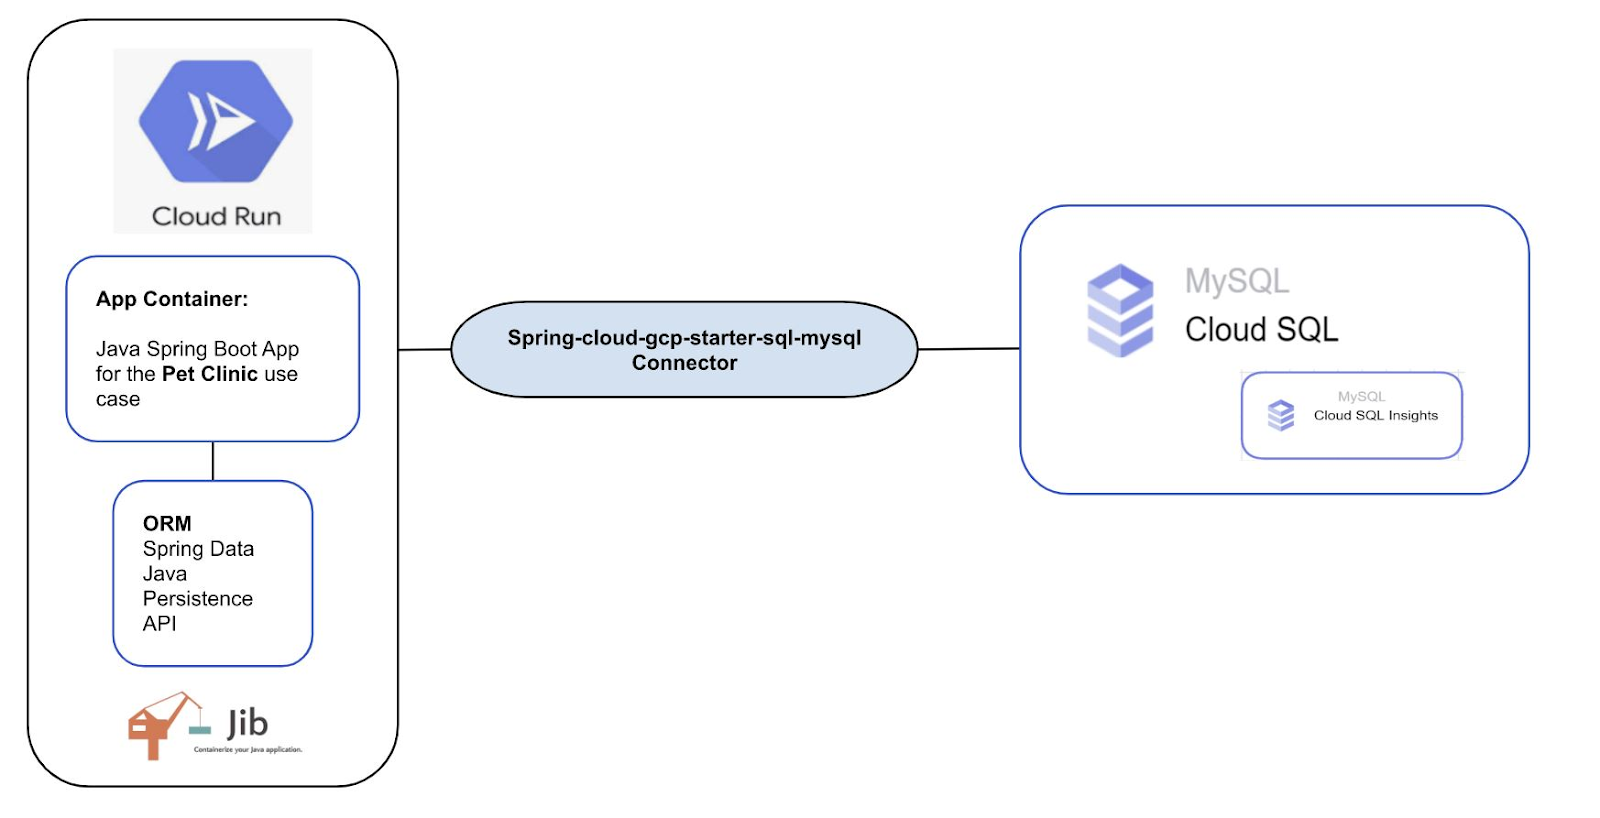
We have taken a Spring - Cloud SQL for MySQL application using JPA ORM and the objective here is to showcase how we can automate and simplify the process of Query Performance analysis, troubleshooting and monitoring using Cloud SQL Query Insights for MySQL!
Database and Application Setup
1. Create Project, Enable Billing, Set Up Cloud Shell, Cloud Run- In the Google Cloud console, on the project selector page, select or create a Google Cloud project
- Make sure that billing is enabled for your Cloud project. Learn how to check if billing is enabled on a project
- While Google Cloud can be operated remotely from your laptop, you'll use Cloud Shell, a command-line environment running in Google Cloud
- If not already, please follow the steps here to activate Cloud Shell, check you are already authenticated and set to your PROJECT_ID
- If, for some reason, the project is not set, simply issue the following command:
gcloud config set project <PROJECT_ID> - From Cloud Shell, enable Cloud Run API:
gcloud services enable run.googleapis.com
Cloud SQL for MySQL is a fully-managed database service that helps you set up, maintain, manage, and administer your MySQL relational databases on Google Cloud Platform. For information specific to MySQL, see the MySQL documentation or learn more about Cloud SQL for MySQL
- After Cloud Shell launches, you can use the command line to create a new Cloud SQL instance:
$ gcloud sql instances create <<instance-name>> - Now create a database that you will use for the Petclinic app:
$ gcloud sql databases create petclinic --instance <<instance-name>> - You can also access and configure the instance via the Cloud Console
- Get the instance connection name in the format project-id:zone-id:instance-id by running the following command - You will use this in configuring your Spring Boot app
$ gcloud sql instances describe my-instance | grep connectionName
Follow the steps in this codelab to bootstrap the Spring Application in your project.
Note:
- In your src/main/resources/application-mysql.properties file, if you have created a separate database user and password or changed password for root in the database instance, remember to add the below the connection-name configuration:
spring.datasource.username=<<user>>spring.datasource.password=<<password>>
- Build and run the application!
./mvnw package./mvnw spring-boot:run4. Let’s make changes to the app and data to increase query complexity!
We’ll make some changes to the data to increase it in volume and query complexity for testing our insights:
- Connect to MySQL from Cloud Shell by navigating to your MySQL Cloud SQL instance from Google Cloud Console and clicking on the “OPEN CLOUD SHELL” link from the Overview page:
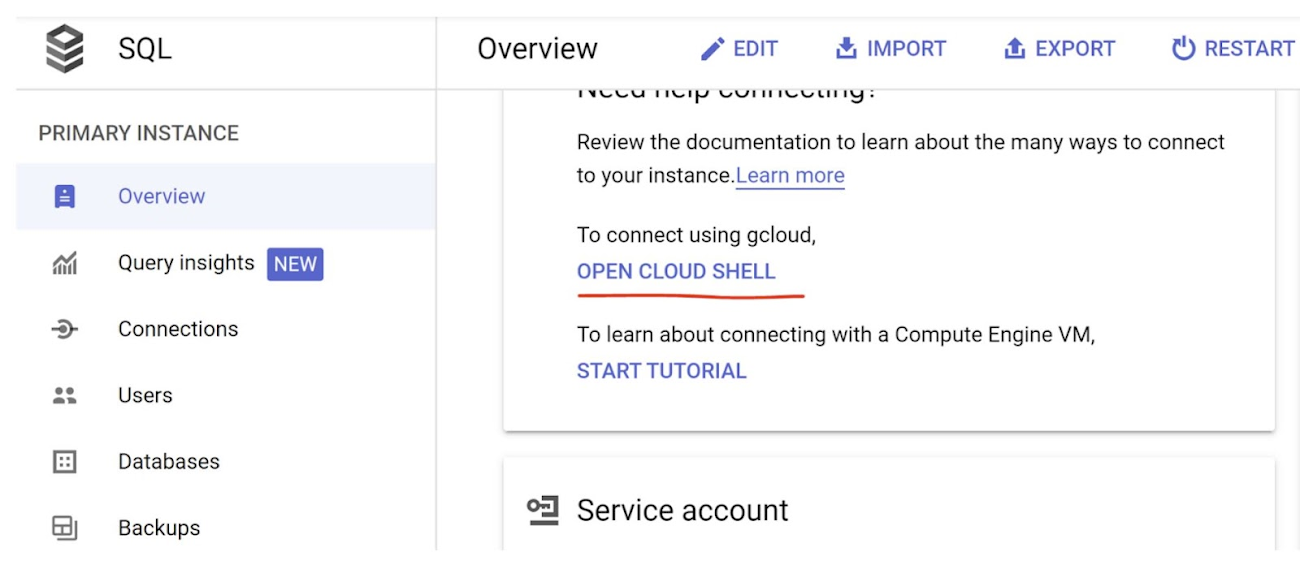
On the Cloud Shell prompt that opens up, enter the command that loads by default, if it doesn’t load, use the below command:
gcloud sql connect <<instance-name>> --user=root
On the Query Prompt, run the contents of the file in the location link
This will load 20,000 rows to the “owners” table in the petclinic database
At this point, you can choose to stop and skip to step 5 or stay with me and customize your app a little further to add some complex query functionality
Add feature to list only owners without pets by using a checkbox:
Add the below code snippet to OwnerRepository.java:
spring-petclinic/src/main/java/org/springframework/samples/petclinic/owner/OwnerRepository.java
Modify the method
findPaginatedForOwnersLastName(int page, String lastname)with the below code snippet in OwnerController.java:spring-petclinic/src/main/java/org/springframework/samples/petclinic/owner/OwnerController.java
Method:
Modify the file findOwners.html by inserting the below code in the “lastNameGroup” div:
spring-petclinic/src/main/resources/templates/owners/findOwners.htmlRebuild and run the application!
./mvnw package./mvnw spring-boot:run
- Before proceeding, you need to activate the Container Registry API, if not done:
$ gcloud services enable containerregistry.googleapis.com- Run Jib to build a Docker image and publish to Container Registry
$ ./mvnw com.google.cloud.tools:jib-maven-plugin:3.1.1:build \ -Dimage=gcr.io/$GOOGLE_CLOUD_PROJECT/<<your-container-name>>6. Deploy it on Cloud Run
Run the following command to deploy your containerized app to Cloud Run:gcloud run deploy <<application>> --image gcr.io/$GOOGLE_CLOUD_PROJECT/<<container>> --platform managed --region us-central1 --allow-unauthenticated --update-env-vars DBHOST=$DB_HOST
- When the deployment is done, you should see the deployed service URL in the command line
- When you hit the service URL, you should see your web page on the browser and the logs in the Cloud Logging Logs Explorer page
7. Enable Query Insights for MySQL
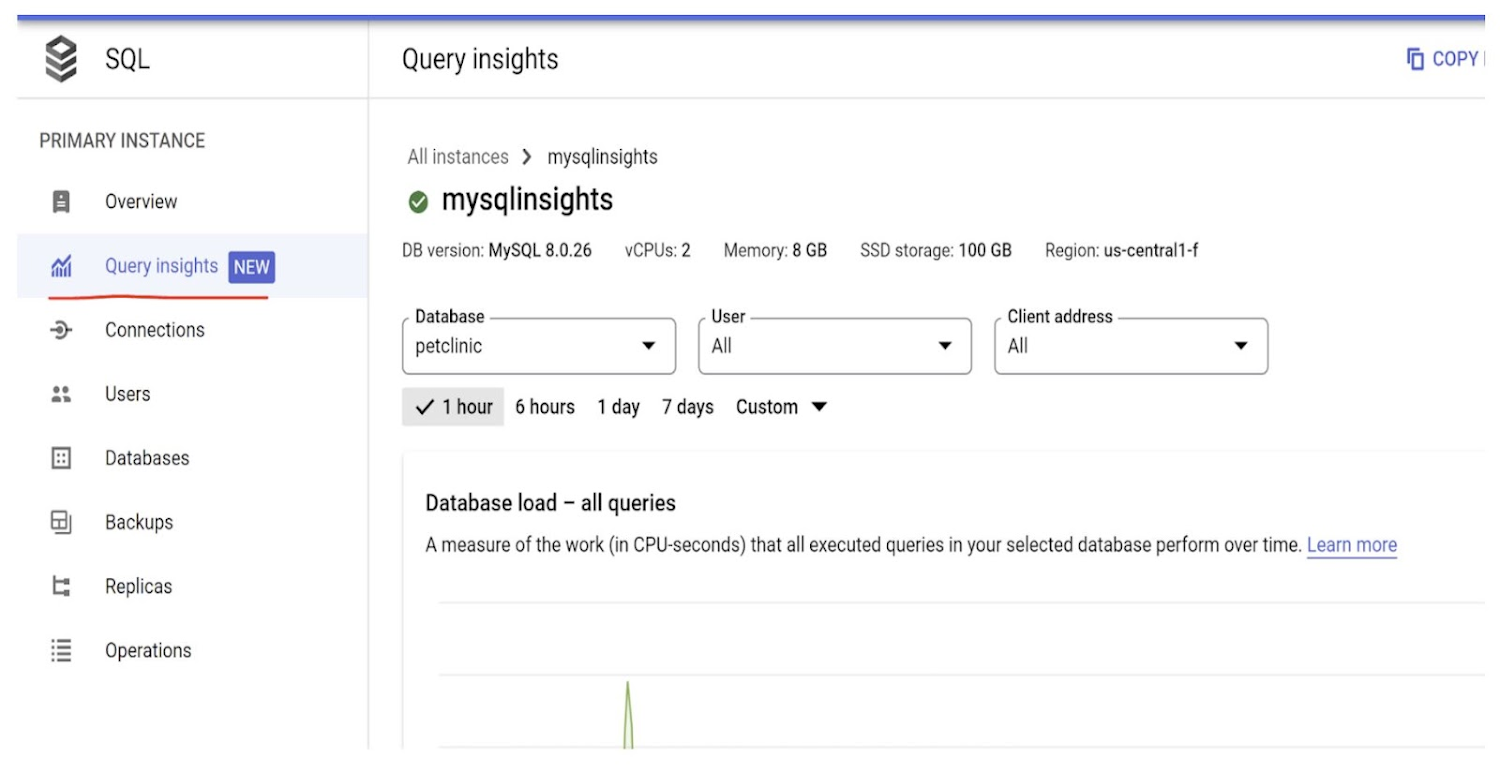
Enable Cloud SQL Query Insights for MySQL by following instructions in this link. You can use one of the 3 methods - Console, gcloud, REST v1. Once it is enabled make sure you are able to see the option “Query Insights” on the left pane right below Overview:
Now that we have established all the steps necessary for using the application and monitoring Query Insights, let's dive into Query Insights Steps in detail.
Using Query Insights
Query Insights helps improve database query performance with the following steps:
View database load for all queries
Identify a potentially problematic query or tag (sqlcommenter tag to queries)
Examine the query or tag to identify issues
Trace the source of the problem
Let us take a look at each of these steps for a quick overview of the insights for our application. To proceed with that, first click the application URL you saved earlier.
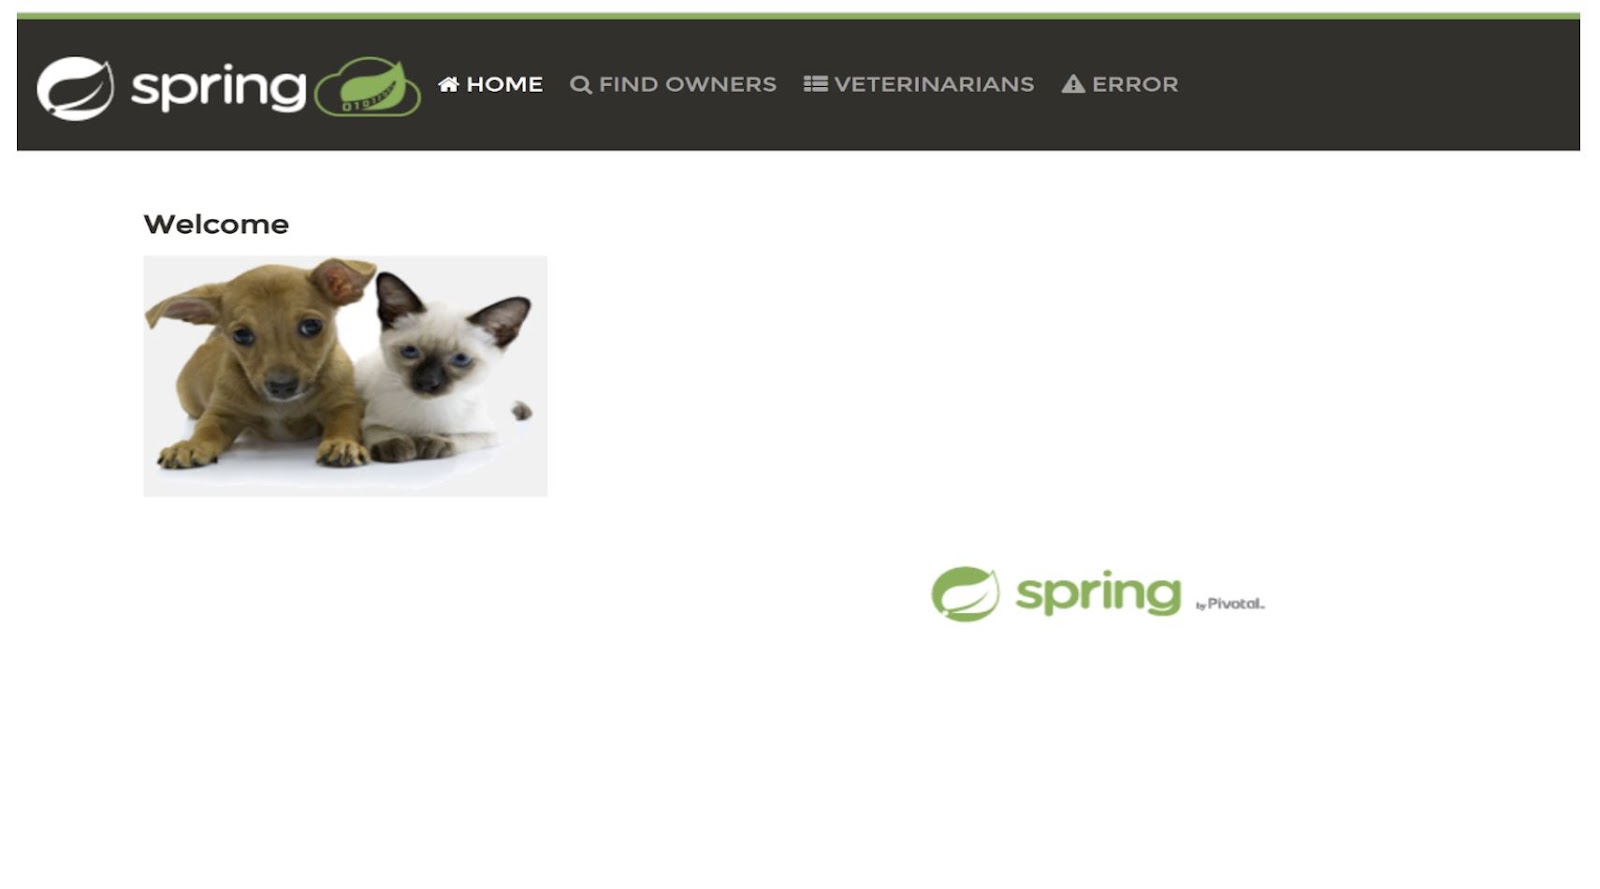
Load the HOME page:
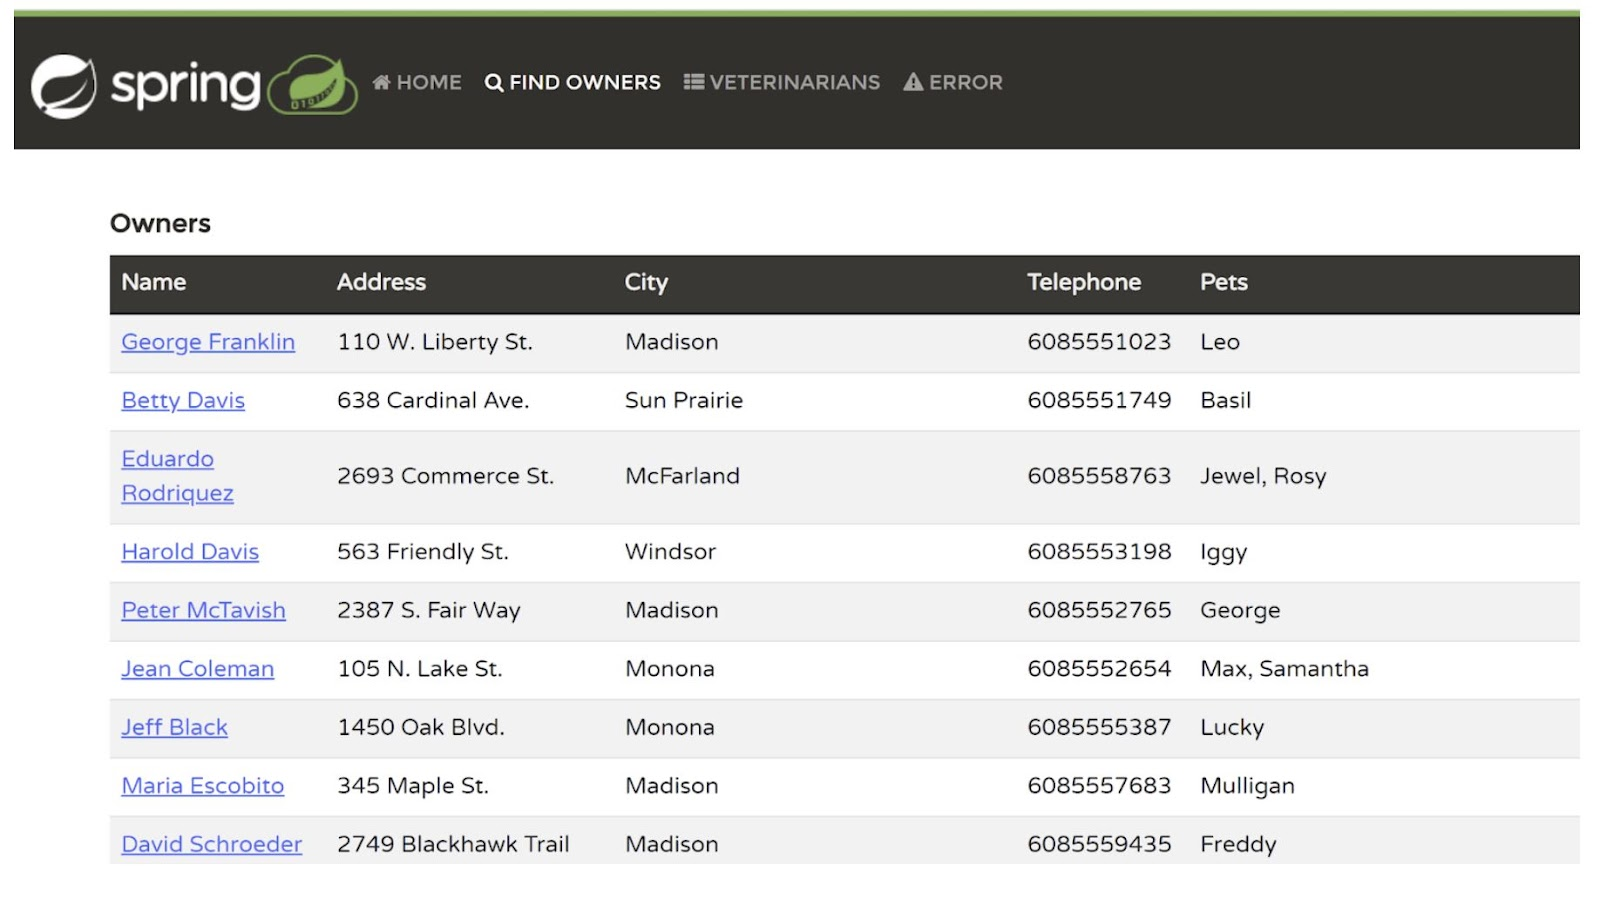
Click “FIND OWNERS” menu item:
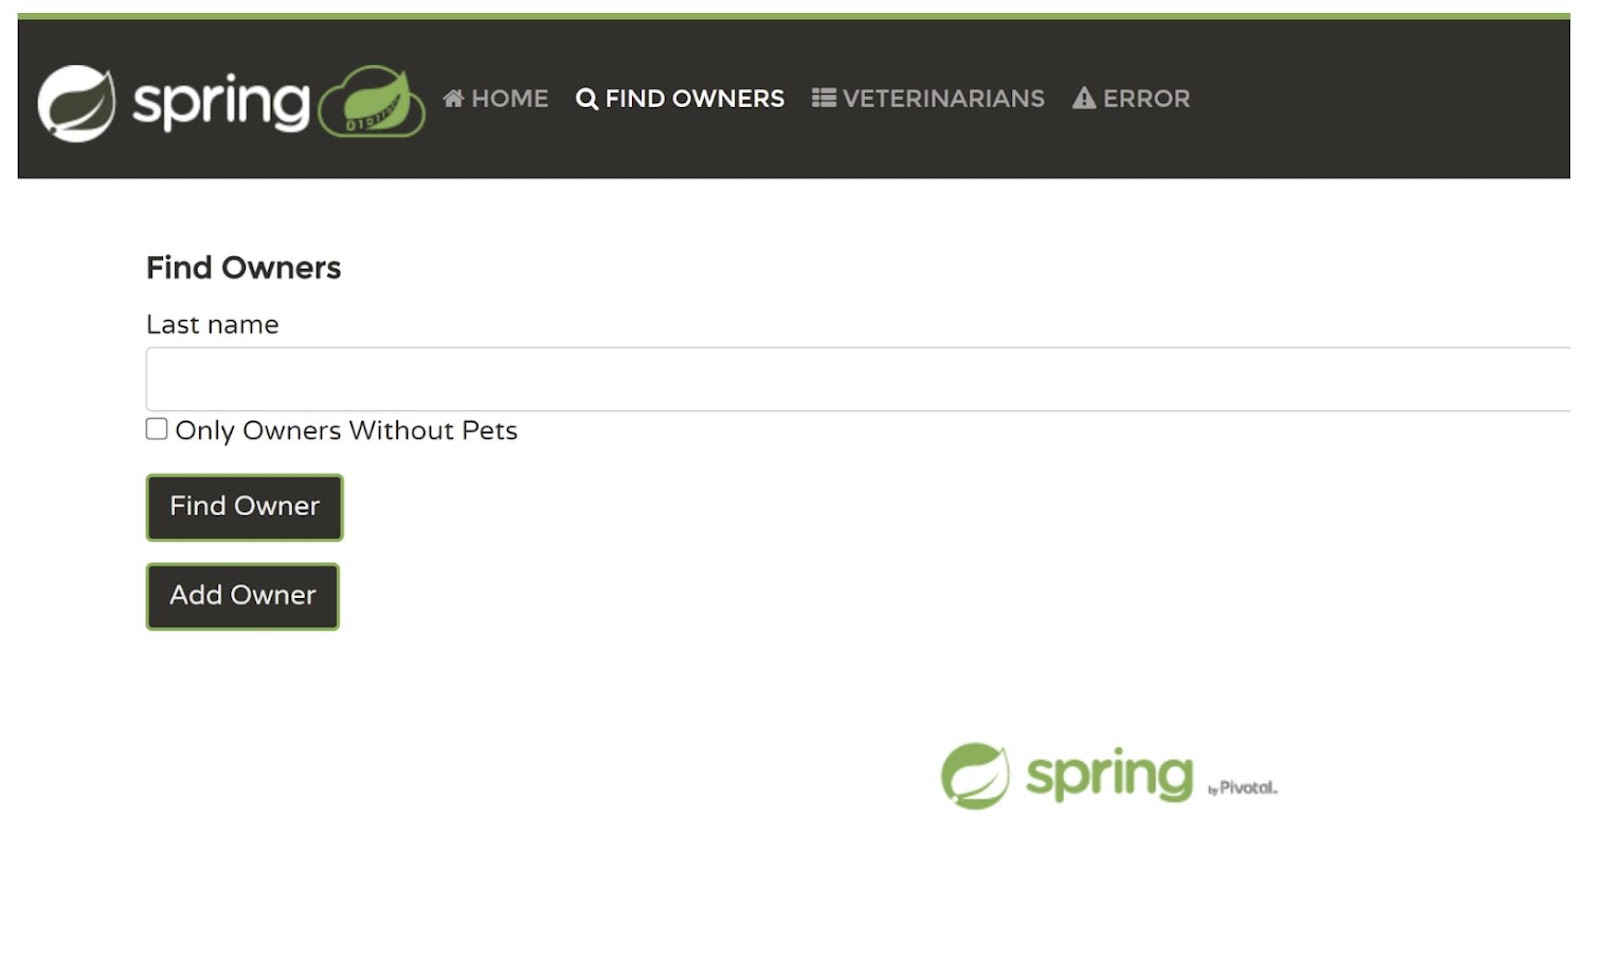
Check “Only Owners Without Pets” checkbox and click “Find Owner”:
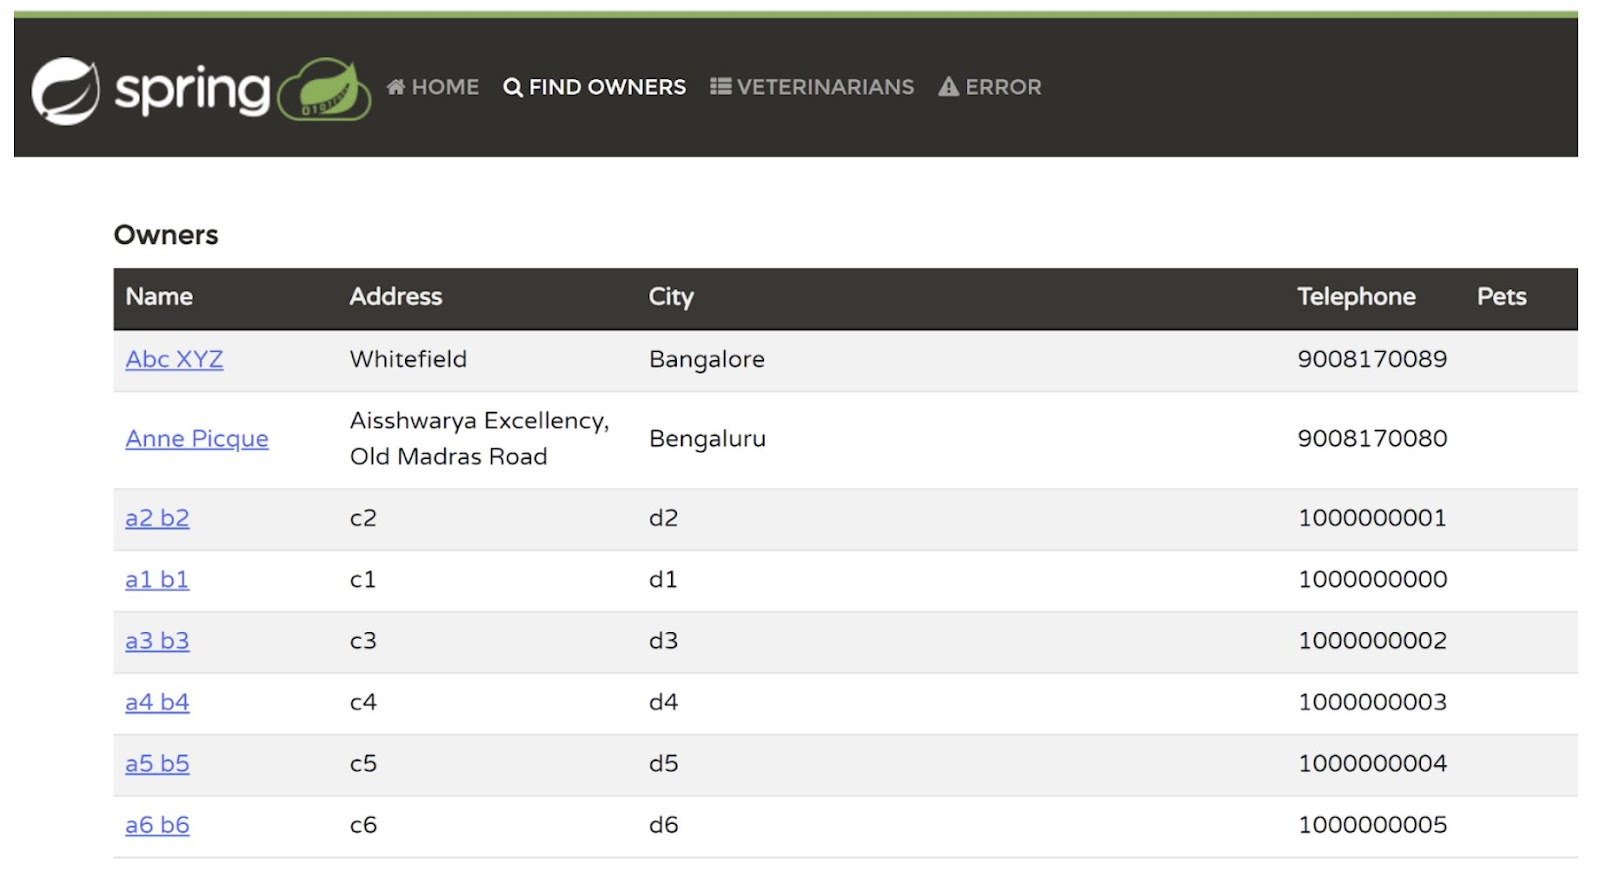
Click “FIND OWNERS” again and click “Find Owner” without checking the checkbox and also try to click one of the 804 page links in the bottom of the page and see the response:
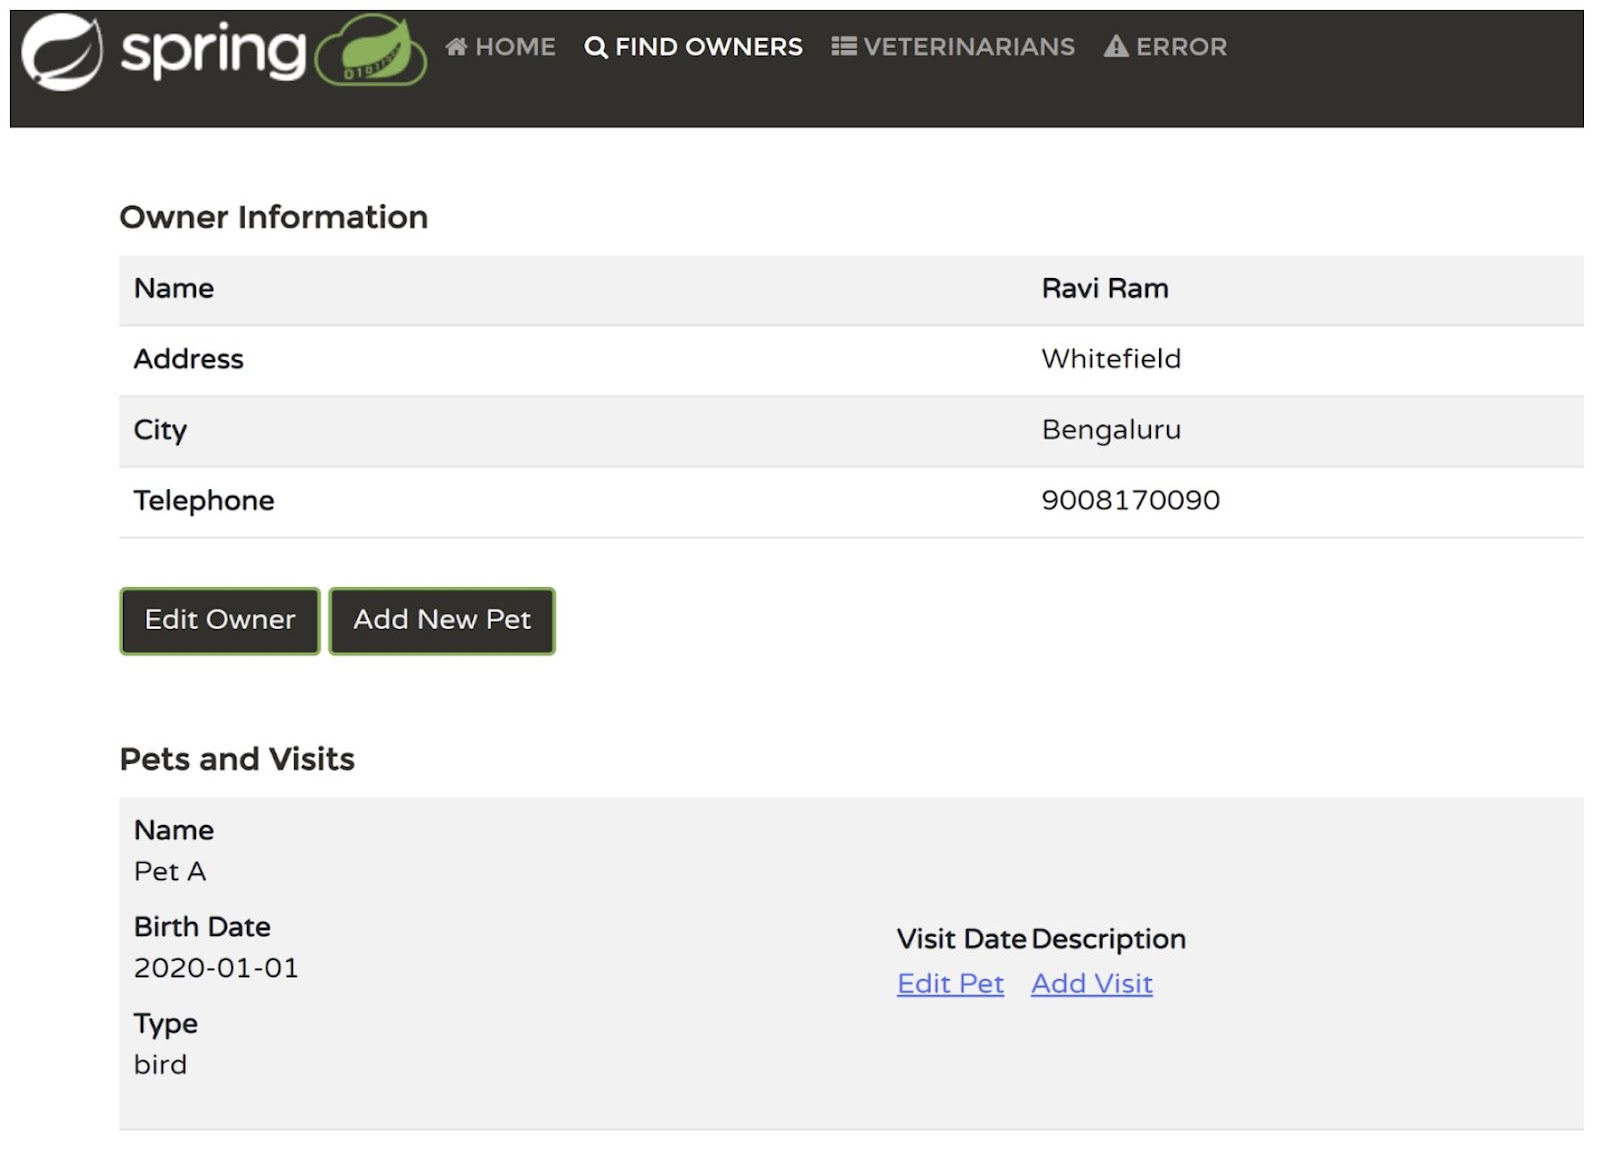
Click “FIND OWNERS” and click Add Owner button. Enter details and add a pet:
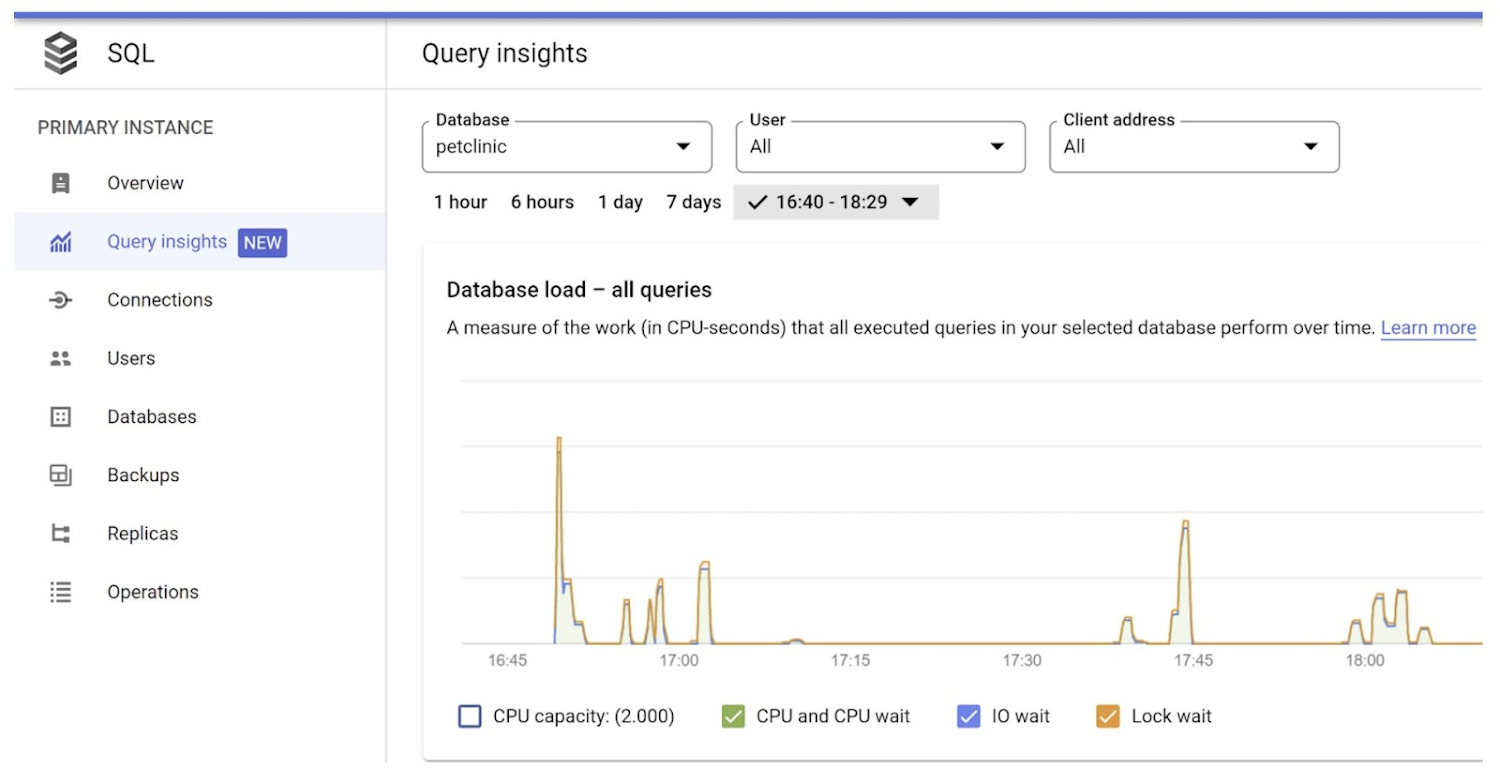
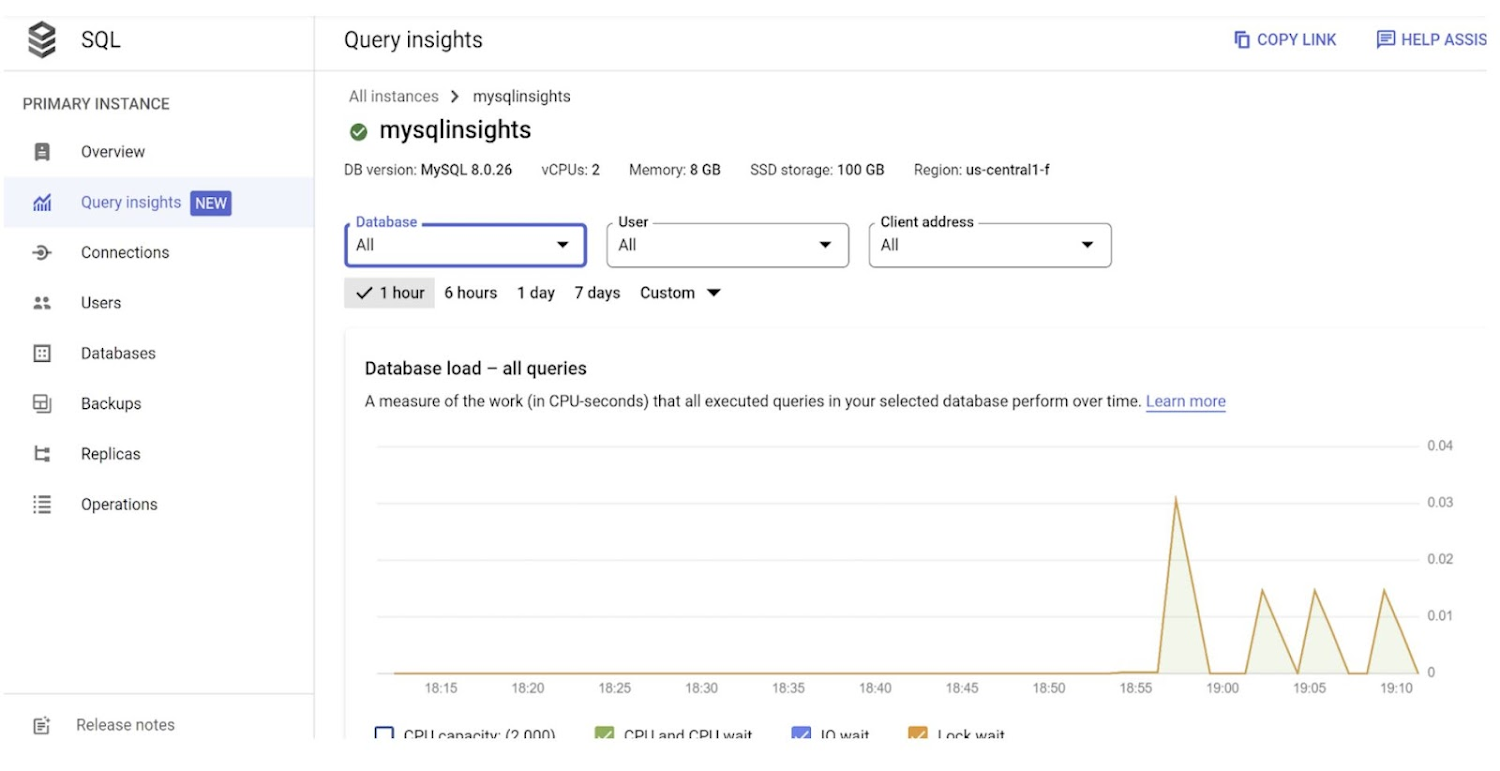
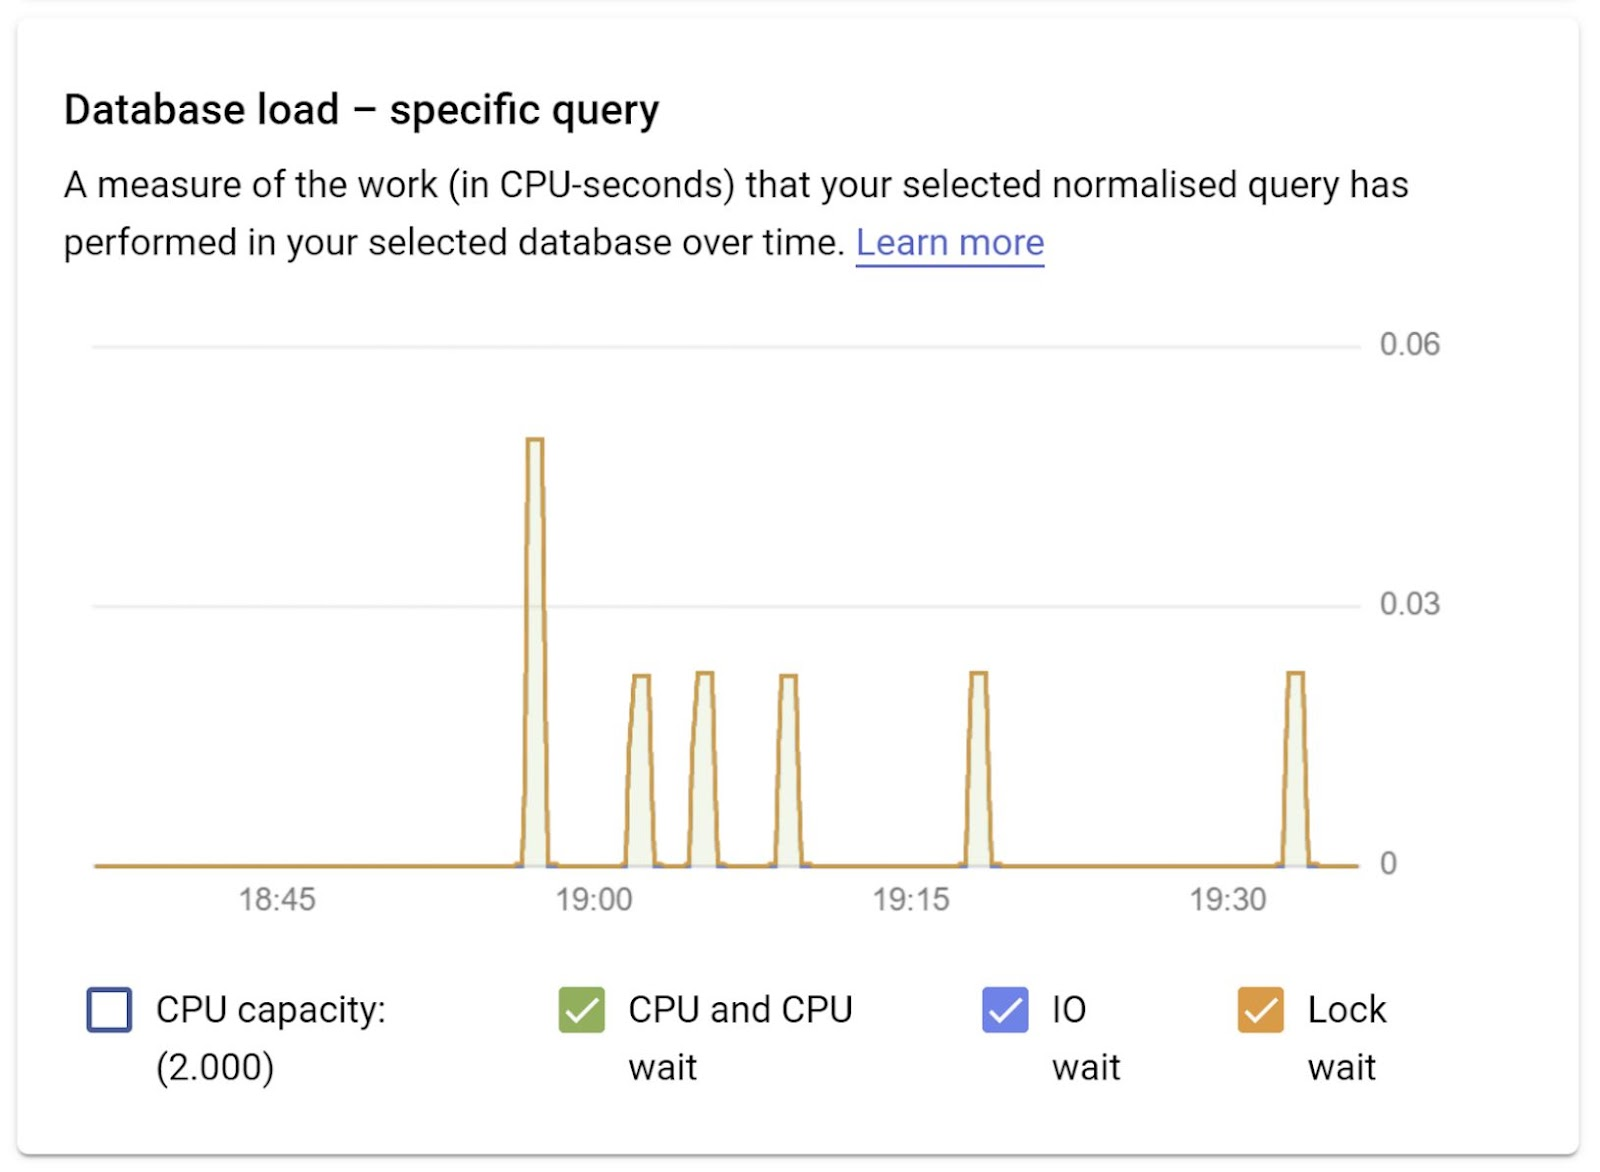
Database Query Load is a measure of the work (in CPU seconds) that the executed queries in your selected database perform over time. The top-level Query insights dashboard shows the Database load — all top queries graph. Drop-down menus on the dashboard let you filter the graph for a specific database, user, or client address. In the below screenshot, you can see the load spike for all queries in our petclinic database at 2 points:
You can filter the database load by queries or tags.
Filter by Queries:
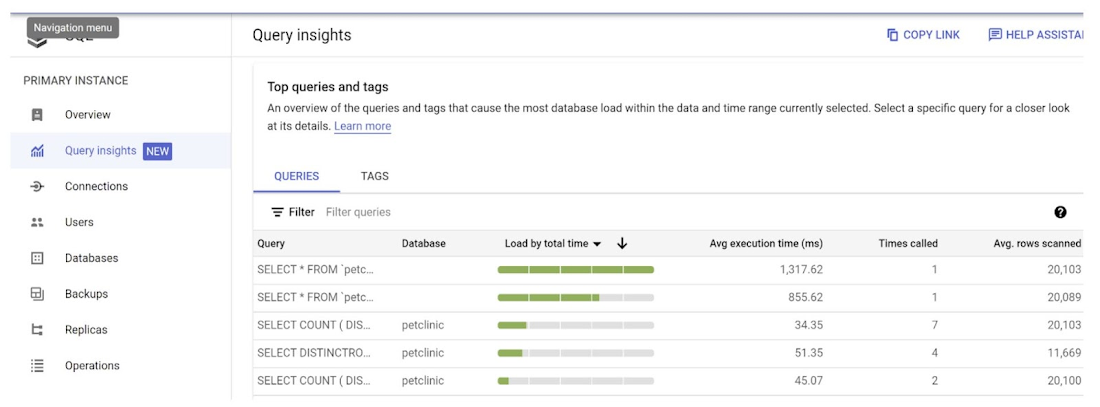
The Queries table provides an overview of the queries that cause the most query load. This is called the “Top SQL” in many database tools. The table shows all the normalized queries (queries that are validated for their construct, data type compatibility, correctness and more) for the time window and options selected on the Query insights dashboard. It sorts queries by the total execution time during the time window that you selected. In our example, you can see the query that has taken the maximum load by looking at the top most query:
Filter by Tags:
To troubleshoot an application with tags, you must first add tags to your SQL queries. Query load tags provide a breakdown of the query load of the selected tag over time. There are two ways to add tags to your SQL queries:
1. Using sqlcommenter to tag automatically with ORM2. Using sqlcommenter to tag manually
For more information about sqlcommenter and how to use it in your ORM framework, see the sqlcommenter documentation. If you're not using ORM, you must manually add sqlcommenter tags or comments in the correct SQL comment format to your SQL query. You must also enrich each SQL statement with a comment containing a serialized key-value pair. Use at least one of the keys - action, controller, framework, route, application, db driver.
3. Examine a specific query or tag
To determine whether a query or a tag is the root cause of the problem, do the following from the Queries tab or Tags tab, respectively:
To sort the list in descending order, click the Load by total time header
Click the query or tag at the top of the list. It has the highest load and is taking more time than the others
A dashboard opens showing the details of the selected query or tag:
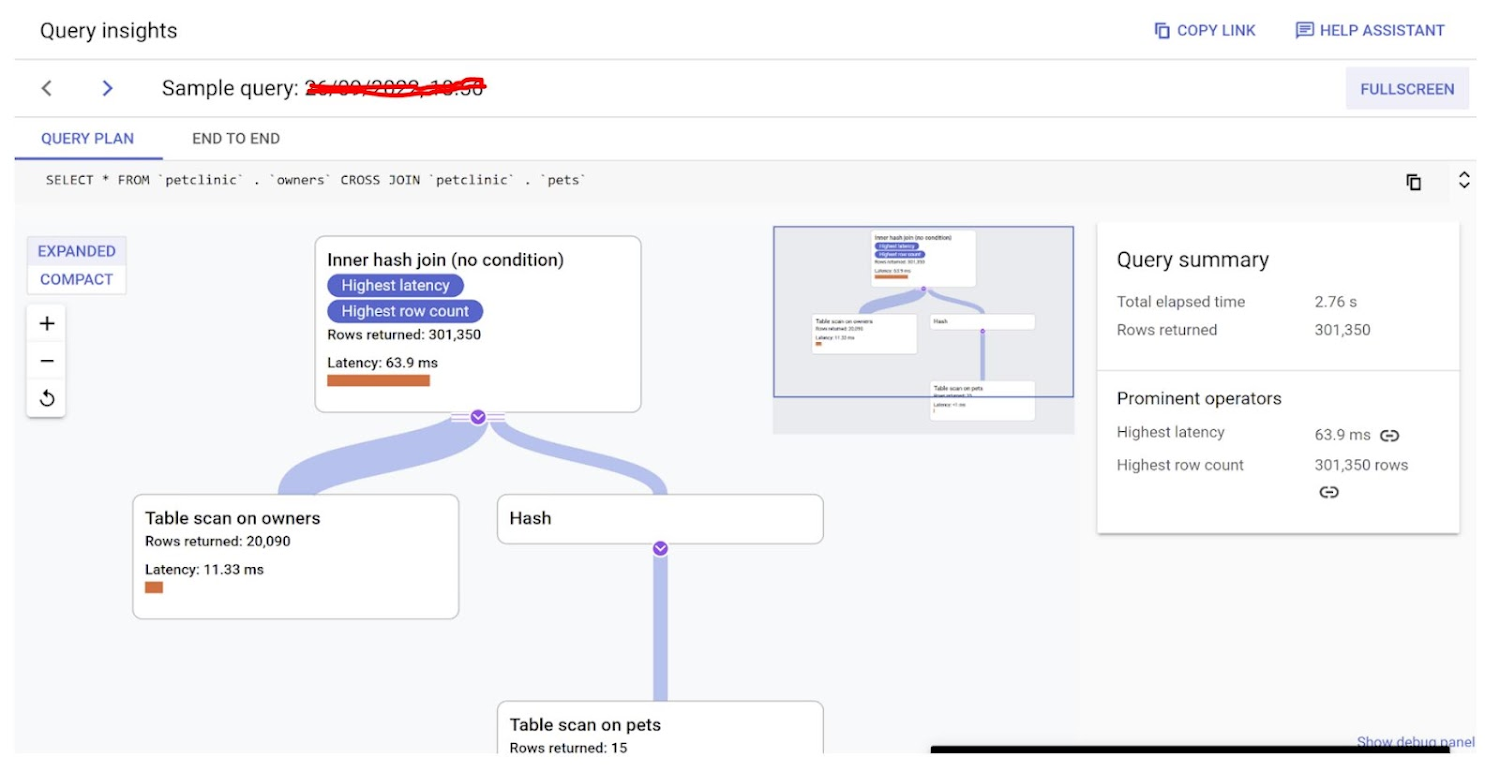
In our experiment, for a table scan of 20,105 rows, we have returned 301,350 as you can see the issue caused by Cartesian Product in the query. This incorrect join (cross join) in the code without where conditions has led to this glitch in the query causing it to be the top load.
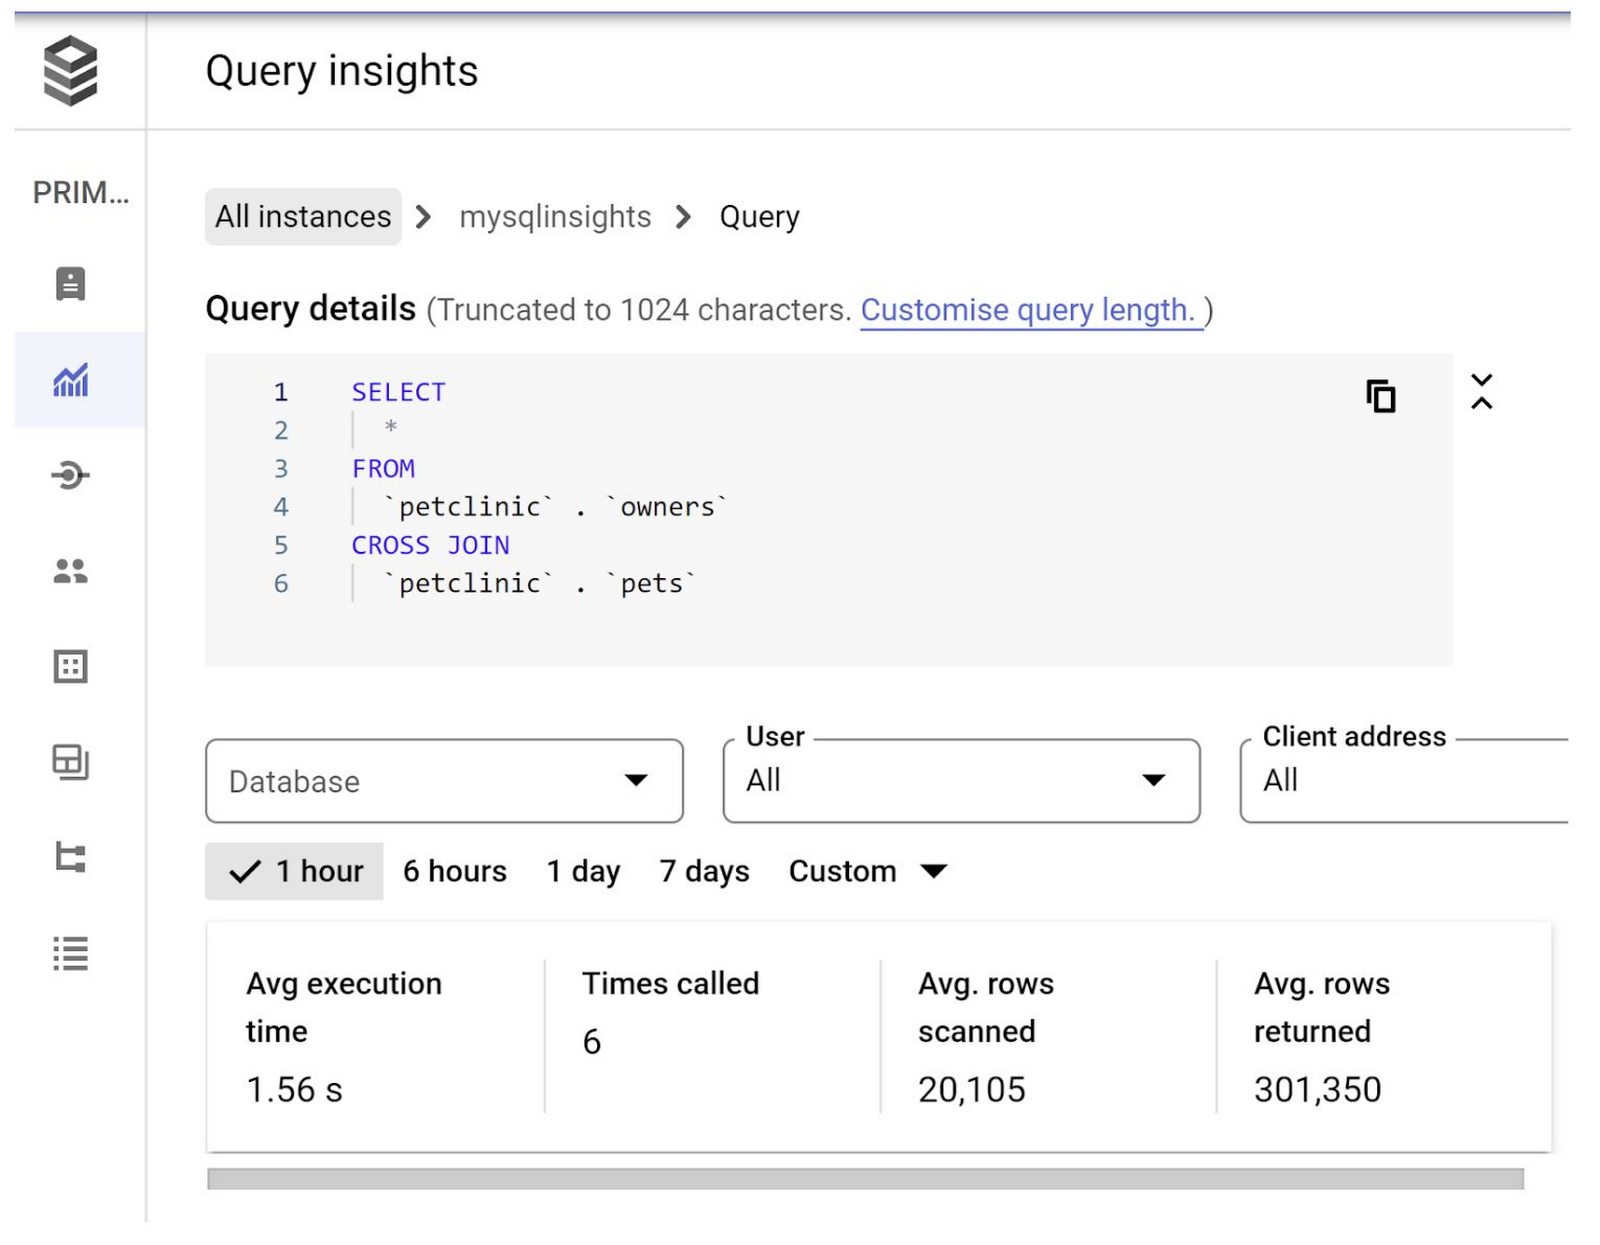
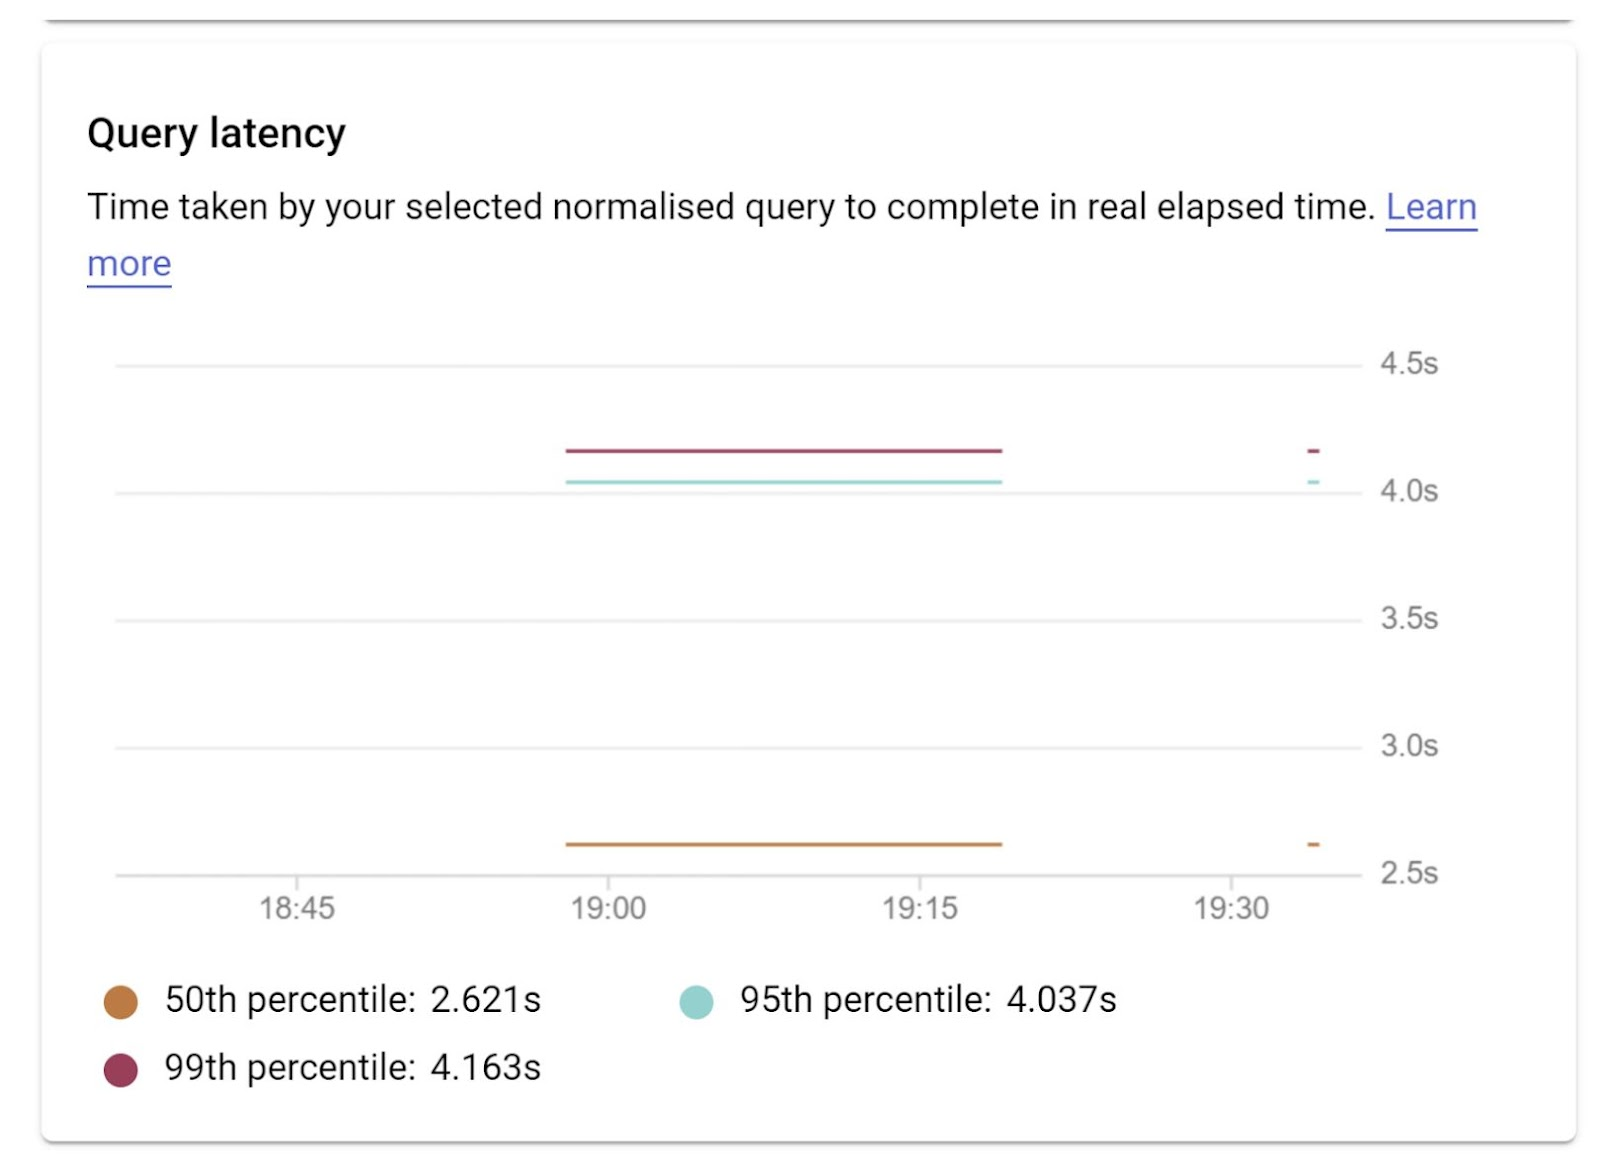
The latency for our selected query:
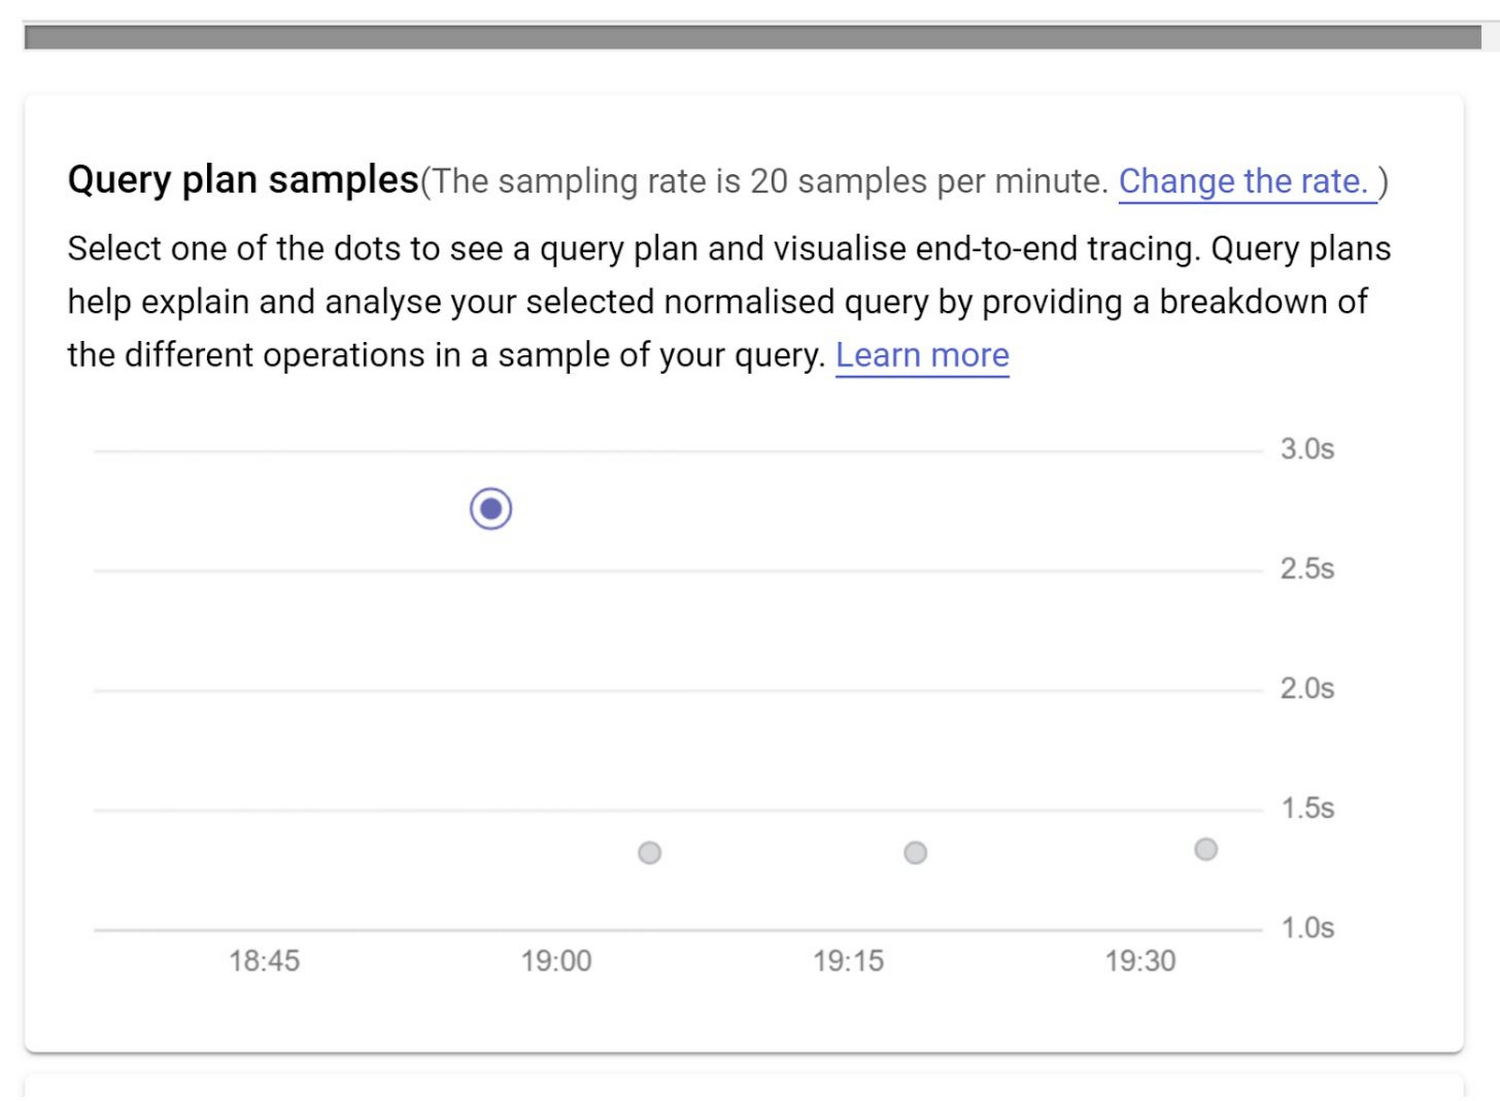
Examine operations in a sampled query plan for the selected query:
A query plan takes a sample of your query and breaks it down into individual operations. It explains and analyzes each operation in the query. The Query plan samples graph shows all the query plans running at particular times and the amount of time each plan took to run.
In our example, the query with the highest data load, below is the query plan: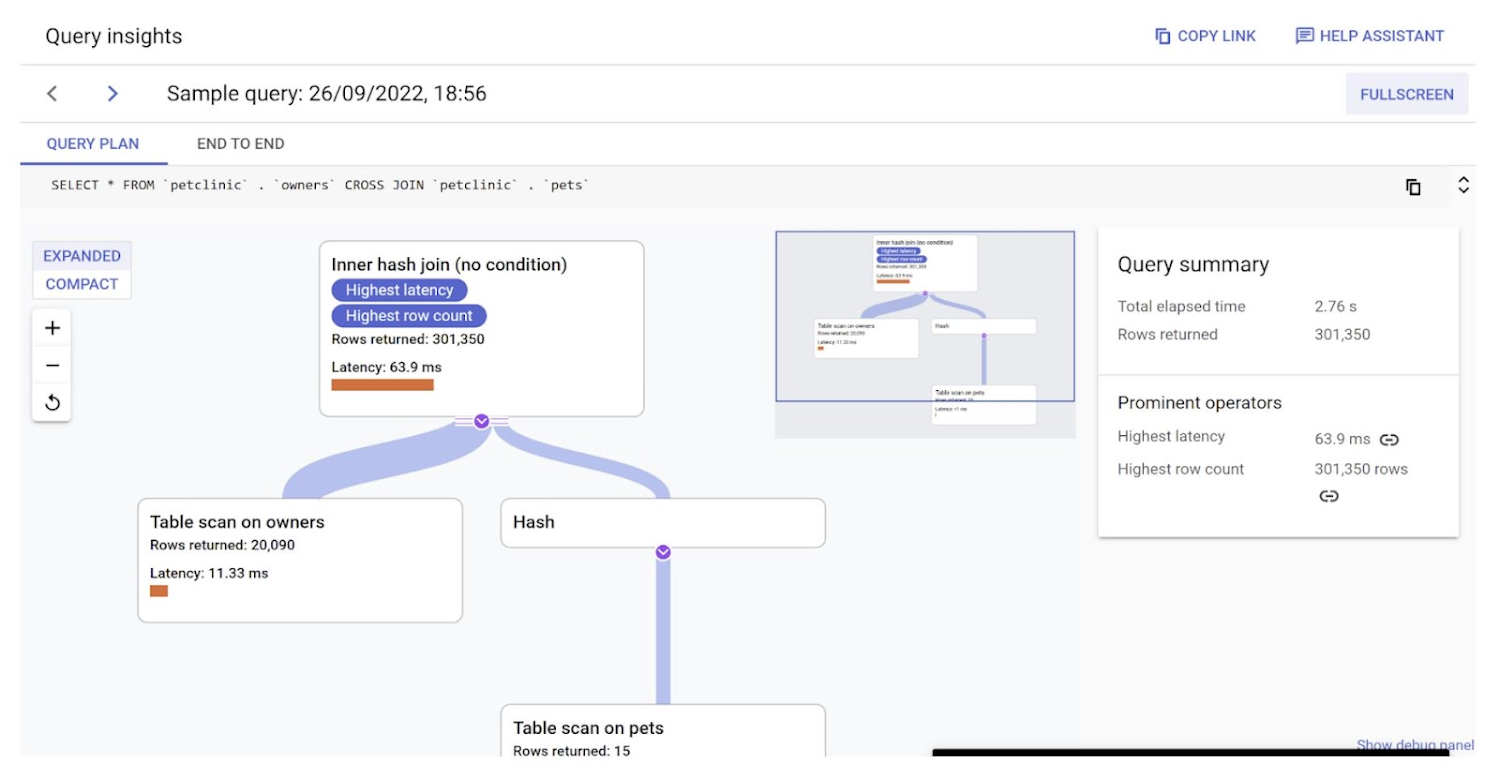
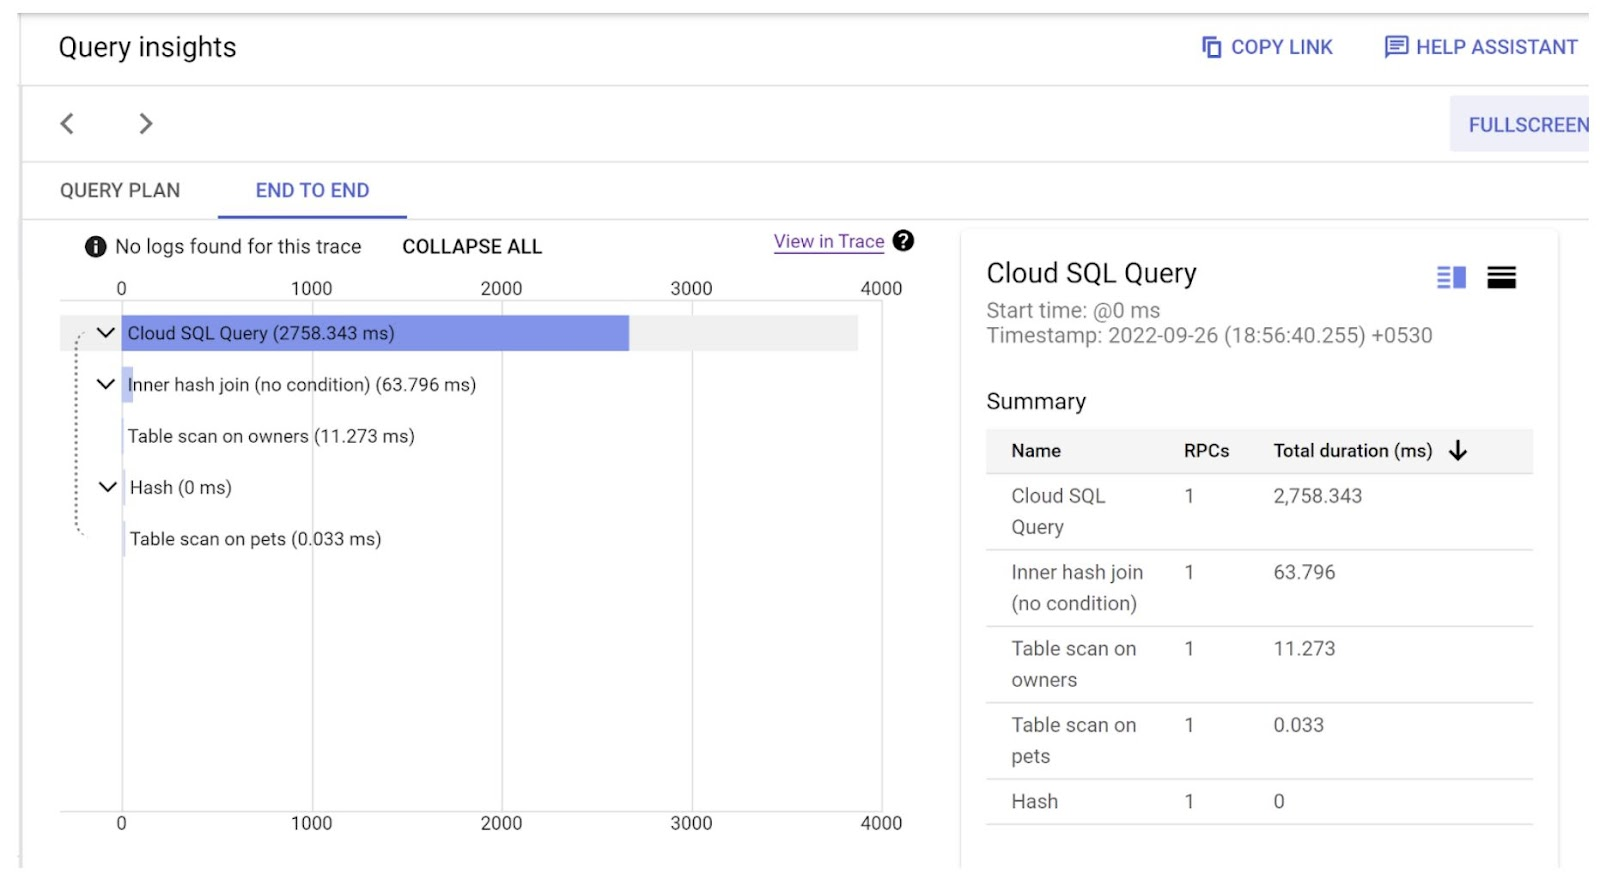
When you find the areas and times where the load was the highest, identify the source of the problem by using tracing to drill down further. To help you identify the specific source of the problem, such as a model, view, controller, route, host, or user, Query insights provides an in-context end-to-end application trace view. This view helps you understand what's going on at the Database Layer for a specific request and to find the source of a problematic query.
Click the End to end tab in the Sample Query screen to look at the in-context trace. For the selected query, we have the below end to end Query Plan Trace:
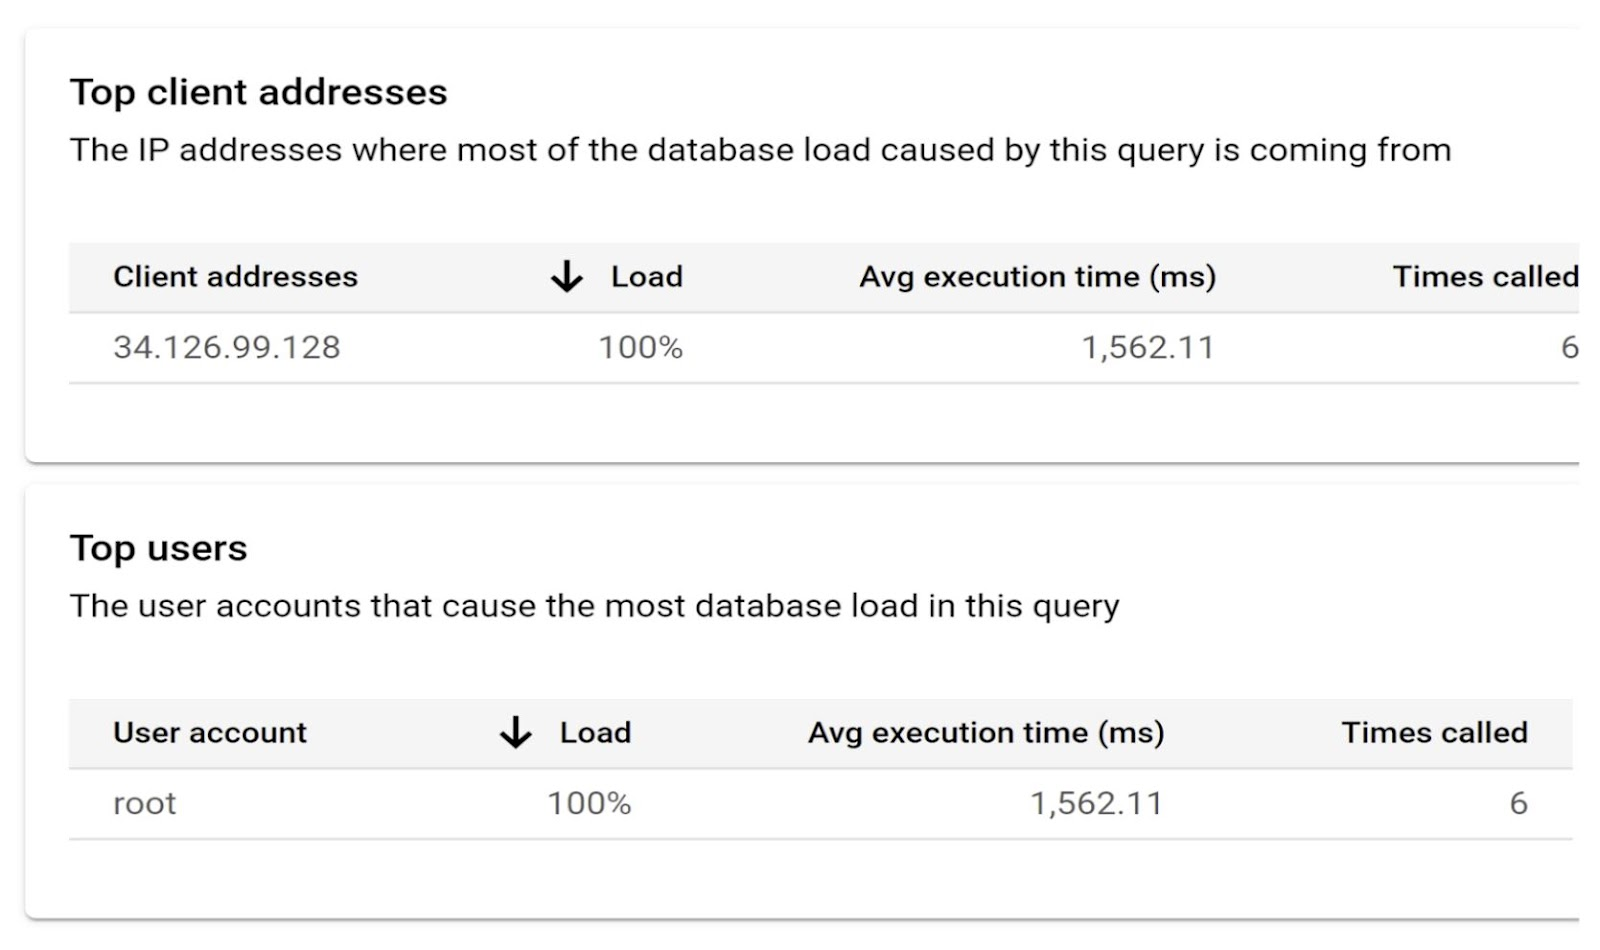
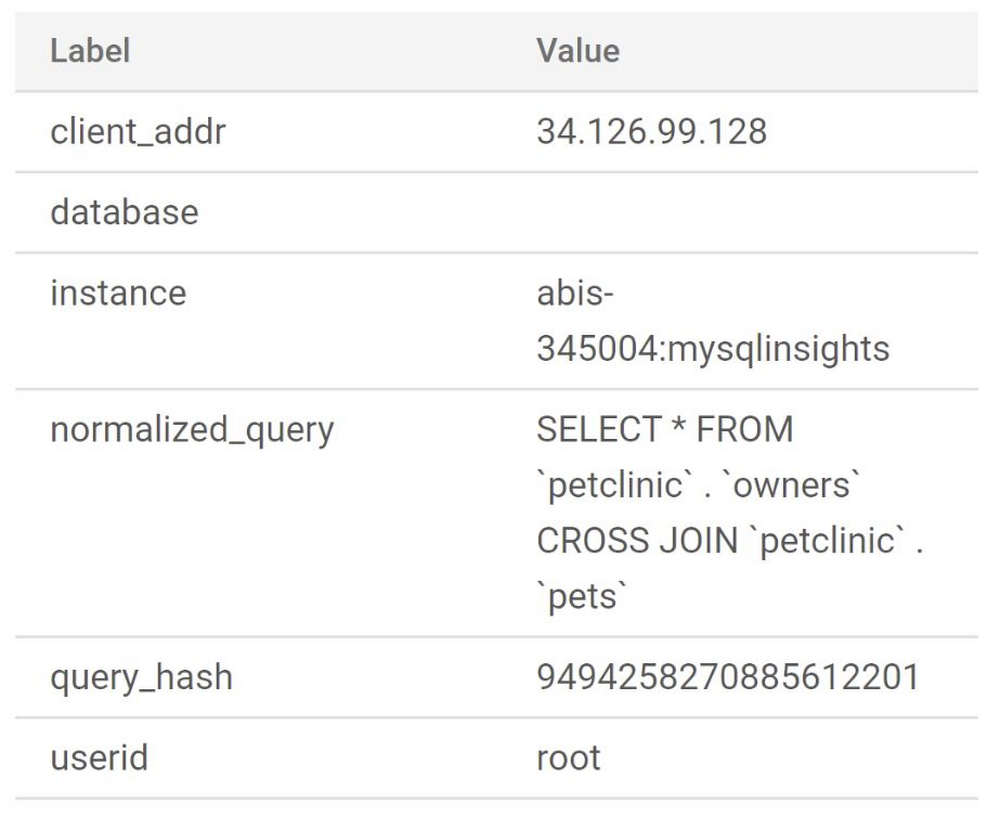
It provides you with information about the client, ip and user causing the load:
To view end to end tracing for each step in the Query Plan, click on the “View in Trace” link to open the Cloud Trace tool. In our example, you can see the latency, HTTP method and URL:
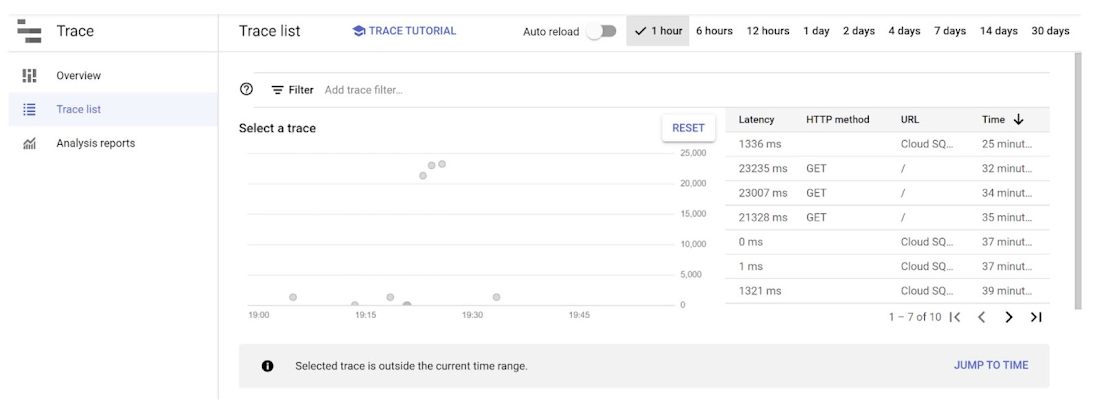
For more details, see Finding and viewing traces.
Conclusion
As you walked through this experiment with me, you would have noticed that identifying the query with the most load and complexity was a breeze with just 4 steps of Cloud SQL Query Insights for MySQL. I was able to identify that the incorrect join in the top query (in step 3 itself) was causing the load. It is further explained in the Query Plan in step 4.
Enabling query insights for Cloud SQL instances is quick and easy, and once enabled, it's always on, giving you access to rolling 7 days of telemetry at no additional cost. Query Insights Metrics are stored in Cloud Monitoring. This has made my life easier to integrate with the rest of my services like Cloud Run, Cloud Functions and other services on Google Cloud in a single-pane-of-glass-view for the full application stack, using the Cloud Monitoring Groups feature.
What’s more? The cool Cloud SQL Query Insights for MySQL is now Generally Available. Grab that drink and find a corner to learn, experiment and transform your application and the lives of your teams using Query Insights to improve query performance for Cloud SQL MySQL.