Canary deployments using Kubernetes Gateway API, Flagger and Google Cloud Deploy
Christoph Grotz
Strategic Cloud Engineer
Accelerate your application releases using Cloud Deploy and the new Gateway API
Canary deployment is an advanced technique used to test changes in a production environment by gradually rolling out the changes to a small subset of users before fully deploying them to the entire user base. This allows for real-world testing of the changes, and the ability to quickly roll back the changes in the event of any issues. Canary deployments are particularly useful for testing changes to critical parts of an application, such as new features or updates to the database schema. By using canary deployments, you can ensure that any new changes do not negatively impact the user experience, and can fix issues before they affect the entire user base.
The new Kubernetes Gateway API gives you a great new tool for managing traffic to applications running on your Google Kubernetes Engine clusters. Together with Google Cloud Deploy you can leverage this new capability to enable faster releases to production for your applications. At the end of this post, you are going to have a Continuous Deployment pipeline that is using an iterative traffic shift pattern to release your application to production, allowing you to do fast zero downtime deployments of your applications.
Flagger is a OSS tool that allows you to do canary releases or A/B testing in a declarative fashion using your K8S cluster. It monitors configurable metrics from your application to determine the health of your release and controls the release process based on those metrics. It supports metrics from various sources like Prometheus or Google Cloud Monitoring. In this post, I’m using Google Managed Prometheus as a metrics source.
Flagger is often used with service meshes like Istio or Anthos Service Mesh, but since recently it also supports the new Kubernetes Gateway API for traffic management, that we are using in this blog post. I updated the implementation of Gateway API in Flagger to support the latest version v1beta1, and decided to put together this blog post.
High Level Design
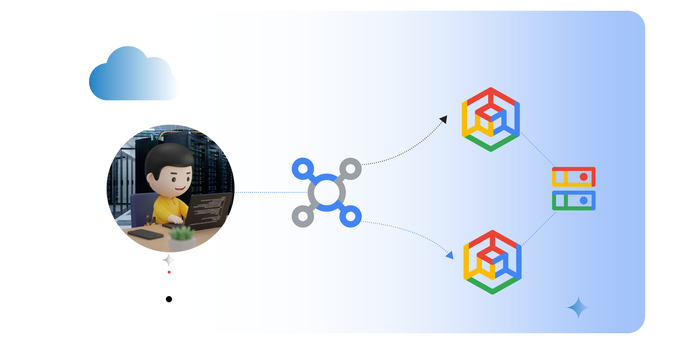
Here is a small architecture diagram of how the components in this blog post connect with each other:
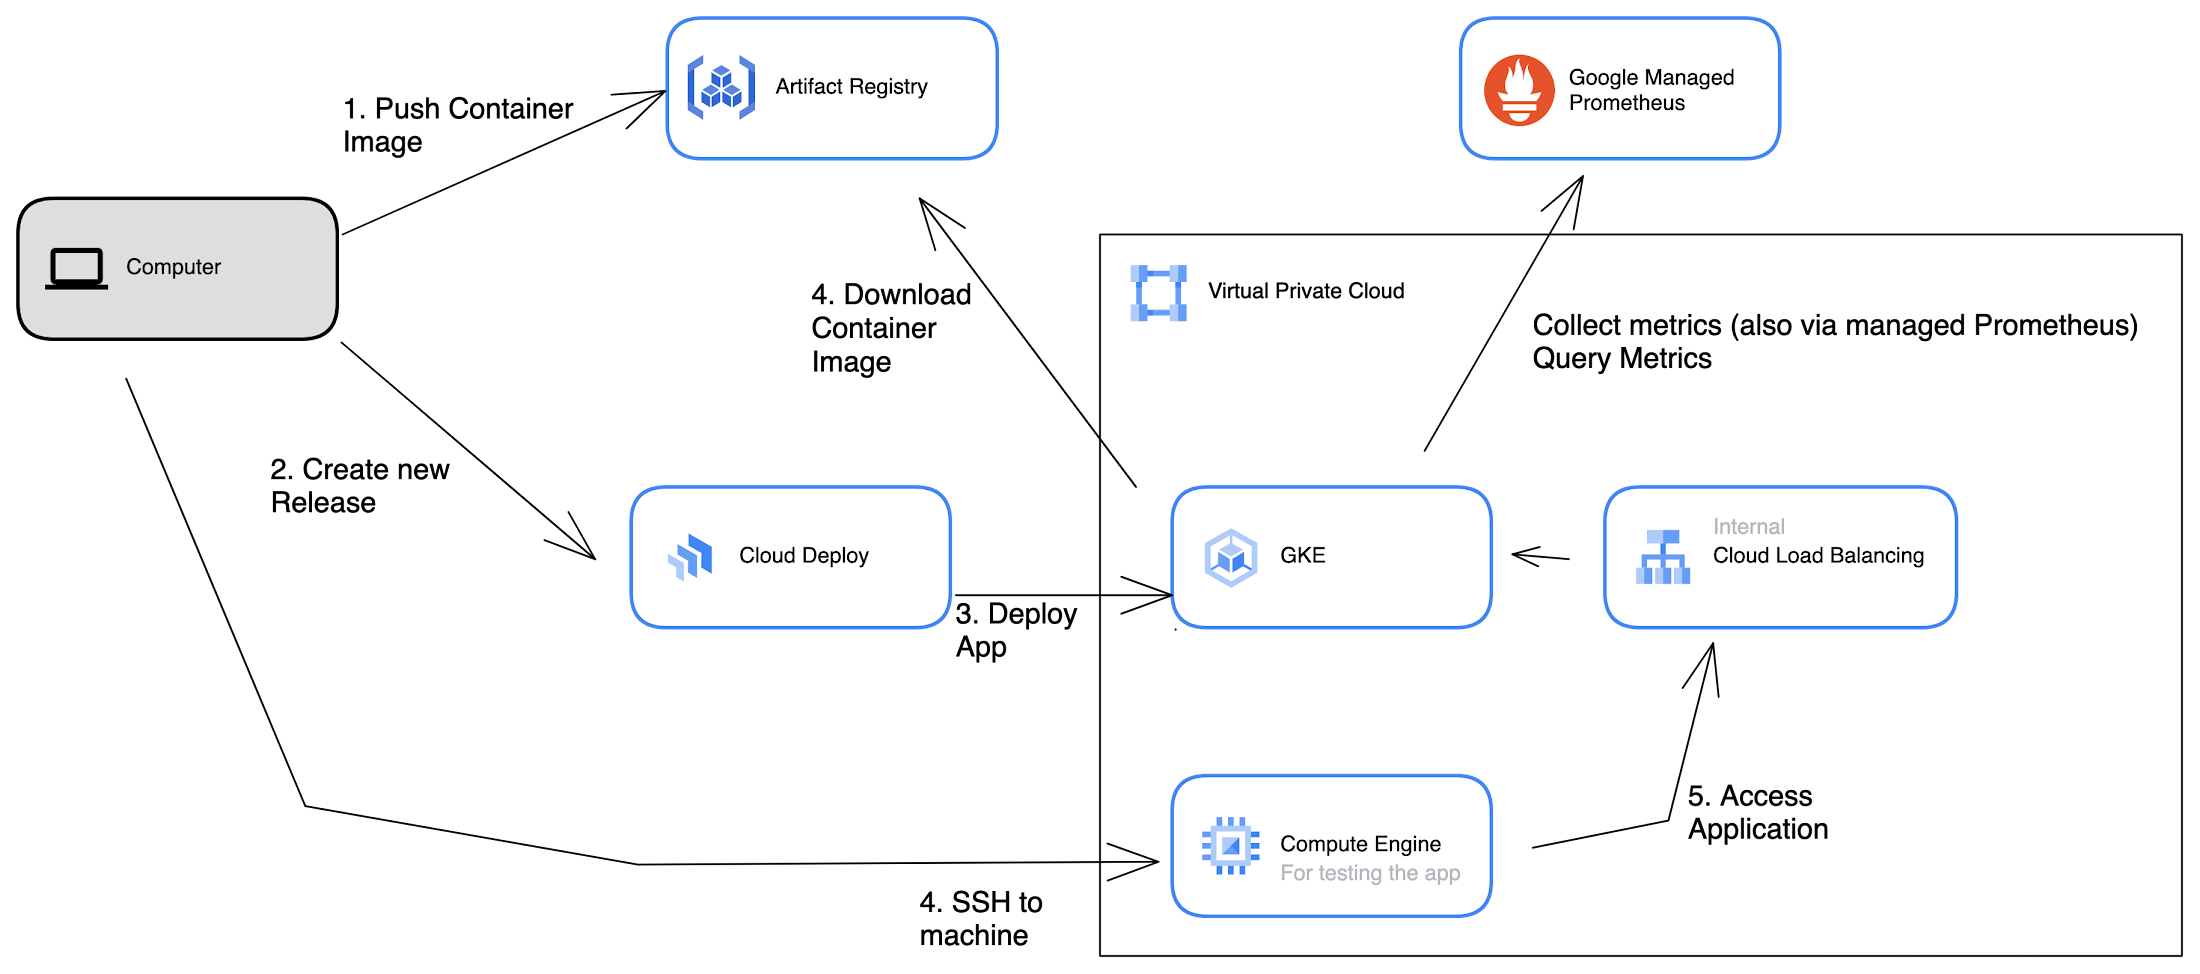
We are going to need several resources in our Google Cloud setup. We are using Artifact Registry to store the container image. Cloud Load Balancing is used for routing traffic to the application. Cloud Deploy is providing us with a managed continuous delivery pipeline that deploys the application to the various environments. Google Managed Prometheus is providing us with observability of the application so that the canary strategy can be data driven.
On the GKE cluster, we are using a 2 namespace setup with a dev namespace for the development environment that is directly deployed from Cloud Deploy and a prod namespace where the K8S deployment is done with a gradual traffic shift using Flagger. For the prod namespace we are also going to deploy a Google-managed Prometheus (GMP) query interface.
Since we are using an internal Cloud Load Balancer, we are going to need a jump host VM on Compute Engine to actually access the application.
Environment setup
Let’s start with setting up our environment. In order to follow this post, you are going to need kubectl, gcloud, jq and skaffold installed on your machine, or you can use Cloud Shell since it has all of them installed. We are also going to set a few variables that will help us in the next steps.
Also we need to enable a few APIs upfront.
In order to set-up Artifact Registry and configure your environment run the following commands.
We are going to need a proxy-only subnet in our VPC for the Load Balancer. If you don’t already have one, create one with the following command. You might need to change up the IP range to a free range in your network. This example uses the default VPC, but feel free to choose whichever VPC you prefer.
We need a GKE cluster with Gateway API, Horizontal Pod Autoscaling and Workload Identity enabled, with a newer GKE version higher or equal to 1.24, so let’s create that one next:
After the creation is complete, we connect our local machine to the cluster:
Lastly, we are going to need an example app. I created a small example app in Golang that you can check out.
Now everything is ready.
Deploy Google Managed Prometheus (GMP) Query Interface in the cluster
Flagger is using telemetry data to get the status of the deployment. The example Golang application we are deploying for this demo provides Prometheus metrics. We already enabled managed collection on the cluster, so the metrics from the app should be available in Cloud Monitoring already. For this demo, we use a GMP query interface inside the cluster so that Flagger can check the deployment health. Flagger can also query Google Cloud Operations directly but we found it easier to calculate success rates with PromQL.
Install Flagger in the Kubernetes cluster
In order to start with canary deployments, we need to install Flagger with Gateway API enabled in our cluster. You can simply do that by running:
It will install the flagger components and CRDs into the flagger-system namespace.
Bootstrap the environment
Next we will bootstrap the environment with:
- a K8S gateway for dev and prod (Using an Internal L7 LB)
- a Metric Template for querying the Success Rate (we are going to take a look at this later)
- and a Canary Release object for Flagger (will be explained further down as well)
We need to fetch the IP address of the gateway for DNS setup (it might take a few minutes for it to show up):
If you like you can now go ahead and try to deploy directly from Skaffold:
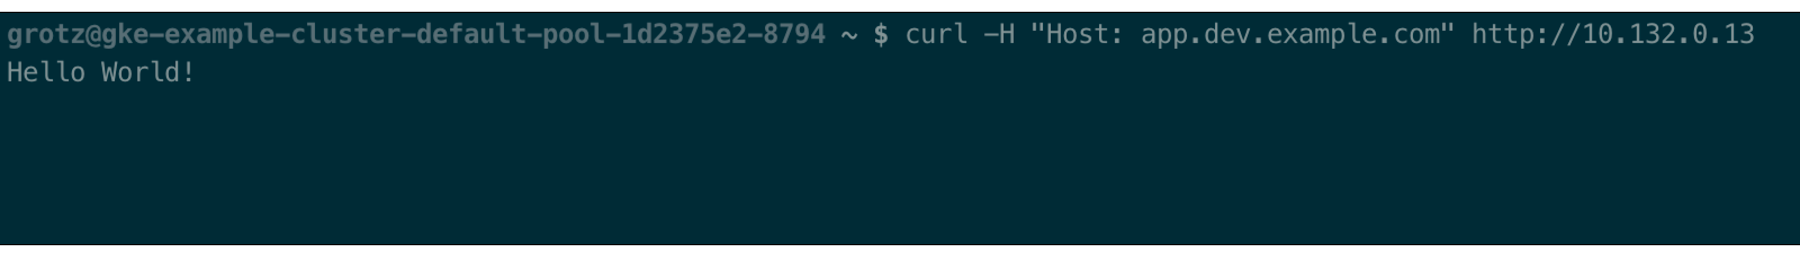
You can now call the service from a VM inside the same VPC:
The response should show “Hello World!”. It might take a couple of seconds for the state to reconcile and the backend to become healthy:
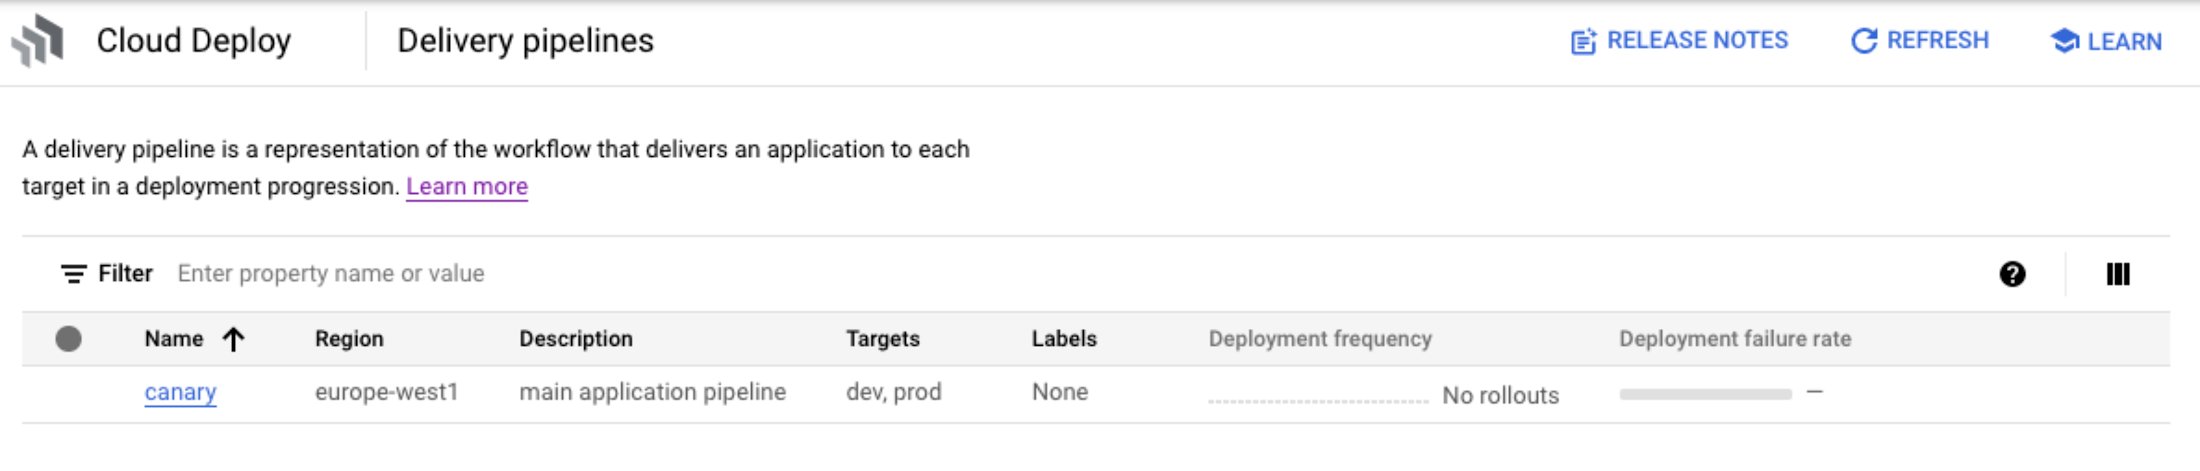
Create a Cloud Deploy Pipeline
First, set permissions for Cloud Deploy and apply the pipeline. This example uses a simplified IAM configuration using the default compute service account to reduce complexity. To improve security you should use a custom service account when you set this up for production usage.
Next, create a new release for deployment to prod with Cloud Deploy:
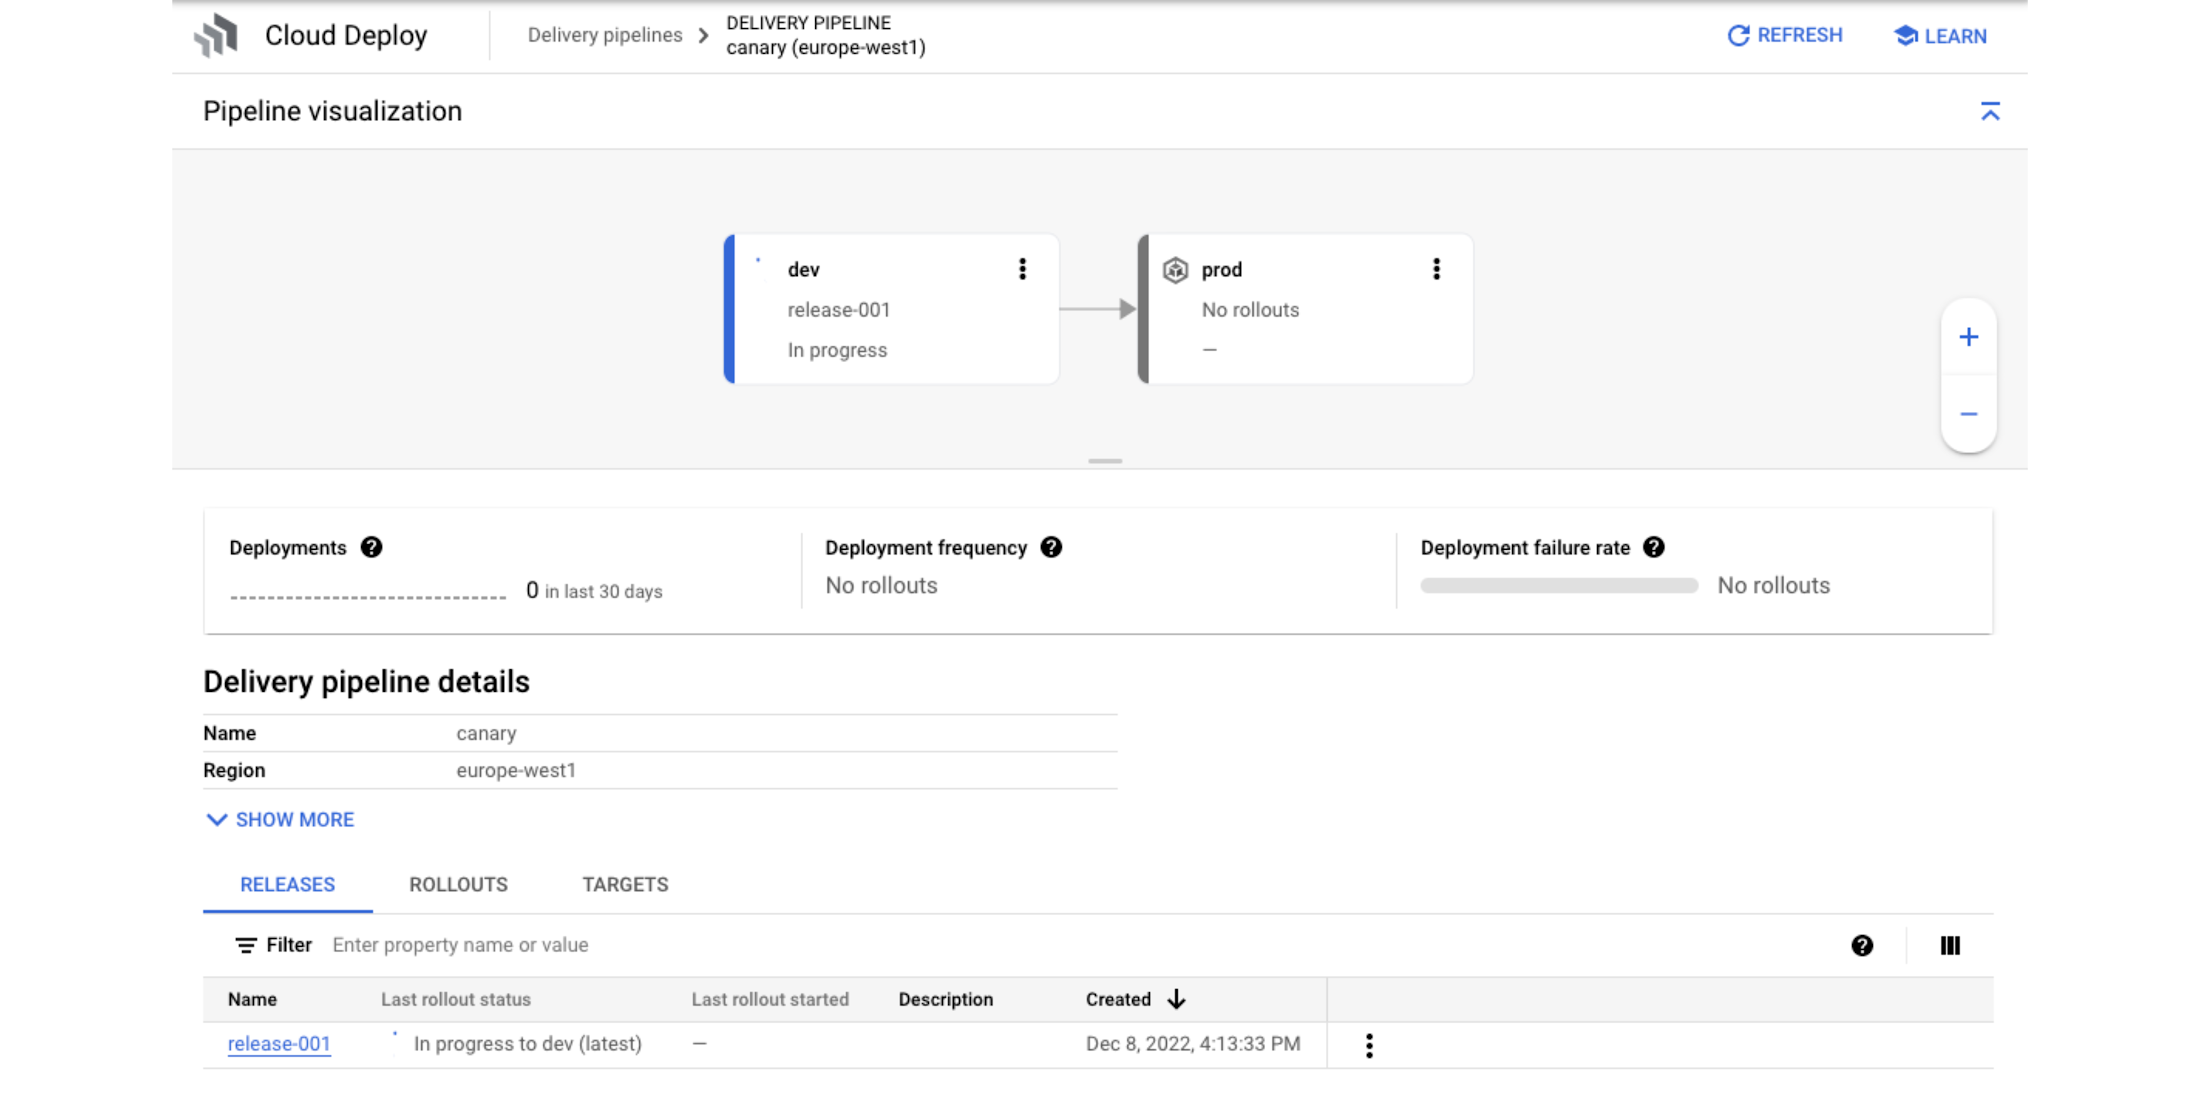
Next, we promote the release to prod, this step can also take some time to complete:
Let’s fetch the IP for the prod gateway:
And curl the prod gateway from a VM inside the clusters VPC:
Once the deployment is finished you should see “Hello World!” again. Since there wasn’t a version of the prod deployment already running, it “skipped” the canary step.
Canary Deployment
So let’s try the canary functionality. Let’s make a small change in the “app/main.go” file. For example, let’s add your name to the output string in line 27 and then deploy the new version directly to prod skipping the dev stage (which you shouldn’t do in a real production scenario of course).
You can observe the canary process using:
Now when you curl the prod gateway again, you should be able to see a mixture of messages, with the ratio shifting on how far the release has already progressed.
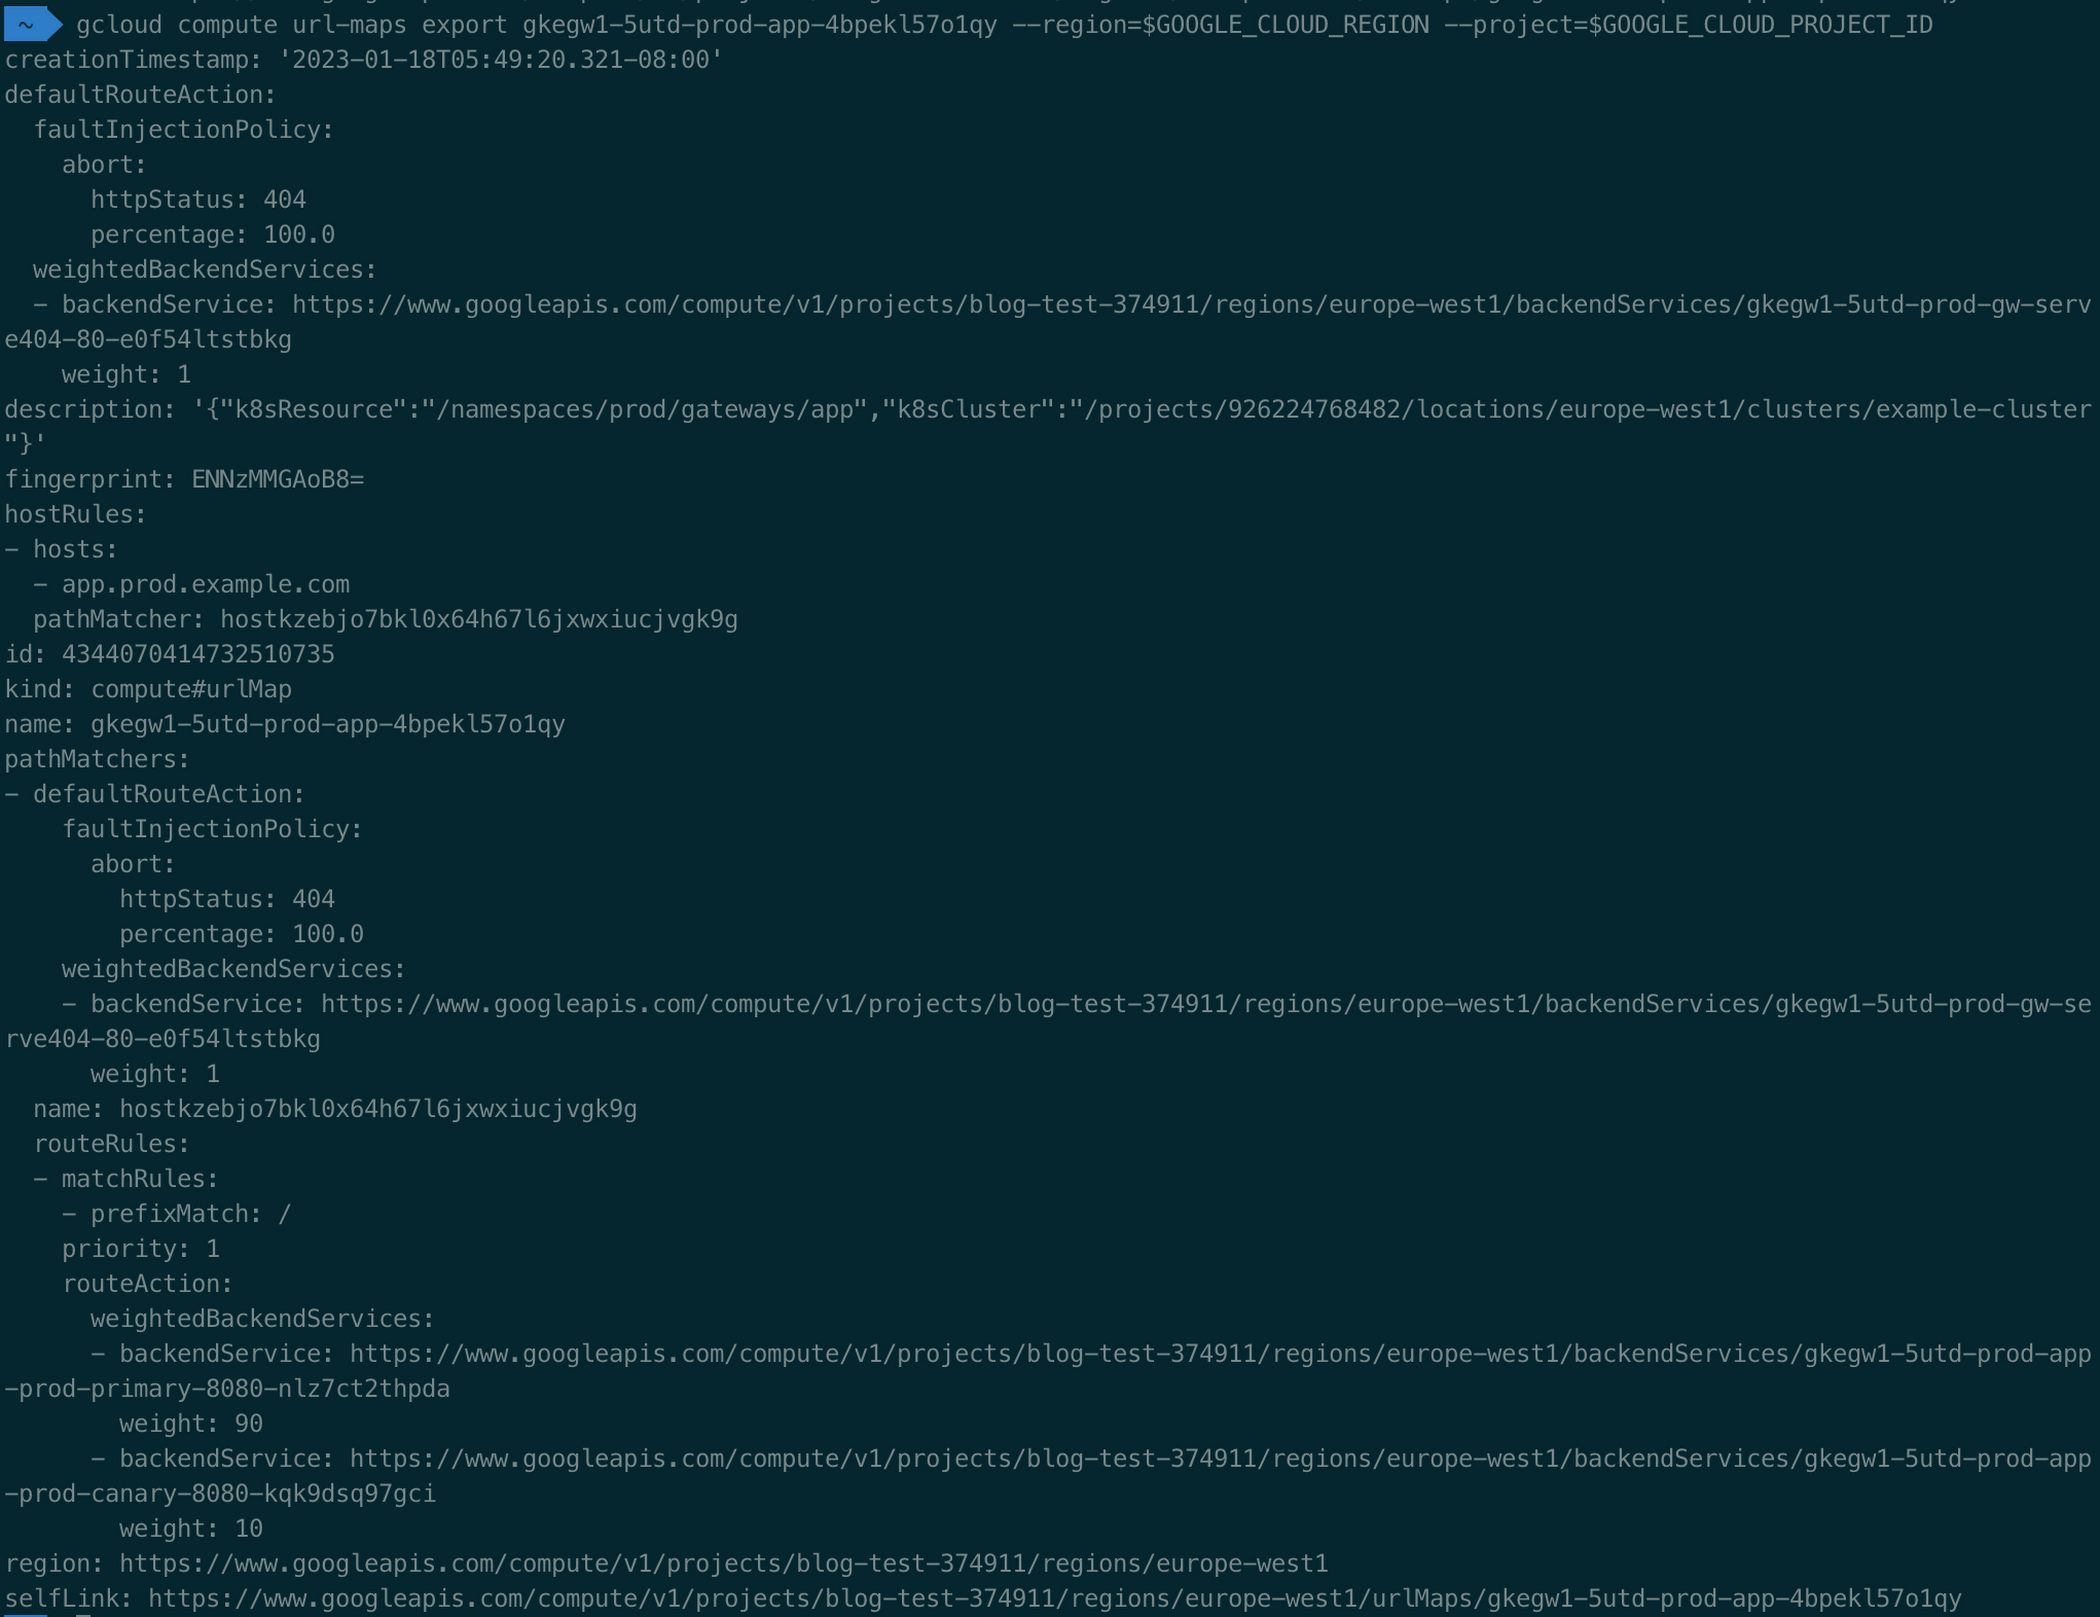
You can also check the traffic split directly on the GCLB Url Map:
The result should look something like this:
The application also contains a failed endpoint that will cause a 500 - Internal Server Error response. How about you make another small change to the app/main.go to trigger a new deployment and observe how Flagger will stop the rollout of the new version due to lower request success rate?
How it works
Inside the bootstrap.yaml, we defined a simple PromQL query for the success rate of the app; requests without a 200 status code are taken as failed. In the Flagger canary object we define a target success rate of 60%
We also defined a Flagger Canary object where this success rate query is referenced. The canary object observes new app deployments, and intercepts the routing configuration to gradually shift the traffic to the new version instead of shift the whole traffic all at once:
So that’s it, now you have a nice little canary Continuous Delivery pipeline up and running on Google Cloud with the new Gateway API and Google Cloud Deploy.
Next Steps
If you would like to learn more about CI/CD on Google Cloud I would recommend the following articles:
- Building a secure CI/CD pipeline using Google Cloud built-in services contains a great end-to-end example for CI/CD on Google Cloud
- Introducing Software Delivery Shield for end-to-end software supply chain security shows how Google helps you protect your software delivery
- The evolution of Kubernetes networking with the GKE Gateway controller gives an overview of GKE Gateway API and its capabilities.