What’s happening in your SAP systems? Find out with Pacemaker Alerts - Part 2
Tsvetomir Tsvetanov
Technical Solution Engineer Manager
When critical services fail, businesses risk losing revenue, productivity, and trust. That’s why Google Cloud customers running SAP applications choose to deploy high availability (HA) systems on Google Cloud.
In these deployments Linux operating system clustering provides application and guest awareness for the application state and automates recovery actions in case of failure — including cluster node, resource or node failover or failed action.
Pacemaker is the most popular software Linux administrators use to manage their HA clusters, which includes automating notifications about events — including failover fencing and node, attribute, and resource events — and reporting on events. With automated alerts and reports, Linux administrators can not only learn about events as they happen, but they can also make sure other stakeholders are alerted to take action when critical events occur. They can even discover past events to assess the overall health of their HA systems.
Here, we break down the steps to setting up automated alerts for HA cluster events and alert reporting.
How to Deploy the Alert Script
To set up event-based alerts, you’ll need to take the following steps to execute the script.
1. Download the script file ‘gcp_crm_alert.sh’ from https://github.com/GoogleCloudPlatform/pacemaker-alerts-cloud-logging
2. Under root user, add exec flag for the script and execute deployment with:
3. Confirm that the deployment runs successfully. If it does, you will see the following INFO log messages:
- In the Red Hat Enterprise Linux (RHEL) system:
- In the SUSE Linux Enterprise Server (SLES):
Now, in the event of a cluster node, resource, node failover, or failed action, Pacemaker will start the alert mechanism. For further details on the alerting agent, check out the Pacemaker Explained documentation.
How to Use Cloud Logging for Alert Reporting
Alerted events are published in Cloud Logging. Below is an example of the log record payload, where the cluster alert key-value pairs get recorded in the jsonPayload node.
To get notified of a resource event — for example, when the HANA topology resource monitor fails — you can use the following filter for the alerting definition:
To define an alert for a fencing event, your can apply this filter:
The fencing log entry gets recorded with warning severity to give you deeper insight, and this additional information is also helpful for more specific filtering criteria:
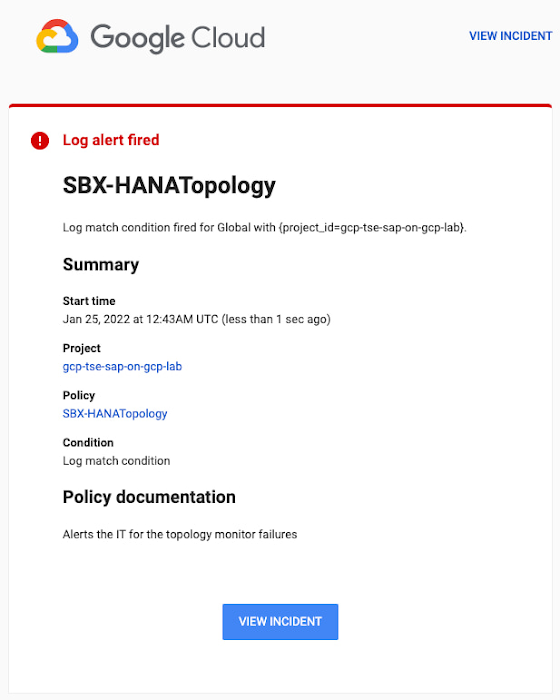
Alerts can be delivered through multiple channels, including text and email. Below is an example of an email notification for our earlier example, when we defined an alert for a HANA topology resource monitor failure:


You can write and apply filters to your log-based alerts to isolate certain types of incidents and analyze events over time. For example, the following script will surface a resource event occurring within a two-hour window on a specific date:
With the ability to analyze these logged alerts over time, determine whether event patterns warrant any action.
[SIDEBAR]
The alert script prints details in the standard output and in the log file /var/log/crm_alerts_log, and this can grow over time. We recommend that the log file is set with the Linux logrotate service in order to limit the file system space. Use the following command to create the necessary logrotate setting for the alerting log file:
[END SIDEBAR]
Tips for Troubleshooting
When you first deploy your alert script, how can you tell for certain that you’ve done it correctly? Use the following commands to test it out:
In RHEL:
pcs alert show
In SLES:
sudo crm config show | grep -A3 gcp_cluster_alert
You should see the following if the script is correct:
In RHEL:
In SLES:
If the commands do not display the alerts properly, re-deploy the script.
In case there is an issue with the script, or if the Cloud Logging records are not presenting as expected, examine the script log file /var/log/crm_alerts_log. The errors and warning can be filtered with:
egrep '(ERROR|WARN)' /var/log/crm_alerts_log
Any Pacemaker alert failures will be recorded in the messages and/or Pacemaker log. To examine recent alert failures, use the following command:
egrep '(gcp_crm_alert.sh|gcp_cluster_alert)' \ /var/log/messages /var/log/pacemaker.log
Keep in mind, though, that the Pacemaker log location may be different in your system from the one in the example above.
From reactive to proactive
Your SAP applications are too critical to risk outages. The most effective way to manage high availability clusters for your SAP systems on Google Cloud is to take full advantage of Pacemaker’s alerting capabilities, so you can be proactive in ensuring your systems are healthy and available.
Learn more about running SAP on Google Cloud in our public documentation. If you are interested in learning more about running SAP on Google Cloud with Pacemaker, read the other blogs in this series here:


