Troubleshooting services on Google Kubernetes Engine by example
Yuri Grinshteyn
Site Reliability Engineer, CRE
Applications fail. Containers crash. It’s a fact of life that SRE and DevOps teams know all too well. To help navigate life’s hiccups, we’ve previously shared how to debug applications running on Google Kubernetes Engine (GKE). We’ve also updated the GKE dashboard with new easier-to-use troubleshooting flows. Today, we go one step further and show you how you can use these flows to quickly find and resolve issues in your applications and infrastructure.
In this blog, we'll walk through deploying a sample app to your cluster and configuring an alerting policy that will notify you if there are any container restarts observed. From there, we'll trigger the alert and explore how the new GKE dashboard makes it easy to identify the issue and determine exactly what's going on with your workload or infrastructure that may be causing it.
Setting up
Deploy the app
This example uses a demo app that exposes two endpoints: an endpoint at /, which is just a "hello world", and a /crashme endpoint, which uses Go's os.Exit(1) to terminate the process. To deploy the app in your own cluster, create a container image using Cloud Build and deploy it to GKE. Then, expose the service with a load balancer.
Once the service is deployed, check the running pods:
Notice that RESTARTS is initially at zero for each pod. Use a browser or a command line tool like curl to access the /crashme endpoint. At this point, you should see a restart:
Each request to that endpoint will result in a restart. However, be careful to not do this more often than every 30 seconds or so, otherwise, the containers will go into CrashLoopBackOff, and it will take time for the service to be available again. You can use this simple shell script to trigger restarts when as needed:
where $IP_ADDRESS is the IP address of the load balancer you've already created.
Why do container restarts matter? Well, restarts, to a certain degree, are an expected part of a container’s typical lifecycle in Kubernetes. Too many container restarts, however, could affect the availability of your service, especially when expanded over a larger number of replicas for a given Pod. Not only do excessive restarts degrade the service in question, but they also risks affecting other services downstream that use it as a dependency.
In real life,the culprit for a large number of restarts could be a poorly designed liveness probe, issues like deadlocks in the application itself, or misconfigured memory requests that result in OOMkilled errors. So, it is important for you to proactively alert on container restarts to preempt potential degradation that can cascade across multiple services.
Configure the alert
Now, you're ready to configure the alert that will notify you when restarts are detected. Here's how to set up your alerting policy:
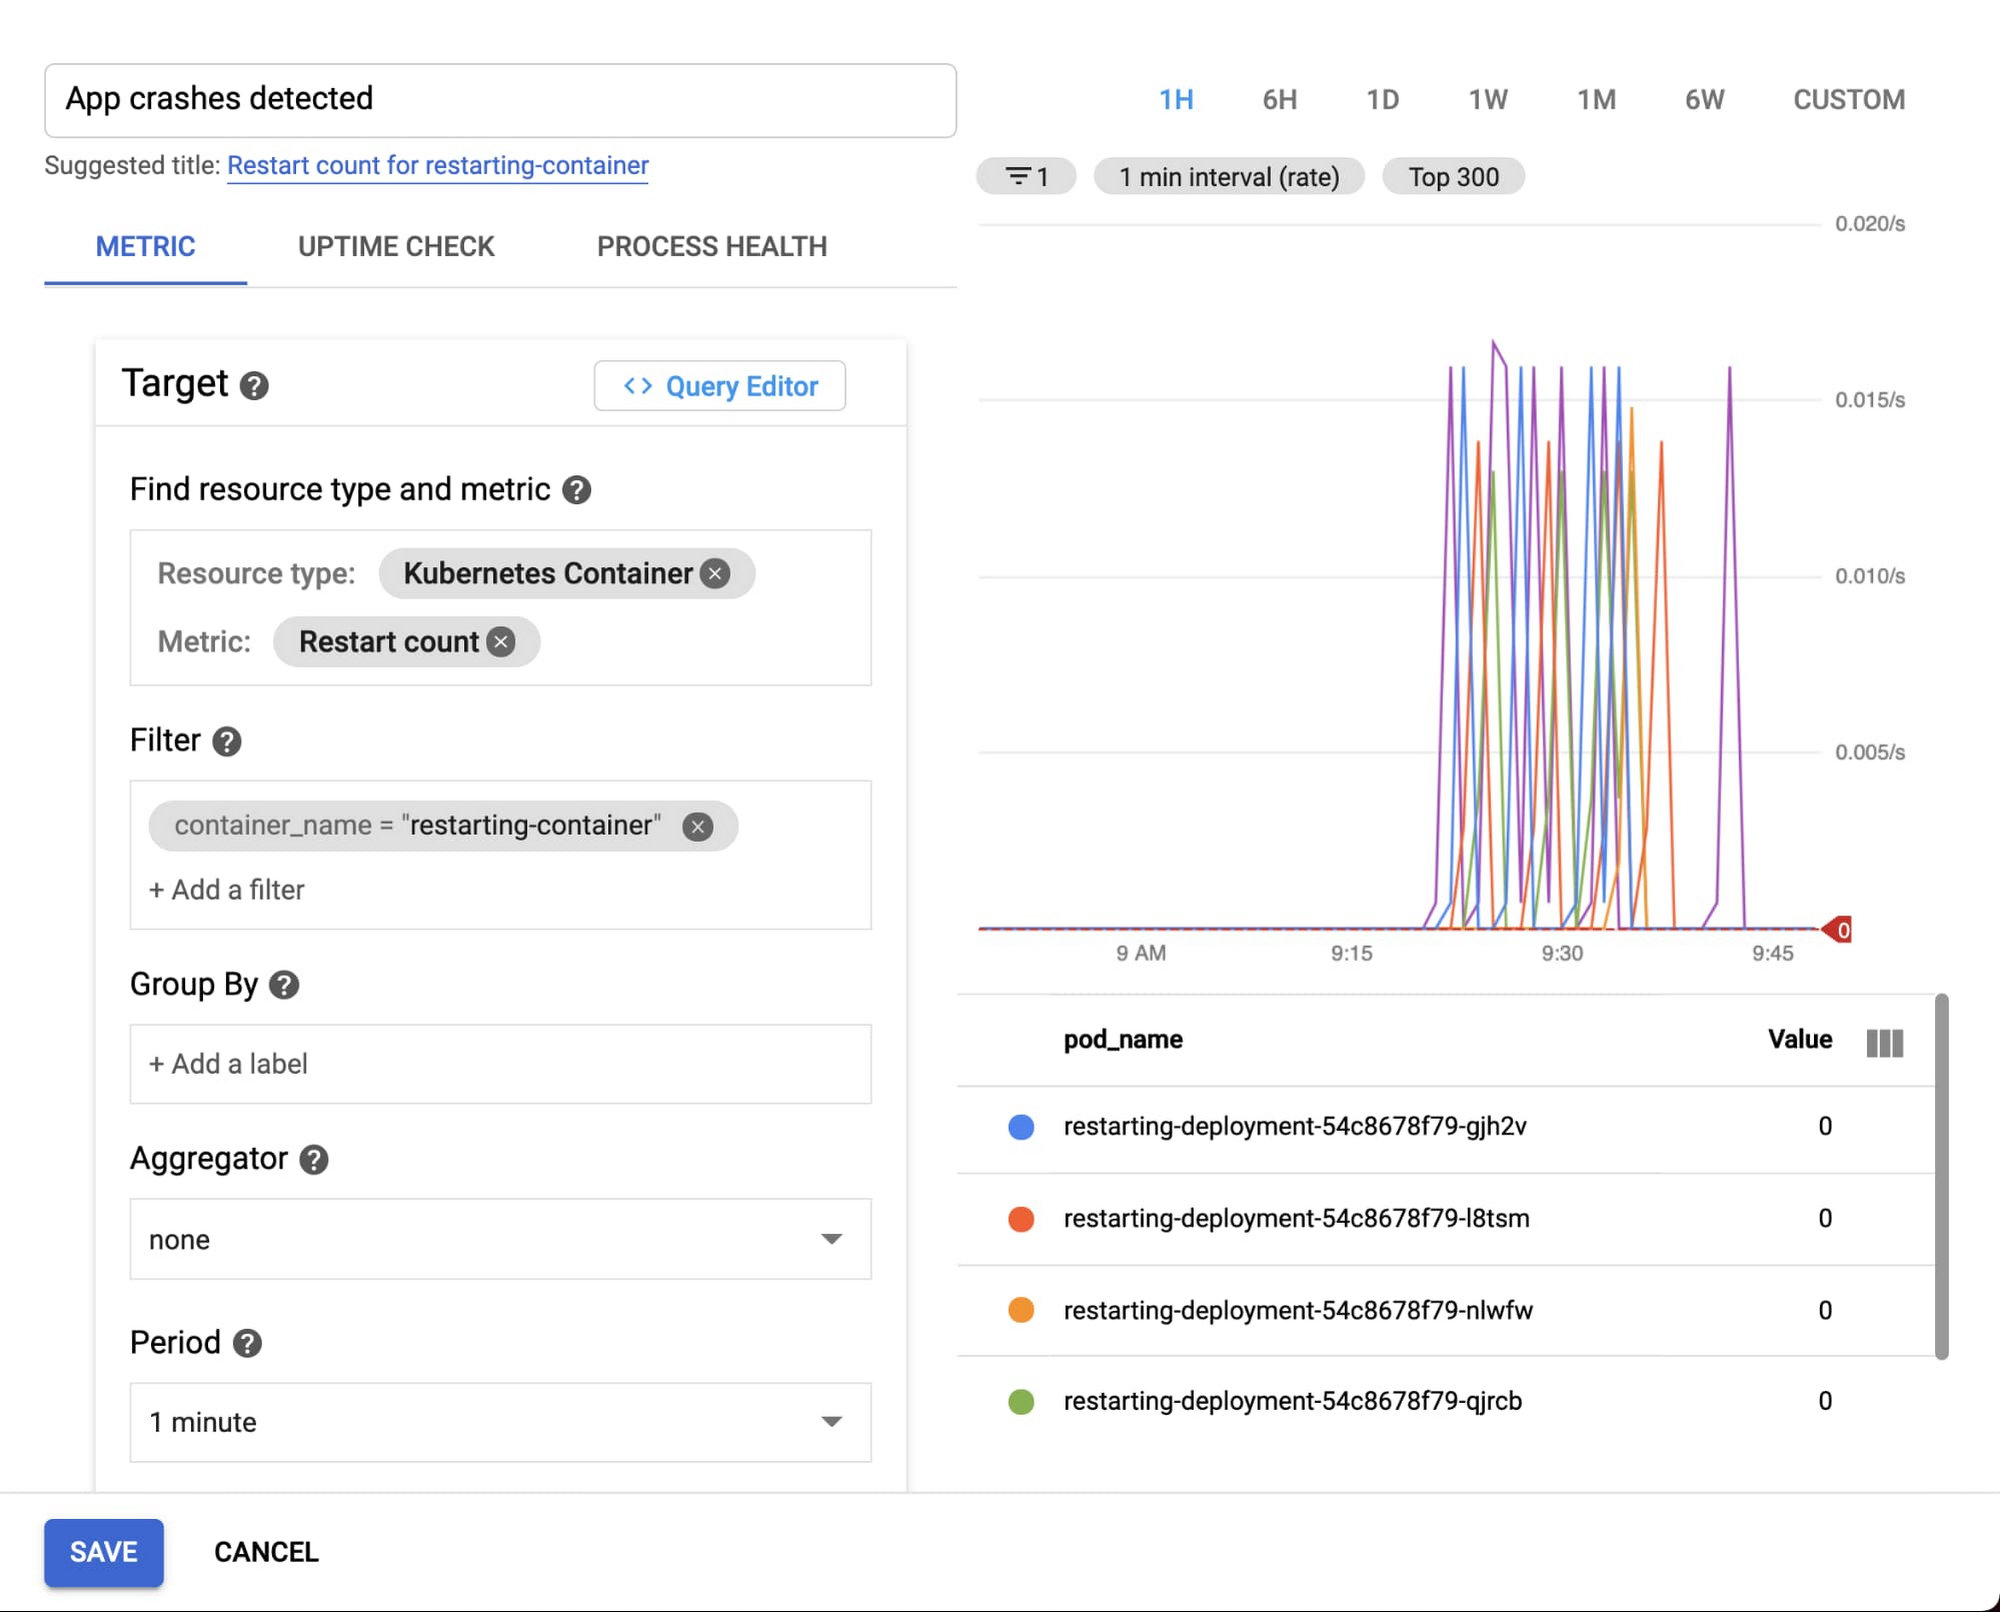
You can use the kubernetes.io/container/restart_count metric, filtered to the specific container name (as specified in the deployment yaml file). Configure the alert to trigger if any timeseries exceeded zero—meaning if any container restarts are observed.
With the setup done, you are ready to test and see what happens!
Testing the alert
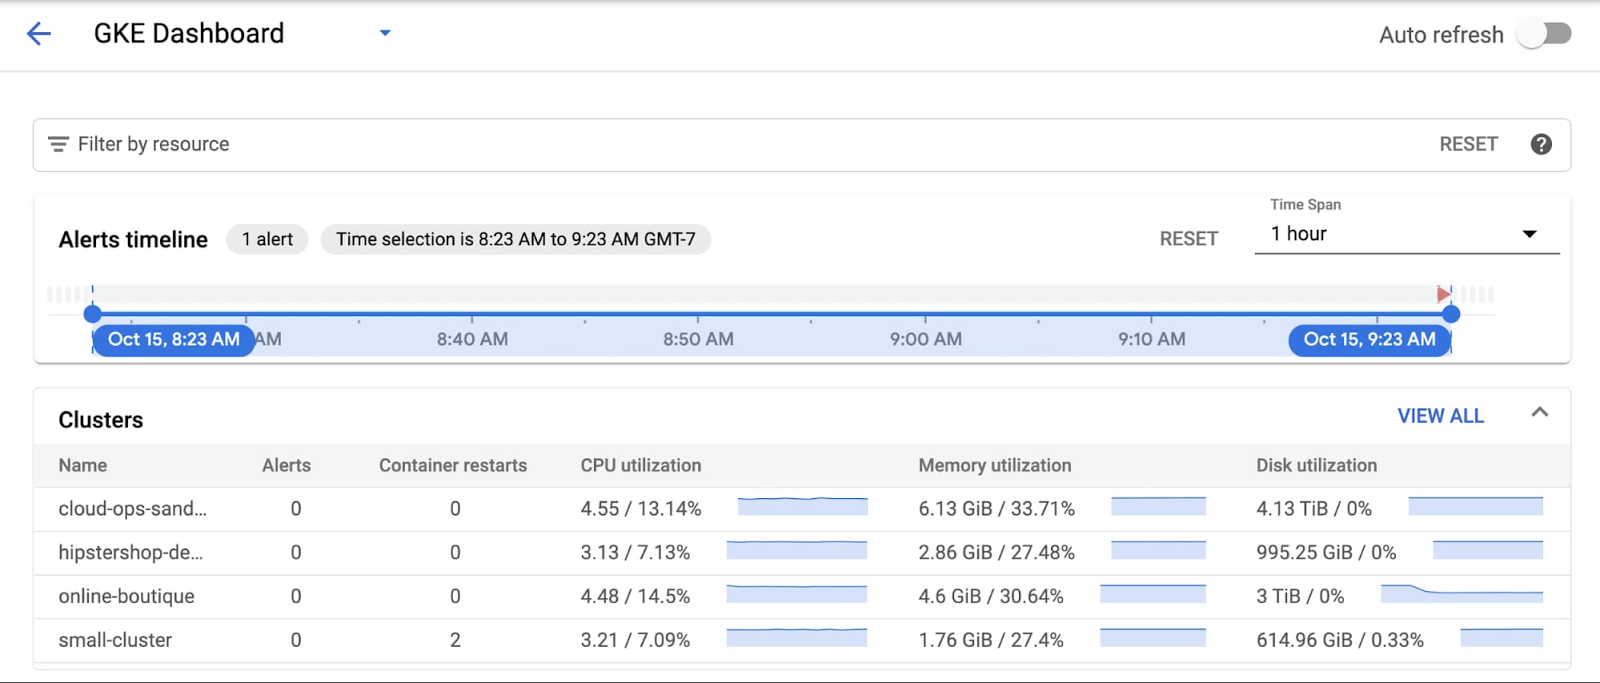
When you’re ready, start the looped script to hit the /crashme endpoint every 45 seconds. The restart_count metric is sampled every 60 seconds, so it shouldn't take very long for an alert to show up on the dashboard:
You can mouse-over the incident to get more information about it:
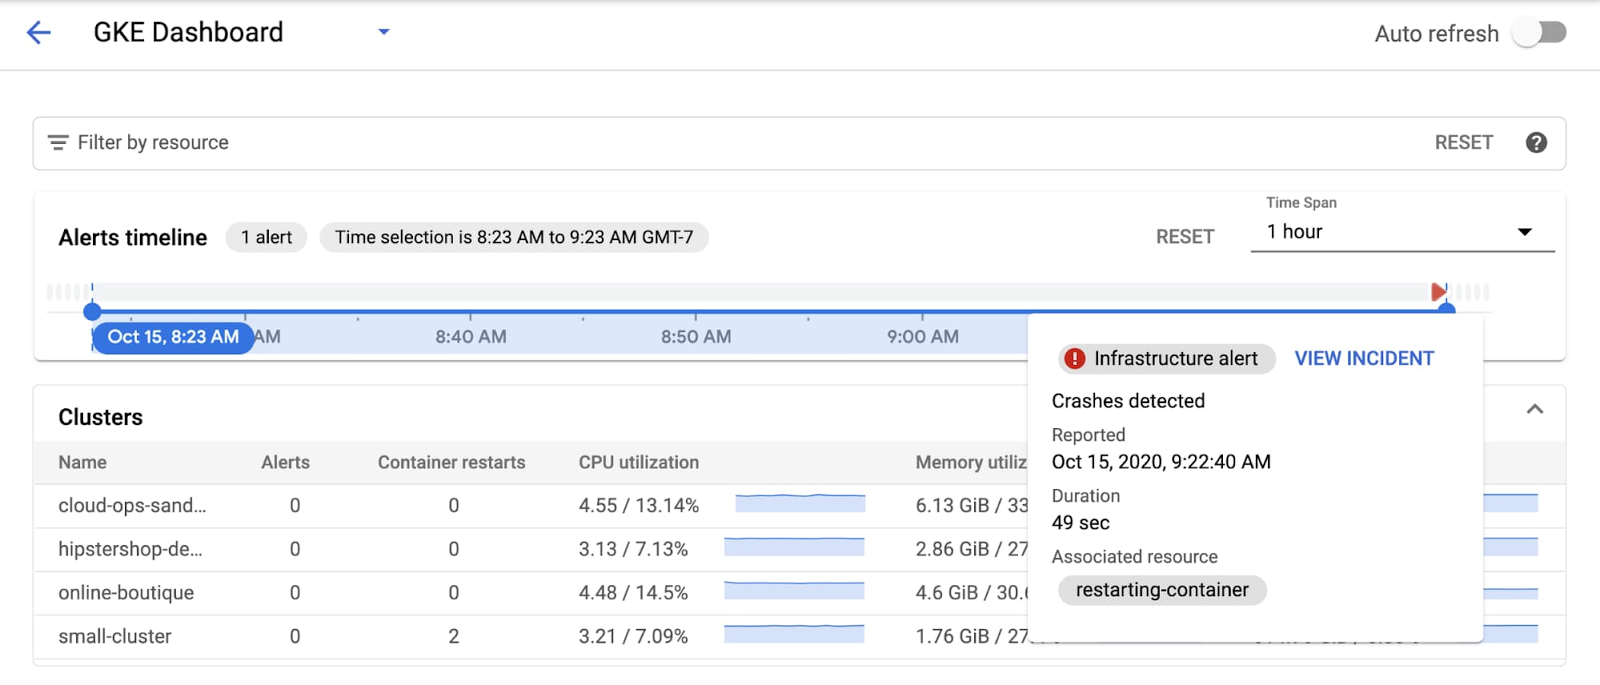
Then click on "View Incident". This takes you to the Incident details screen, where you can see the specific resources that triggered it—in this case, the incident is generated by the container.
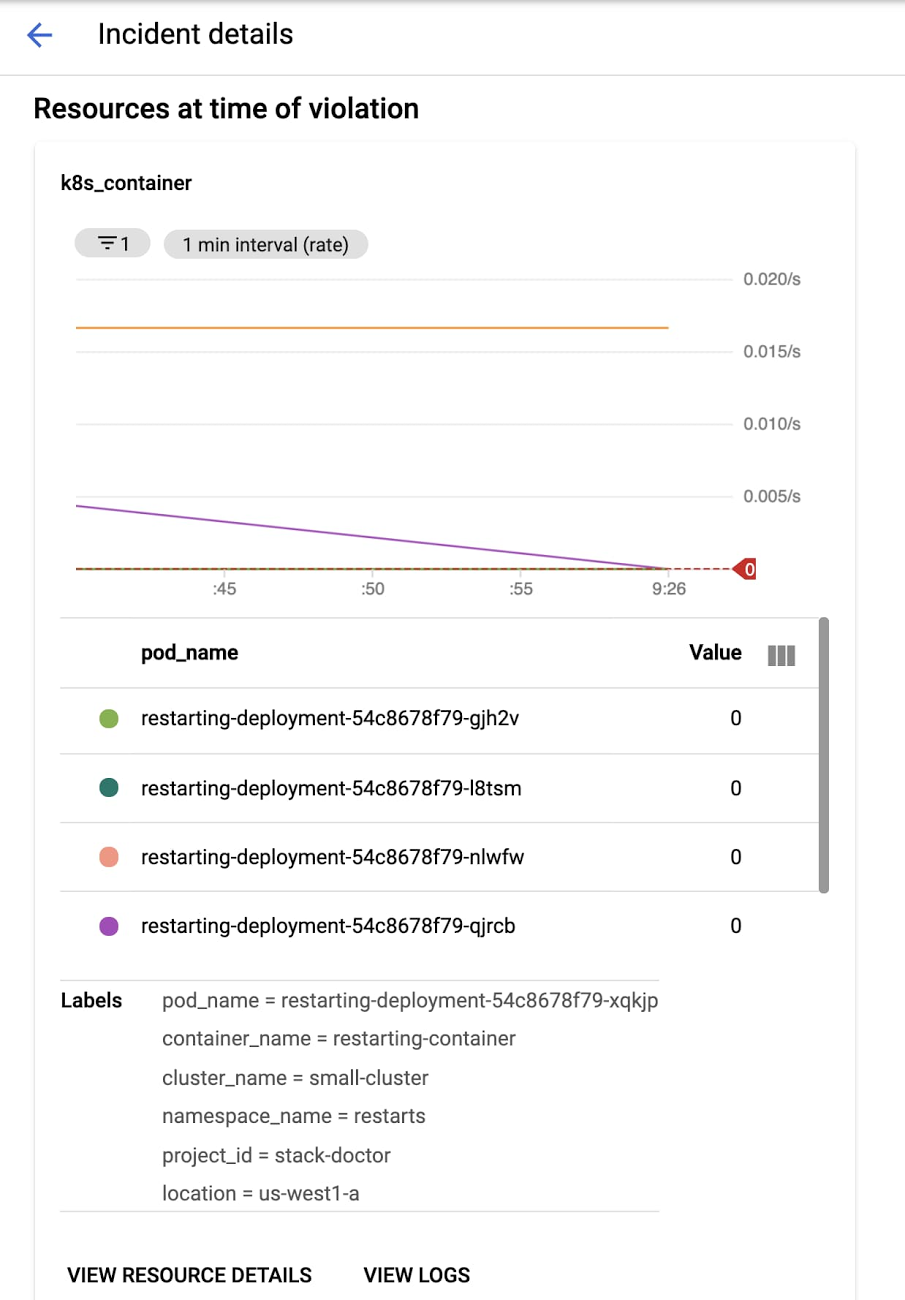
Next, you can click on View Logs to see the logs (in the new Logs Viewer!)—it's immediately apparently that the alert is triggered by the containers restarting:
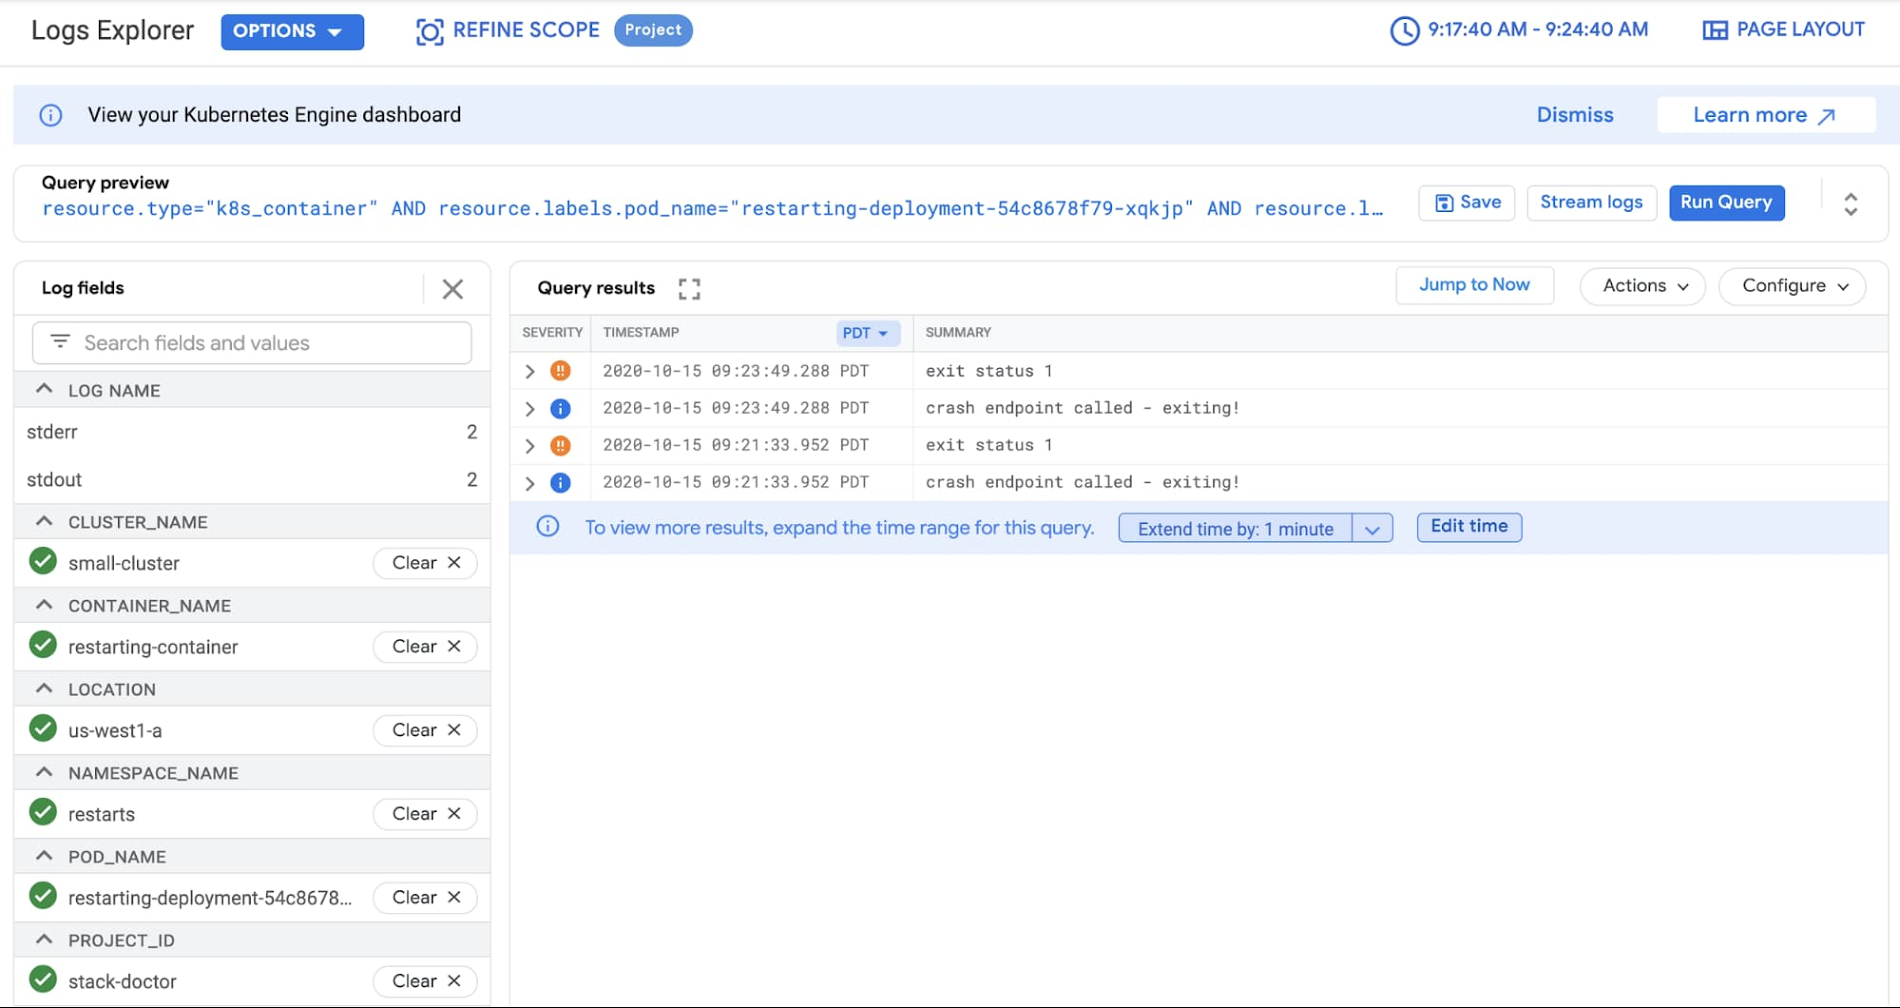
This is all very nicely tied together and makes troubleshooting during an incident much easier!
In summary….
The latest GKE dashboard includes many improvements over previous iterations. The new alerts timeline is intuitive, and incidents are clearly marked so that you can interact with them to get the full details of exactly what happened, all the way down to the container logs that tell you the actual problem.
As an oncall SRE or DevOps engineer for a service running on GKE, the GKE dashboard makes it easier for you to respond to incidents. You're now able to go from an incident all the way to debug logs quickly and easily and reduce the time it takes to triage and mitigate incidents. For a short overview on how to troubleshoot services on GKE, check out this video:
A special thanks to Anthony Bushong, Specialist Customer Engineer, for his contributions to this blog post.