Network security threat detection - Comparison of analytics methods
Gregory M. Lebovitz
Product Management, Network Security Portfolio, Google Cloud
Try Google Cloud
Start building on Google Cloud with $300 in free credits and 20+ always free products.
Free trialJaliesha is responsible for cybersecurity within the DevOps team at her cloud-native software service company – they call it DevSecOps. She has several requirements pressing down on her as their offering explodes in popularity and they take in their second round of VC funding:
Meet compliance requirements for Intrusion Detection System and Intrusion Prevention System (IDS / IPS) on the PCI DSS in-scope infrastructure, and produce artifacts for their upcoming SOC2 audit;
Continuously advance toward their goal to fulfill 90% of the Cloud Controls Matrix on their Cloud Security Alliance CAIQ;
Collaborate with the Network Operations Center (NOC) team to leverage their gathered telemetry for network performance monitoring (NPM) to achieve some of her security monitoring goals;
Retain twelve months of network metadata as may be required for threat hunting or legal evidence in case of a serious security incident;
Partner with the organization’s Chief Information Security Officer (CISO) team in improving threat detection and response.
It’s a tall order with a small staff, her and two others. Having recently migrated the majority of their workloads over from another public cloud provider, and having done this three years ago in a private environment with both physical and virtual workloads, she is familiar with the mechanisms she needs, but is still learning how to accomplish those capabilities in Google Cloud. Of course, she’s always looking for ways to get better visibility coverage and detections, simplify her team’s workflow, or both. Jaliesha’s story is a common one we hear around the Meet rooms at Google Cloud.
Google Cloud Network-based Threat Detection
We get it. The Google Cloud cybersecurity product management and engineering teams have been around the industry for decades. We observe the maturation of the industry from access control to the addition of intrusion prevention, and, more recently, analytics-based detection and automated response. As such, we have provided for several signal types that DevSecOps pros need in network-based threat detection efforts:
Network Forensics and Telemetry blueprint
We’ll describe each one of these five offerings and their signal types emitted in brief form, provide links to full details on each, call out the differences, and offer guidance on when to use each one. A quick summary follows in Table 1.
Table 1. Comparison of methods for ingesting signal for Network and Security Analytics
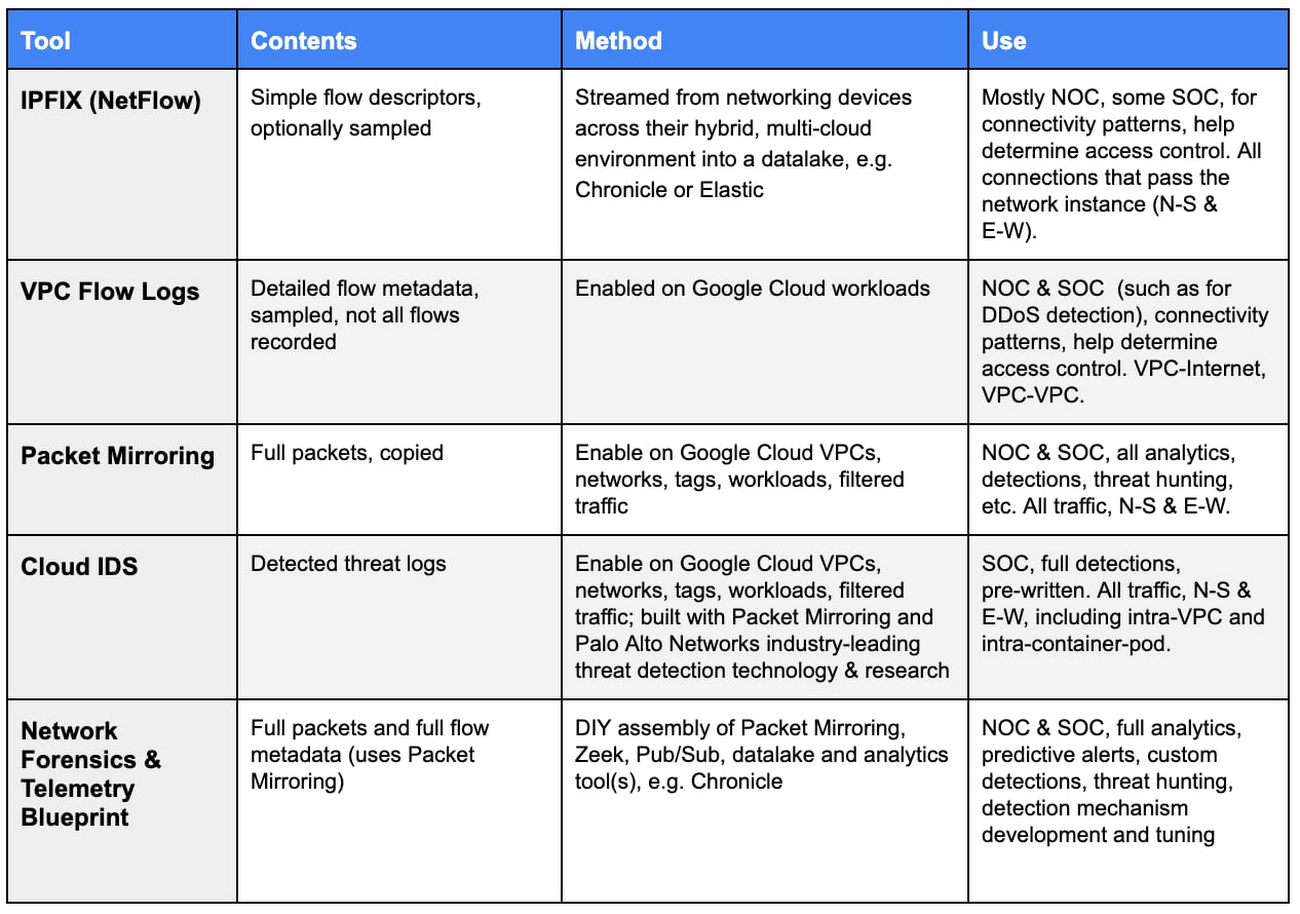

Table 1. Comparison of methods for ingesting signal for Network and Security Analytics
Flow / Session
Let’s start by defining a “network flow,” sometimes called “session,” because the terms will show up repeatedly throughout the remainder of this blog:
Flow noun: a series of packets originating from one network endpoint, the source, to another network endpoint, the destination, bounded by the opening and closing of that single, discreet connection session between the two.
An example would be a simple HTTP connection using TCP, which is IP protocol number 6, between endpoint A, the originator of the connection, with source IP:port of 10.1.1.2:5832, and endpoint B, destination of the connection, with IP:port 10.200.200.12:80. The “5-tuple” that describes any IP flow would be:
- IP Protocol #, source IP:port, destination IP:port
In this case:
- 6, 10.1.1.2:5832, 10.200.200.12:80.
IPFIX (was NetFlow)
What is it:
IPFIX is an international standard protocol from the IETF used to export IP flow information from network devices in a common format. It is based on a protocol originally designed, and published as Informational in IETF by Cisco called NetFlow.
IPFIX describes the network flow’s 5-tuple, as well as offers counters and other basic information about the connection that could be used for measurement, monitoring, accounting, billing, etc. This is the foundation of most all network monitoring currently. Most all modern mediating network devices support the export of IPFIX, including routers, switches, probes, next-gen firewalls (NGFWs), NAT gateways, etc. Many now perform the IPFIX data parsing, tracking, message creation and sending in hardware silicon to enable IPFIX export without impacting throughput.
By configuration, IPFIX / NetFlow can be exported from a number of different networking vendors’ image types that operate on Google Cloud, e.g. an NGFW, and are available in the Cloud Marketplace. Those records can be sent to Chronicle, or any number of 3rd party network performance monitoring (NPM), network traffic analytics (NTA), security information & event management (SIEM), network- or extended threat detection & response (NDR / XDR), or other 3rd party detection and response system. Our recently announced Autonomic Security Operations solution alongside integrations with Google Cloud’s business intelligence (BI) and analytics platform, Looker, and Chronicle (read the blog) makes querying this data set a task available to any SOC user via human language query, not just data analysts or those with SQL scripting expertise.
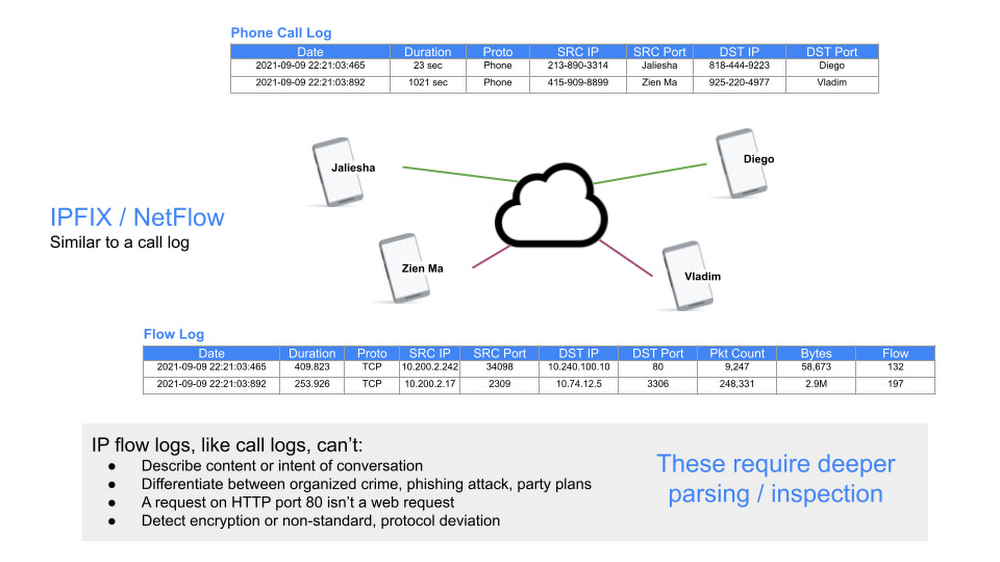

Graphic 1. Flow logs provide basic description, but not contents or intent
When to use it:
Jaliesha’s firm’s Network Operating Centers (NOCs) uses IPFIX to monitor network and endpoint connectivity, identify outages, measure utilization (for capacity planning, accounting, and billing), and to determine connectivity graphs. Using the latter, they established the baseline communication patterns for a network of endpoints. From that baseline a statistical characterization of the communication patterns between all endpoints was determined. This became the basis for many things. Capacity planning is one example.
From a security perspective, the baseline was also the foundation for migrating from a default-allow-explicit-block environment to the opposite, a zero-trust environment, i.e. default-deny-explicit-allow. This flow data allowed them to:
characterize the connectivity graph for a given endpoint, set of endpoints, each microservice, and an entire app;
determine if that pattern was currently in or out of policy;
draft an access control, authentication, and authorization policy for connectivity;
hypothetically evaluate that policy against historical and current traffic patterns, and
Adjust the enforced policy (via Cloud Armor, access control, IAM, Cloud Firewall, Cloud NAT, and VPC Service Controls).
As pointed out in Graphic 1 above, flow logs cannot determine anything about the contents or intent of a connection. For that Jaliesha needs metadata about the contents of the flow. We’ll address this in the VPC Flow Logs, Cloud IDS and Network Forensics & Telemetry Blueprint sections below.
VPC Flow Logs
What is it:
These logs record network flows sent from, and received by, workloads in a VPC, including both VM instances, and Google Kubernetes Engine nodes. They sample each workload’s TCP, UDP, ICMP, ESP, and GRE flows. They are a superset of IPFIX/NetFlow, adding attributes about each flow, including several attributes that are Google Cloud environment specific, like GCE & GKE context. They are based on sampled packets, interpolated to improve performance, and optionally filtered to reduce clutter and volume.
Not every packet is captured into a log record. About 1 out of every 10 packets is captured, but this sampling rate might be lower depending on the VM's load. The method compensates for missed packets by interpolating from the captured packets. This happens for packets missed because of initial and user-configurable sampling settings. All packets collected for a given interval for a given connection are aggregated for a period of time (aggregation interval). If a flow is captured by sampling VPC Flow Logs it generates a log for the flow; inferred: due to sampling, not all flows will be recorded. Each flow record includes the information described in the Record format, as listed here in Table 2 (where they are also contrasted to Cloud IDS threat log formats).
By default, VPC Flow Log entries are annotated with metadata information, such as the names of the source and destination VMs or the geographic region of external sources and destinations. These are also represented in Table 2. Metadata annotations can be turned off, or you can specify only certain annotations, to save storage space.
VPC Flow logs are aggregated by connection and exported in real time. They can be filtered by user-specified criteria, and a second sampling of logs can be taken according to a configurable sample rate parameter, again, to save space.
The logs are then sent to Cloud Logging (by default), where the data can be viewed. From there logs may be exported to any destination that Cloud Logging export supports. Alternatively, the logs can be excluded from Cloud Logging and sent to Pub/Sub, to analyze them using real-time streaming APIs or 3rd party tools.
VPC Flow Logs introduce no delay or performance penalty to customer workloads when enabled.
When to use it:
Jaliesha’s firm uses VPC Flow Logs for NOC-type network monitoring, utilization (for expenses), and capacity planning, along with DevSecOps / SOC-type monitoring.
Their NOC teams’ data scientists run predictive models against historical data, and use a pub/sub function to feed the logs in a real-time stream to a 3rd party tool that does the same, for more advanced, notify-prior-to-outage operations. For utilization and expenses, the NOC characterizes traffic between regions and zones, to specific countries or carriers on the Internet, and top talkers.
For the DevSecOps team, they filter the VPC Flow Logs by VMs and by applications to understand connectivity graphs, and changes within the graph, when moving to a zero-trust environment, and when setting or changing access control and micro-segmentation rules, building on what was originally accomplished with IPFIX records. They also accomplish some measure of network forensics, like which endpoint talked with whom and when, and analyze all flows to/from a compromised workload, to aid in root cause analysis and mitigation. Last, they leverage the real-time streaming APIs (through Pub/Sub), and integrate with their commercially available SIEM.
VPC Flow Logs provide enough signal for some real-time security analysis, as described above. They can be used to detect some attacks or undesirable traffic, like DDoS, interaction with known malicious IPs, etc. Other tools we offer from Google Cloud are better suited to network-based advanced threat detection, like Cloud IDS and the Network Forensics & Telemetry Blueprint, as discussed below.
Packet Mirroring
What is it:
Packet Mirroring is a product available on Google Cloud that clones traffic of customer-specified workloads in your VPC network and forwards it for examination. Packet Mirroring captures the full packet data, including payloads and headers. The customer configured system(s) that receive the packet stream from Packet Mirroring, called “backend collectors,” can be a number of different 3rd party, or Google Cloud, solutions:
Parsing tool (to create and store structured metadata), e.g. Zeek open source tool
Data lake, for both structured and unstructured data, e.g. Elastic
NTA workload
Detection engine, like an IDS, NDR, or next-gen firewall (NGFW) workload
Once Packet Mirroring is enabled, Google Cloud sets up the overlay encapsulation and forwarding for all the packets from the mirrored workload(s) to the packet receivers (back-end collectors, network sensors, etc.); the customer simply configures an Internal TCP/UDP Load Balancer, ILB, the service, and the backend collectors that will receive those packets. We take care of shuttling the mirrored traffic, encrypted and cryptographically authenticated, thus maintaining privacy, packet integrity and satisfying compliance standards for sensitive information. Policies provide Jaliesha’s team with highly customizable filtering so that they pay to mirror only the traffic they need in each use case, allowing them to manage their cost to meet their budget. All this activity occurs with zero compute performance impact on workloads.
Packet Mirroring is available on all GCE and GKE clusters, in all Google Cloud regions.
When to use it:
Packet Mirroring is useful when you need full-packet data – not just flow data (IPFIX / NetFlow), nor sampled flow data (VPC Traffic Logs) – to monitor and analyze your network for performance issues (NPM, NTA), security incidents (IDS, SIEM, NDR, XDR), connection or application troubleshooting, application performance monitoring (APM), or lawful intercept. Often, the recipient of the mirrored packets will be 3rd party, commercially available products.
Cloud IDS
What is it:
Google Cloud IDS (currently in Preview) is a network-based threat detection technology that helps identify applications in use, and many classes of exploits, including app masquerading, malware, spyware, command-and-control attacks, to name a few. Cloud IDS is built with Palo Alto Networks’ industry-leading threat detection technologies, backed by Unit 42’s high-quality threat research for high security efficacy. Customers can enjoy ease of deployment and a Google Cloud integrated experience with high performance.
Cloud IDS deploys in just a few clicks and is easily managed with either the Google Cloud browser-based GUI, CLI, or APIs. It leverages Cloud’s Packet Mirroring capability under the hood to move desired flows (defined by policy) to the detection engines. With Palo Alto Networks technology embedded, Cloud IDS helps ensure that your network is free of malicious applications masquerading as legitimate ones through App-ID™ technology. What’s more, there is no need to spend time crafting detection signatures; it’s built-in already. For known attacks, threat detection mechanisms, libraries, and signatures are continually updated and applied automatically – as you would expect of a managed cloud offering; for zero-day attacks, anomaly detections that alert on malicious behavior are similarly updated and applied. Cloud IDS delivers all this without the need to architect or manage all the pieces, removing an enormous operational burden, and freeing your SecOps.
Cloud IDS emits threat detection alert logs. See Table 2, for a comparative listing of the fields in these alerts and VPC Flow Logs.
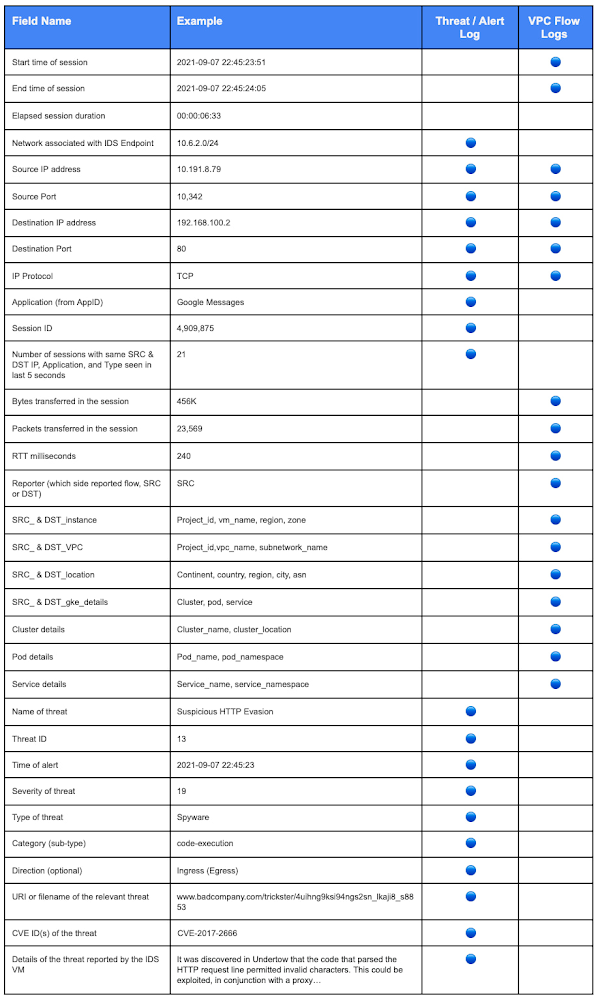

Table 2. Comparison of fields from Cloud IDS and VPC Flow Logs
When to use it:
Going beyond VPC Flow Logs, Cloud IDS provides near-real-time visibility into observed, network-based threats. Different than an NGFW sitting at a VPC edge, Cloud IDS provides full East-West visibility and detection, within VPCs, within GKE, and even between container pods.
Because Jaliesha works in a highly regulated industry, she uses Cloud IDS to help support their compliance requirements and goals for visibility and threat detection.
Since her DevSecOps team is stretched thin with time and money resources, Jaliesha appreciates the infusion of security research and expertise her team gains from automated detections being shown to them, rather than having to construct and script their own. Other customers are less into DIY detecting, and appreciate how our system covers all the basics automatically for them. For the DevSecOps team, Cloud IDS is a force multiplier, automating the bulk of the detection work, freeing them to do the more advanced detection and threat hunting specific to their environment.
Network Forensics & Telemetry Blueprint
What is it:
Jaliesha’s team has tools and methods they use to monitor and analyze network traffic in their own data centers, including detecting and hunting for threats both manually and with automation. Because these tools were designed for physical networks, and private clouds, they were not applicable when they migrated workloads to the cloud. The Network Forensics and Telemetry Blueprint addresses this need; it translates network packet data into logs so customers can use it in Google Chronicle, their existing SIEM, or other 3rd party analytics dashboards and tools, like NDR and XDR tools. The Network Forensics and Telemetry Blueprint is also natively offered through our Autonomic Security Operations solution.
Following this document, the DevSecOps team only needed to decide what workloads’ flows – which environments – they wanted to monitor. From there, Terraform scripts created the entire environment for them that accomplished:
Packet copy for all those flows, with zero performance impact to the workloads
Translated the copied packets’ raw data into metadata
Pushed structured and unstructured metadata into analysis tools and/or store them for post mortem investigation, of their choice, including a data lake and analysis, e.g. Chronicle, SIEM, Elastic, etc.
The recipe uses Packet Mirroring, ILB, Managed Instance Groups, Zeek, Pub/Sub, and (optionally) Google Chronicle:
Packet Mirroring - Sends copies of packets from all desired flows to/from any workloads desired
ILB & Managed Instance Groups - load balances the traffic to allow easy scaling of the Zeek instances
Zeek - Open source software for parsing raw packets into metadata
Pub/Sub - To export the metadata from Zeek to your data lake or analysis tool, if you already have one, e.g. an Elastic cluster. In Jaliesha’s case, they wanted something purpose built for threat detection and handling, so they chose Chronicle, which didn’t need Pub/Sub, because it is already integrated…
Chronicle - Allows security teams to cost effectively store, analyze, and write automated responses from all their security data to aid in the investigation and detection of threats. Customers author detections in Chronicle.
With Chronicle, customers build the required data pipeline for security analytics by sending log and metadata streams to it. Chronicle then provides a single pane of glass for analytics and detections, including support for aggregating data from a hybrid, multi-cloud architecture. Table 3 provides a few examples of rules that could be defined in Chronicle in order to detect web attacks, such as remote code execution and ransomware:


Table 3.
With these tools in place, the DevSecOps team scripts automation to take remediating actions in the environment when detections fire. An example would be the automated disconnection of network interfaces of a VM instance that is found to have command & control connections to an external, unfamiliar and unauthorized site, combined with observations of scanning internal networks.
Another example would be observing and mapping the healthy external services that internal workloads connect to in order to do their job, and then alerting on any connections made to unfamiliar domains by opening a ticket in their ServiceNow system for the team to address with the instance owner. Learn more about this exact use case from another customer in this Security Talks session.
When to use it:
The DevSecOps team uses this blueprint because they are going one step beyond Cloud IDS’s detections: they are threat hunting and authoring detections specific to their environment and volumes, and then automating remediation actions accordingly.
To do this, they want more than log data, they want packet and flow (PCAP) metadata. They also want to control the backend collector VMs that are deployed in their VPCs, and aggregate these collectors’ data into one location, combining them with other devices’ log data. They even add in endpoint logs and activity metadata.
They also have an outsourced managed security service provider (MSSP) that assists with tier 1 monitoring and validation of detections. Together with the MSSP, they write scripts and conduct manual threat hunting using flow metadata, device logs, and connection information placed into Chronicle from VPC Flow Logs, Cloud IDS threat logs, device logs, like their NGFW, DNS logs, and their Cloud Armor DDoS and WAF alerts.
Further, they store the network metadata and log data for 12 months, in order (a) to investigate security incidents, i.e. perform post mortem analysis to understand security impact and root cause once they’ve identified a breach or loss, and (b) to stockpile a data set on which to train their data science-based detections, some of which are ML-based (they use Google’s rich suite of AI/ML/Analytics tools to make this easy).
Table 4 that shows the differences specifically between Cloud IDS and Network Forensics & Telemetry Blueprint.
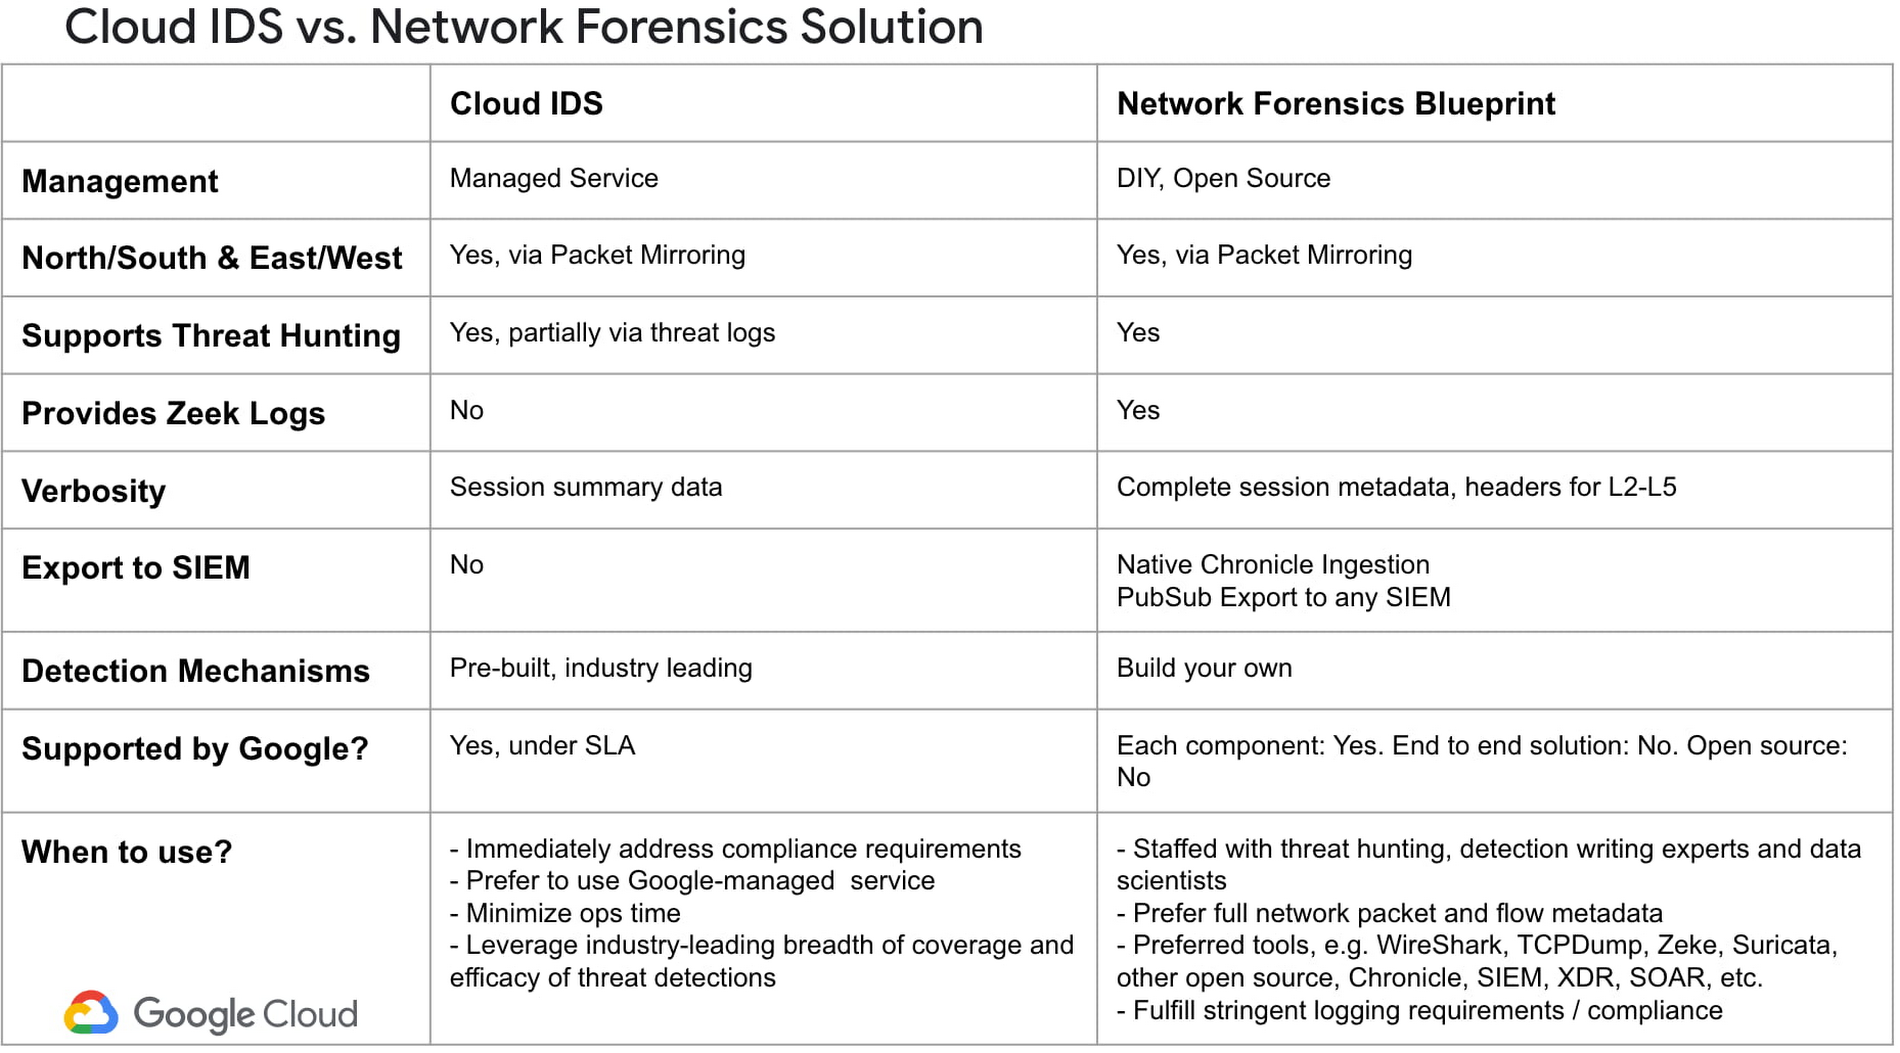

Table 4.
Summary
Jaliesha’s DevSecOps team has come a long way, and is using a variety of tools to keep their environment clean, meet compliance requirements, and minimize loss due to cyber attacks, as seen in Table 1 above. Some of these tools are cloud-native services from Google Cloud, like VPC Flow Logs, Packet Mirroring, Cloud IDS, and Chronicle. Others are integrations of our services, combined with both 3rd party, commercial tools and open source software. In this way, their threat detection environment is very similar to many of Google Cloud’s more security-focused customers.
Jaliesha is gratefully using these tools, but she’s hungry for more. We, the product management and engineering team for Network Security, meet with her regularly to hear her needs and collaborate on future offerings, because we aren’t done yet, not even close. We’ve got a lot more hybrid, multi-cloud, security services coming. If you’re like her, and have ideas on what we could do to be a force multiplier for your cybersecurity DevSecOps practice, please reach out to us through your account team; it would be great to add you and your team to our list of design partners.
If you are interested to learn more about Network Forensics & Telemetry Blueprint, please read our technical blog here.
