What a trip! Measuring network latency in the cloud
Derek Phanekham
PhD student, Computer Science, Southern Methodist University
Rick Jones
Software Engineer, Google Cloud Network Performance
A common question for cloud architects is “Just how quickly can we exchange a request and a response between two endpoints?” There are several tools for measuring round-trip network latency, namely ping, iperf, and netperf, but because they’re not all implemented and configured the same, different tools can return different results. And in most cases, we believe netperf returns the more representative answer to the question—you just need to pay attention to the details.
Google has lots of practical experience in latency benchmarking, and in this blog, we’ll share techniques jointly developed by Google and researchers at Southern Methodist University’s AT&T Center for Virtualization to inform your own latency benchmarking before and after migrating workloads to the cloud. We'll also share our recommended commands for consistent, repeatable results running both intra-zone cluster latency and inter-region latency benchmarks.
Which tools and why
All the tools in this area do roughly the same thing: measure the round trip time (RTT) of transactions. Ping does this using ICMP packets, and several tools based on ping such as nping, hping, and TCPing perform the same measurement using TCP packets.
For example, using the following command, ping sends one ICMP packet per second to the specified IP address until it has sent 100 packets.
ping <ip.address> -c 100
Network testing tools such as netperf can perform latency tests plus throughput tests and more. In netperf, the TCP_RR and UDP_RR (RR=request-response) tests report round-trip latency. With the -o flag, you can customize the output metrics to display the exact information you're interested in. Here’s an example of using the test-specific -o flag so netperf outputs several latency statistics:
netperf -H <ip.address> -t TCP_RR -- \ -o min_latency,max_latency,mean_latency
*Note: this uses global options: -H for remote-host and -t for test-name with a test-specific option -o for output-selectors. Example.
As described in a previous blog post, when we run latency tests at Google in a cloud environment, our tool of choice is PerfKit Benchmarker (PKB). This open-source tool allows you to run benchmarks on various cloud providers while automatically setting up and tearing down the virtual infrastructure required for those benchmarks.
Once you set up PerfKit Benchmarker, you can run the simplest ping latency benchmark or a netperf TCP_RR latency benchmark using the following commands:
These commands run intra-zone latency benchmarks between two machines in a single zone in a single region. Intra-zone benchmarks like this are useful for showing very low latencies, in microseconds, between machines that work together closely. We'll get to our favorite options and method to run these commands later in this post.
Latency discrepancies
Let's dig into the details of what happens when PerfKit Benchmarker runs ping and netperf to illustrate what you might experience when you run such tests.
Here, we've set up two c2-standard-16 machines running Ubuntu 18.04 in zone us-east1-c, and we'll use internal ip addresses to get the best results.
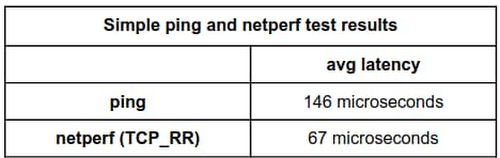
If we run a ping test with default settings and set the packet count to 100, we get the following results:
By default, ping sends out one request each second. After 100 packets, the summary reports that we observed an average latency of 0.146 milliseconds, or 146 microseconds.
For comparison, let’s run netperf TCP_RR with default settings for the same amount of packets.
Here, netperf reports an average latency of 66.59 microseconds. The ping average latency reported is ~80 microseconds different than the netperf one; ping reports a value more than twice that of netperf! Which test can we trust?
To explain, this is largely an artifact of the different intervals the two tools used by default. Ping uses an interval of 1 transaction per second while netperf issues the next transaction immediately when the previous transaction is complete.
Fortunately, both of these tools allow you to manually set the interval time between transactions, so you can see what happens when adjusting the interval time to match.
For ping, use the -i flag to set the interval, given in seconds or fractions of a second. On Linux systems, this has a granularity of 1 millisecond, and rounds down. For example, if you use an interval of 0.00299 seconds, this rounds down to 0.002 seconds, or 2 milliseconds. If you request an interval smaller than 1 millisecond, ping rounds down to 0 and sends requests as quickly as possible.
You can start ping with an interval of 10 milliseconds using:
$ ping <ip.address> -c 100 -i 0.010
For netperf TCP_RR, we can enable some options for fine-grained intervals by compiling it with the --enable-spin flag. Then, use the -w flag, which sets the interval time, and the -b flag, which sets the number of transactions sent per interval. This approach allows you to set intervals with much finer granularity, by spinning in a tight loop until the next interval instead of waiting for a timer; this keeps the cpu fully awake. Of course, this precision comes at the cost of much higher CPU utilization as the CPU is spinning while waiting.
*Note: Alternatively, you can set less fine-grained intervals by compiling with the --enable-intervals flag. Use of the -w and -b options requires building netperf with either the --enable-intervals or --enable-spin flag set.
The tests here are performed with the --enable-spin flag set. You can start netperf with an interval of 10 milliseconds using:
$ netperf -H <ip.address> -t TCP_RR -w 10ms -b 1 -- \ -o min_latency,max_latency,mean_latency
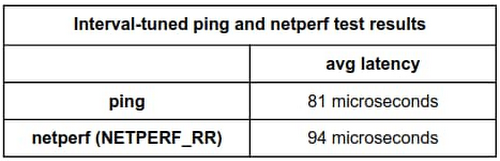
Now, after aligning the interval time for both ping and netperf to 10 milliseconds, the effects are apparent:
ping:
netperf:
By setting the interval of each to 10 milliseconds, the tests now report an average latency of 81 microseconds for ping and 94.01 microseconds for netperf, which are much more comparable.
You can illustrate this effect more clearly by running more tests with ping and netperf TCP_RR over a range of varied interval times ranging from 1 microsecond to around ~1 second and plotting the results.
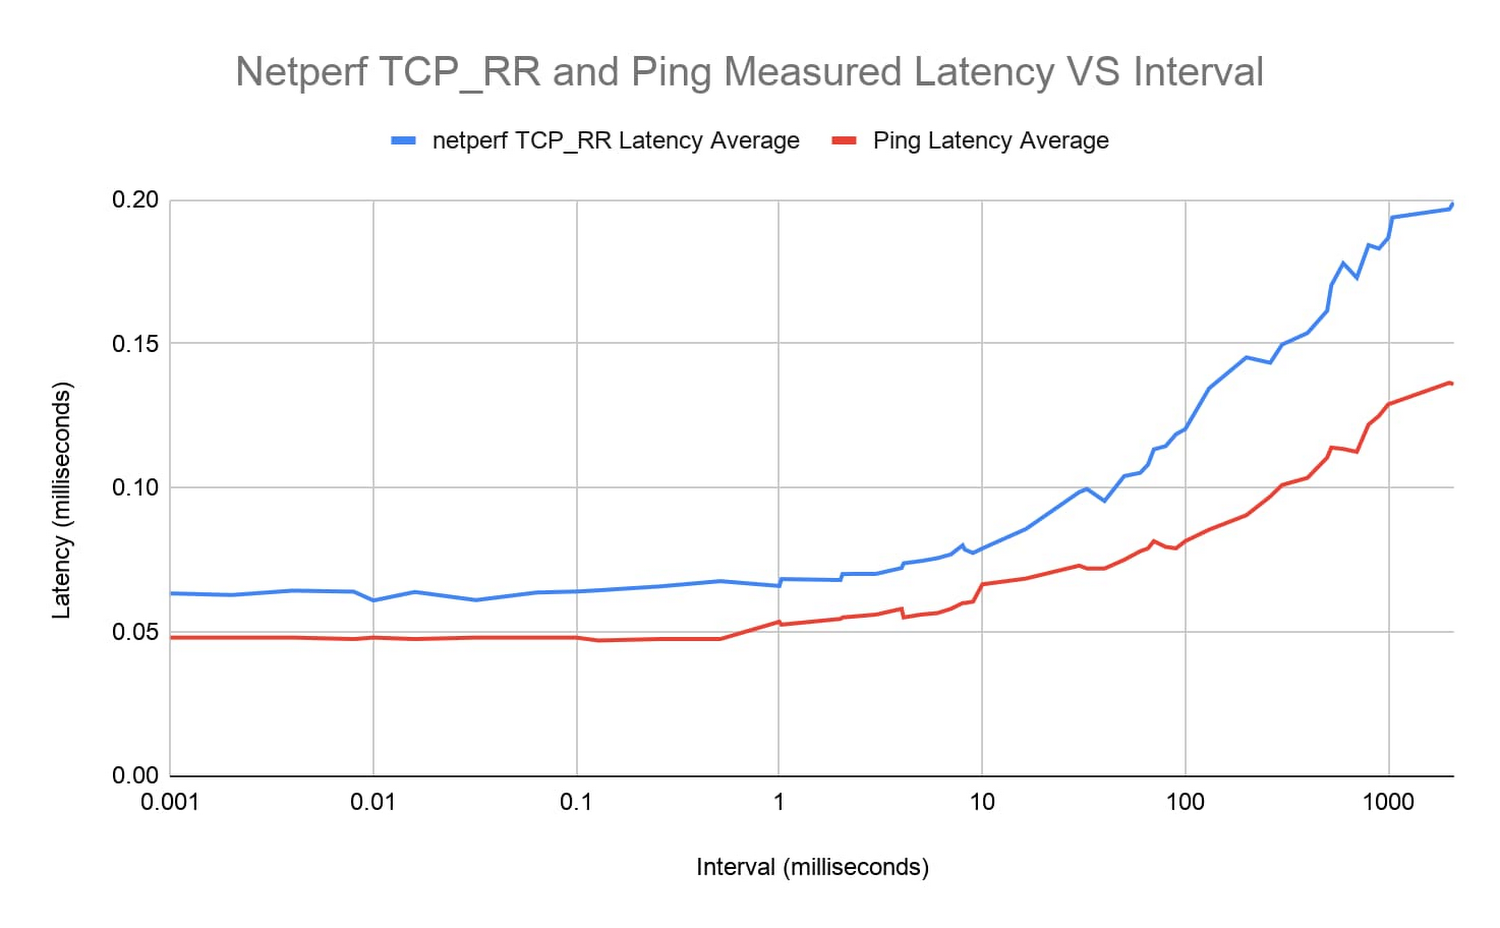
The latency curves from both tools look very similar. For intervals below ~1 millisecond, round-trip latency remains relatively constant around 0.05-0.06 milliseconds. From there, latency steadily increases.
Takeaways
So which tool's latency measurement is more representative—ping or netperf—and when does this latency discrepancy actually matter?
Generally, we recommend using netperf over ping for latency tests. This isn't due to any lower reported latency at default settings, though. As a whole, netperf allows greater flexibility with its options and we prefer using TCP over ICMP. TCP is a more common use case and thus tends to be more representative of real-world applications. That being said, the difference between similarly configured runs with these tools is much less across longer path lengths.
Also, remember that interval time and other tool settings should be recorded and reported when performing latency tests, especially at lower latencies, because these intervals make a material difference.
To run our recommended benchmark tests with consistent, repeatable results, try the following:
For intra-zone cluster latency benchmarking:
This benchmark uses an instance placement policy which is recommended for workloads which benefit from machines with very close proximity to each other.
For inter-region latency benchmarking:
Notice that the netperf TCP_RR benchmarks run with no additional interval setting. This is because by default netperf inserts no added intervals between request/response transactions; this induces more accurate and consistent results.
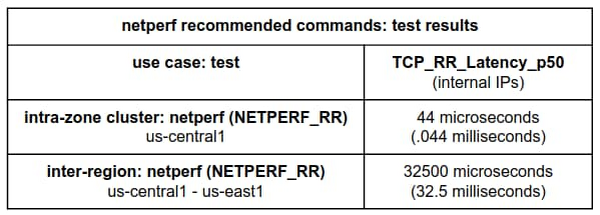
Note: This latest netperf intra-zone cluster latency result benefits from controlling any added intervals in the test and from using a placement group.
What’s next
In our next network performance benchmarking post, we’ll get into the details about how to use the new public-facing Google Cloud global latency dashboard to better understand the impact of cloud migrations on your workloads.
Also, be sure to check out our PerfKit Benchmarker white paper and the PerfKit Benchmarker tutorials for step-by-step instructions running networking benchmark experiments!
Special thanks to Mike Truty, Technical Curriculum Lead, Google Cloud Learning for his contributions.