Introducing Stackdriver as a data source for Grafana
Joy Wang
Senior Product Manager
Matt Toback
Grafana Lab VP of Experience
It is not uncommon to have multiple monitoring solutions for IT infrastructure these days as distributed architectures take hold for many enterprises. We often hear from Google Cloud Platform (GCP) customers that they use Stackdriver to monitor resources as well as Grafana and Prometheus for container monitoring. We’ve heard lots of requests from customers to be able to view Stackdriver data in Grafana effortlessly.
We listened to your feedback and worked closely with Grafana Labs to build a solution. We are happy to announce the beta release of the Stackdriver data source for Grafana. The Stackdriver data source plugin for Grafana lets you seamlessly incorporate Stackdriver data into your Grafana instance.
Stackdriver offers observability across cloud deployments from GCP or Amazon Web Services (AWS), or on-prem infrastructure with monitoring, logging and application performance management tools. Grafana is an open source, time series data visualization and alerting tool that specializes in unifying measurement data across many different sources. Its plugin architecture lets you add new types of graph panels and more than 40 different data sources, including commercial databases and web services.
When you update Grafana to version 5.3, the Stackdriver plugin will become available alongside Prometheus. You can install the new Stackdriver data source for Grafana here.
Here’s how you can get started using Stackdriver data source in Grafana.
Authenticate with a GCP service account
To authenticate with the Stackdriver API, start by creating a GCP service account for the particular project you want to show data for. A Grafana data source integrates with one GCP project, which belongs to an application or VM. With one Grafana data source set up per GCP project, you’ll be able to visualize data from multiple GCP projects.

Enable APIs
To visualize Stackdriver data, the following APIs need to be enabled from within Grafana first:
Click on the links above and click the Enable button for each API.
Create a GCP service account for a project
1. Navigate to APIs & Services, then to Credentials.
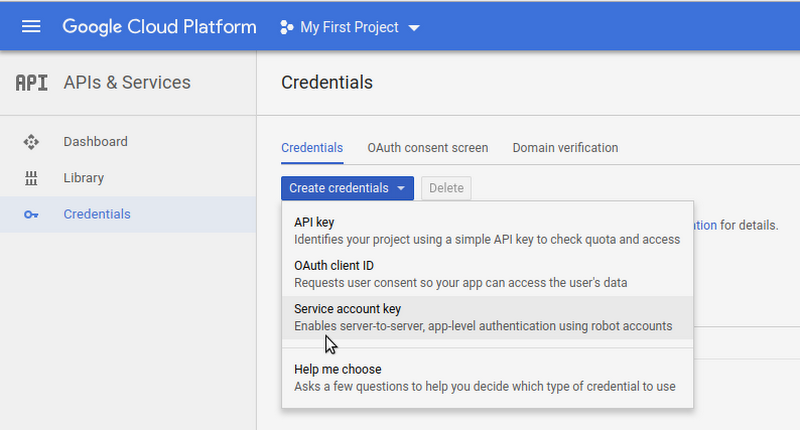
2. Click on the Create credentials dropdown button and choose the Service account key option.

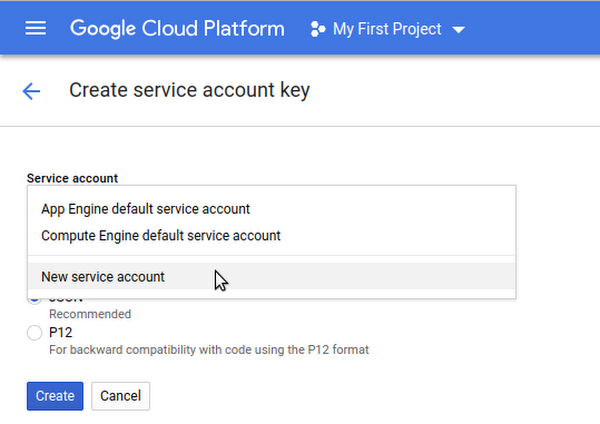
3. On the Create service account key page, choose key type JSON. Then in the Service Account dropdown, choose the New service account option:

4. Some new fields will appear. Fill in a name in the service account name field, and then choose the Monitoring Viewer role from the dropdown:
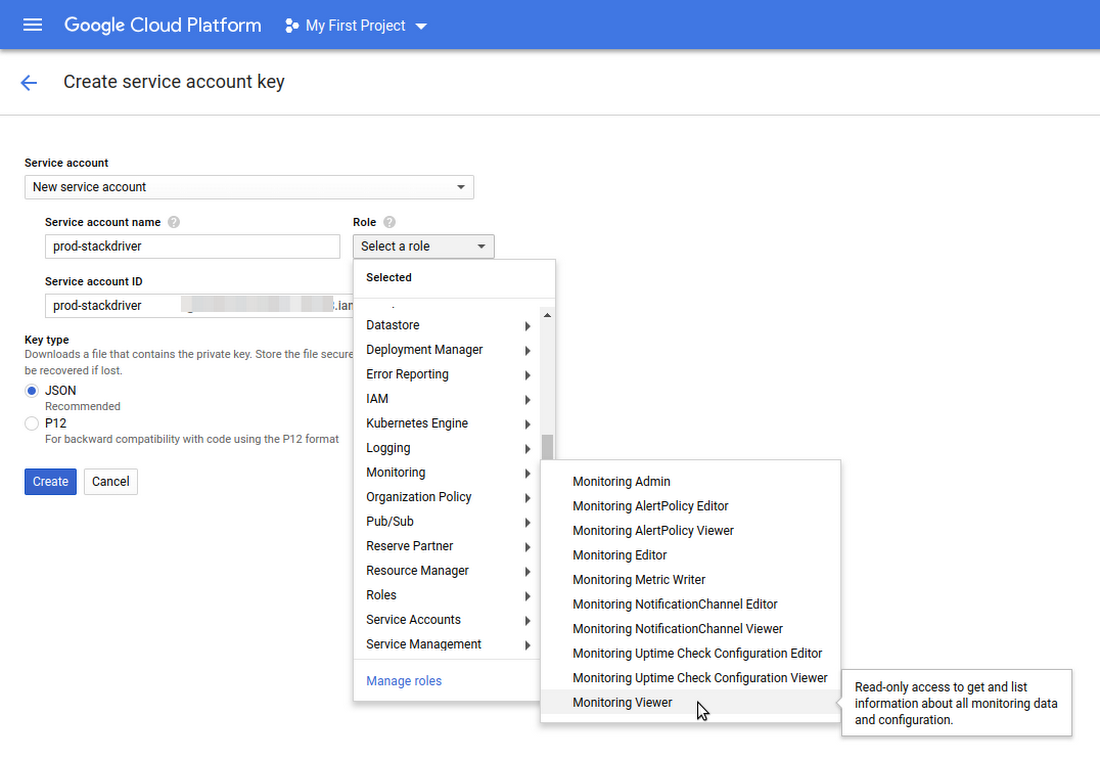

5. Click the Create button. A JSON Web Token (JWT) file will be created and downloaded to your computer. Store this file in a secure place, since it allows access to your Stackdriver data.
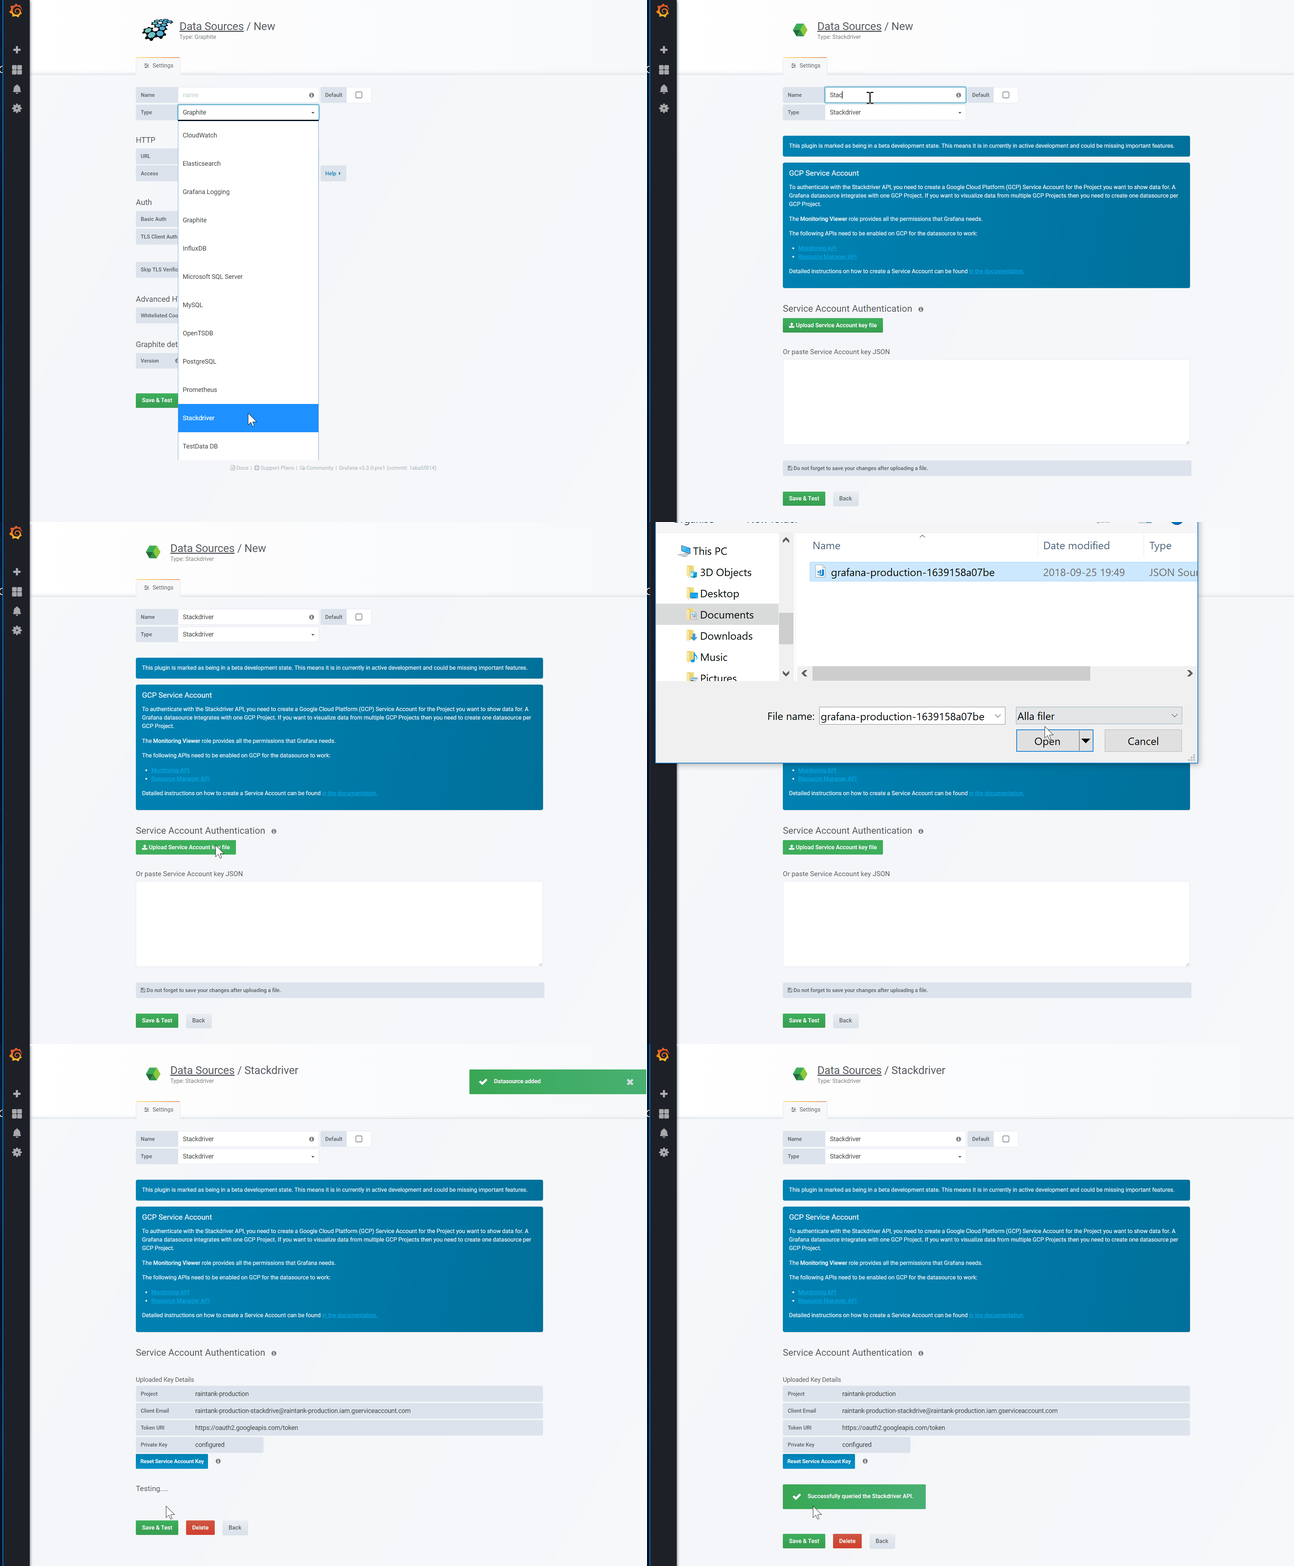
6. Upload this file to Grafana on the data source configuration page. You can either upload the file or paste in the contents of the file.
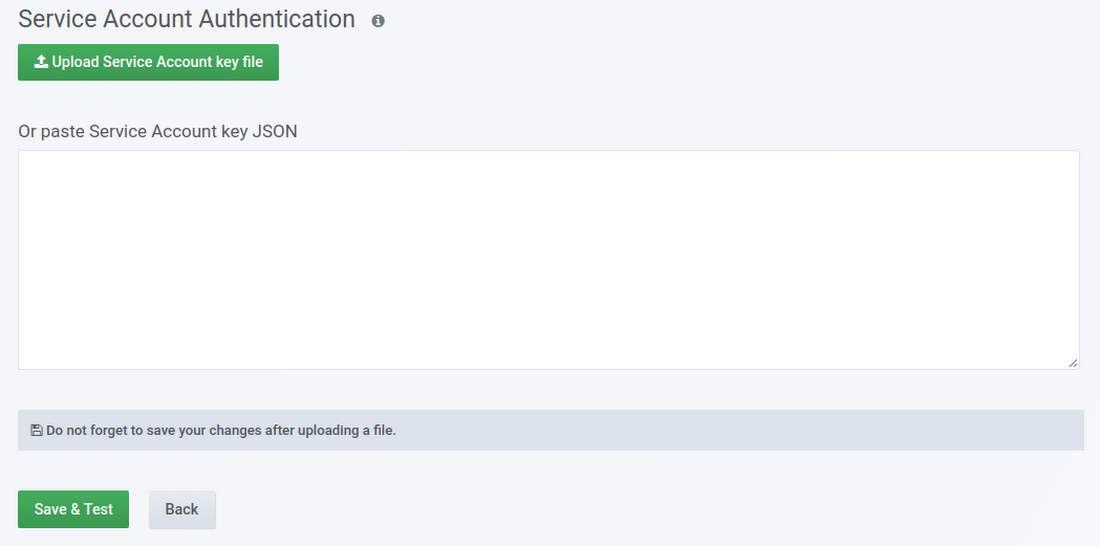

7. The file contents will be encrypted and saved in the Grafana database. (Don’t forget to save after uploading the file.)


After the Stackdriver data source is authenticated, you will be able to apply the alias to legend labels and create annotations that are triggered by events, along with many other features on Grafana. Here’s how to do that.
Using alias patterns
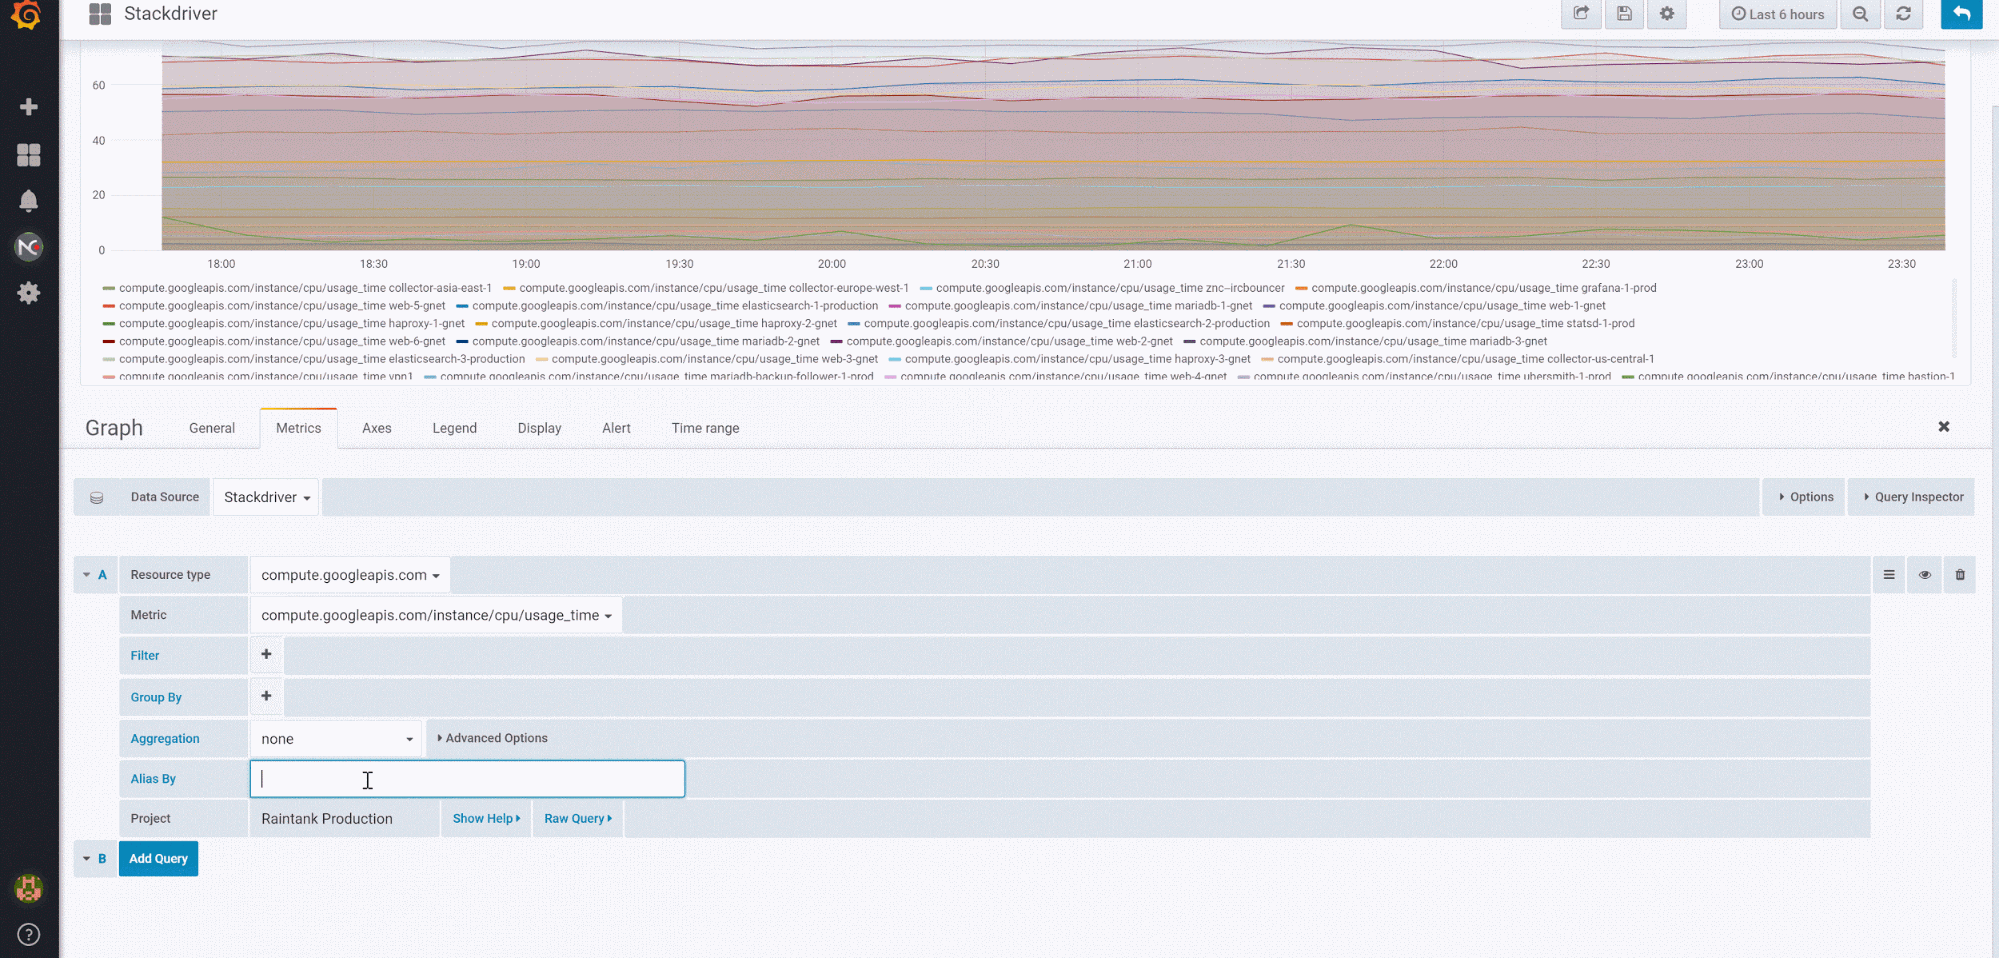
The “Alias By” field allows you to control the format of the legend keys. The default shows the metric name and labels. This can be long and hard to read. Using the following patterns in the alias field, you can format the legend key the way you want it to reflect the names.

Creating annotations
Grafana annotations allow you to overlay rich event information on top of graphs. To do this, create an annotation query that returns events, such as deployments or outages.


You can read more here about using Stackdriver in Grafana. Give it a try and let us know what you think!
