Cloud Profiler provides app performance insights, without the overhead
Kalyana Chadalavada
Engineering Manager
Alexey Alexandrov
Tech Lead and Manager
Do you have an application that’s a little… sluggish? Cloud Profiler, Google Cloud’s continuous application profiling tool, can quickly find poor performing code that slows your app performance and drives up your compute bill. In fact, by helping you find the source of memory leaks and other errors, Profiler has helped some of Google Cloud’s largest accounts reduce their CPU consumption by double-digit percentage points.
What makes Profiler so useful is that it aggregates production performance data over time from all instances of an application, while placing a negligible performance penalty on the application that you are examining—typically less than 1% CPU and RAM overhead on a single profiled instance, and practically zero when it’s amortized over the full collection duration and all instances of the service!
In this blog post, we look at elements of Profiler’s architecture that help it achieve its light touch. Then, we demonstrate the negligible effect of Profiler on an application in action by using DeathStarBench, a sample hotel reservation application that’s popular for testing loosely coupled microservices-based applications. Equipped with this understanding, you’ll have the knowledge you need to enable Profiler on those applications that could use a little boost.
Profiler vs. other APM tools
Traditionally, application profiling tools have imposed a heavy load on the application, limiting the tools’ usefulness. Profiler, on the other hand, uses several mechanisms to ensure that it doesn’t hurt application performance.
Sampling and analyzing aggregate performance
To set up Profiler, you need to link a provided language-specific library to your application. Profiler uses this library to capture relevant telemetry from your applications that can then be analyzed using the user interface of the tool. Cloud Profiler supports applications written in Java, Go, Node.js and Python.
Cloud Profiler’s libraries sample application performance, meaning that they periodically capture stack traces that represent the CPU and heap consumption of each function. This behavior is different from an event-tracing profiler, which intercepts and briefly halts every single function call to record performance information.
To ensure your service's performance is not impacted, Profiler carefully orchestrates the interval and duration of the profile collection process. By aggregating data across all of the instances of your application over a period of time, Profiler can provide a complete view into production code performance with negligible overhead.
Roaming across instances
The more instances of each service from which you capture profiles, the more accurately Cloud Profiler can analyze your codebase. While each Profiler library / agent uses sampling to reduce the performance impact on a running instance, Profiler also ensures that only one task in a deployment is being profiled at a given time. This ensures that your application is never in a state where all instances are being sampled at the same time.
Profiler in action
To measure the effect of Profiler on an application, we used it with an application with known performance characteristics, the DeathStarBench hotel reservation sample application. The DeathStarBench services were designed to test the performance characteristics of different kinds of infrastructure, service topologies, RPC mechanisms, and service architecture on overall application performance, making them an ideal candidate for these tests. While this particular benchmark is written in Go and uses the Go profiling agent, we expect results for other languages to be similar, since Profiler’s approach to sampling frequency and profiling is similar for all languages that it supports.
In this example, we ran the eight services that compose the hotel reservation application on a GCE c2-standard-4 (4 vCPUs, 16 GB memory) VM instance running Ubuntu 18.04.4 LTS Linux and configured the load generator for two series of tests: one at 1,000 queries per second, and one at 10,000. We then performed each test 10 times with Profiler attached to each service and 10 times without it, and recorded the service’s throughput and the CPU and memory consumption in Cloud Monitoring. Each iteration ran for about 5 minutes, for a total of about 50 minutes for 10 iterations.
The following data shows the result of the 1,000 QPS run:
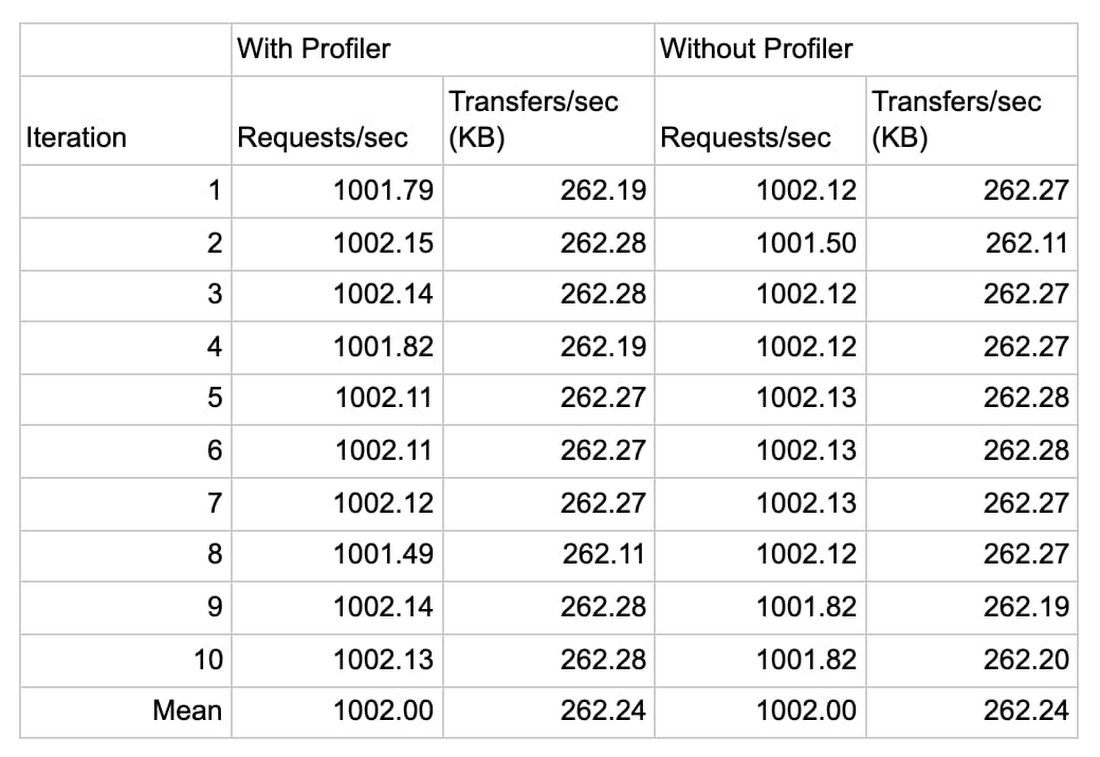
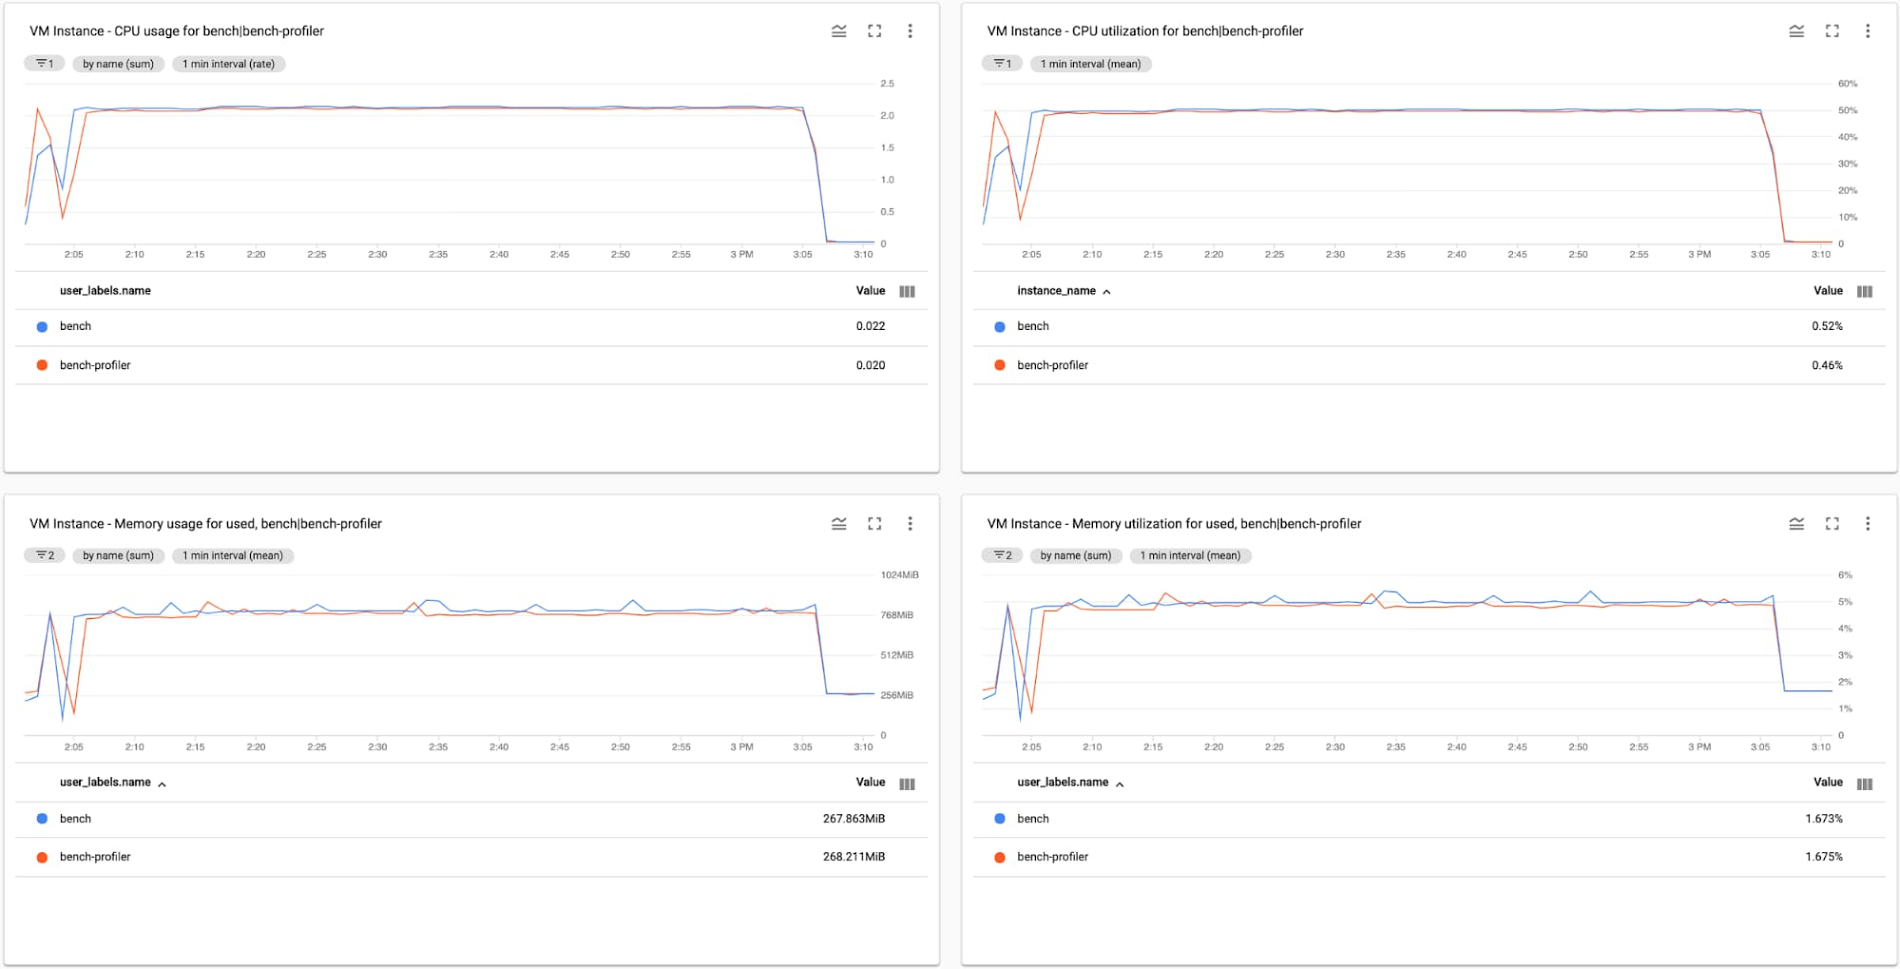
In the first test we observe that Profiler introduces a negligible increase in CPU (less than 0.5%) consumption and a minor increase in memory consumption, averaging to roughly 32 MB (3.7%) of additional RAM usage across eight services, or just under 4 MB per service.
The following data shows the result of the 10,000 QPS run:
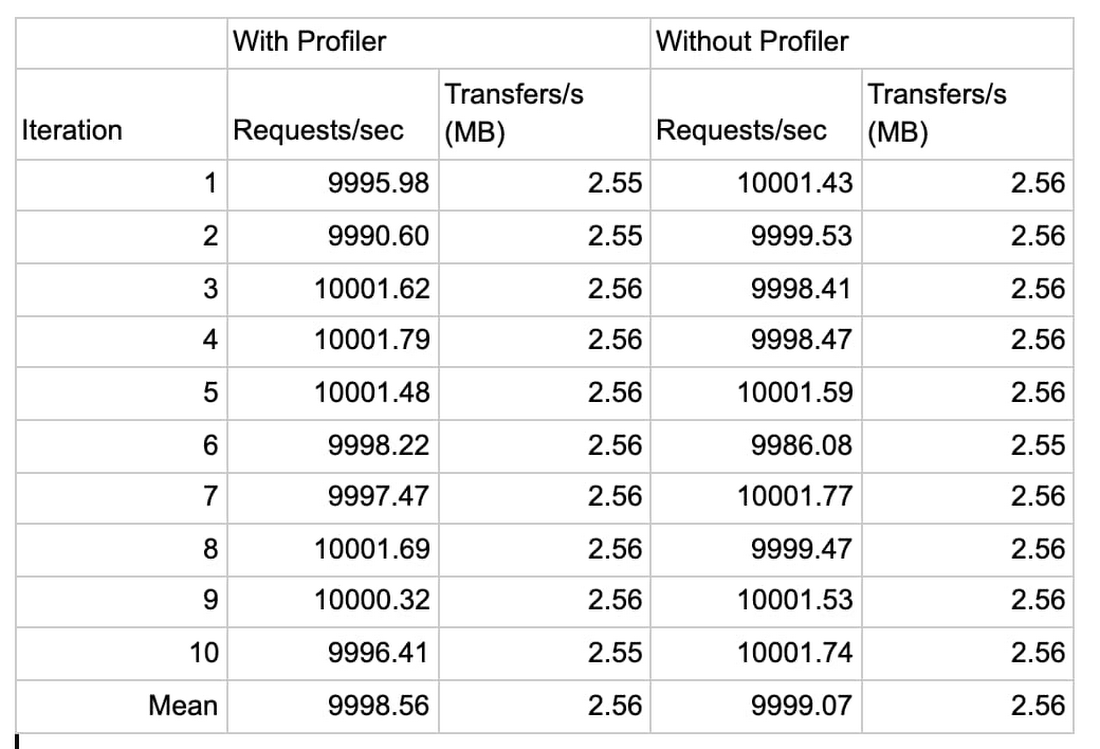
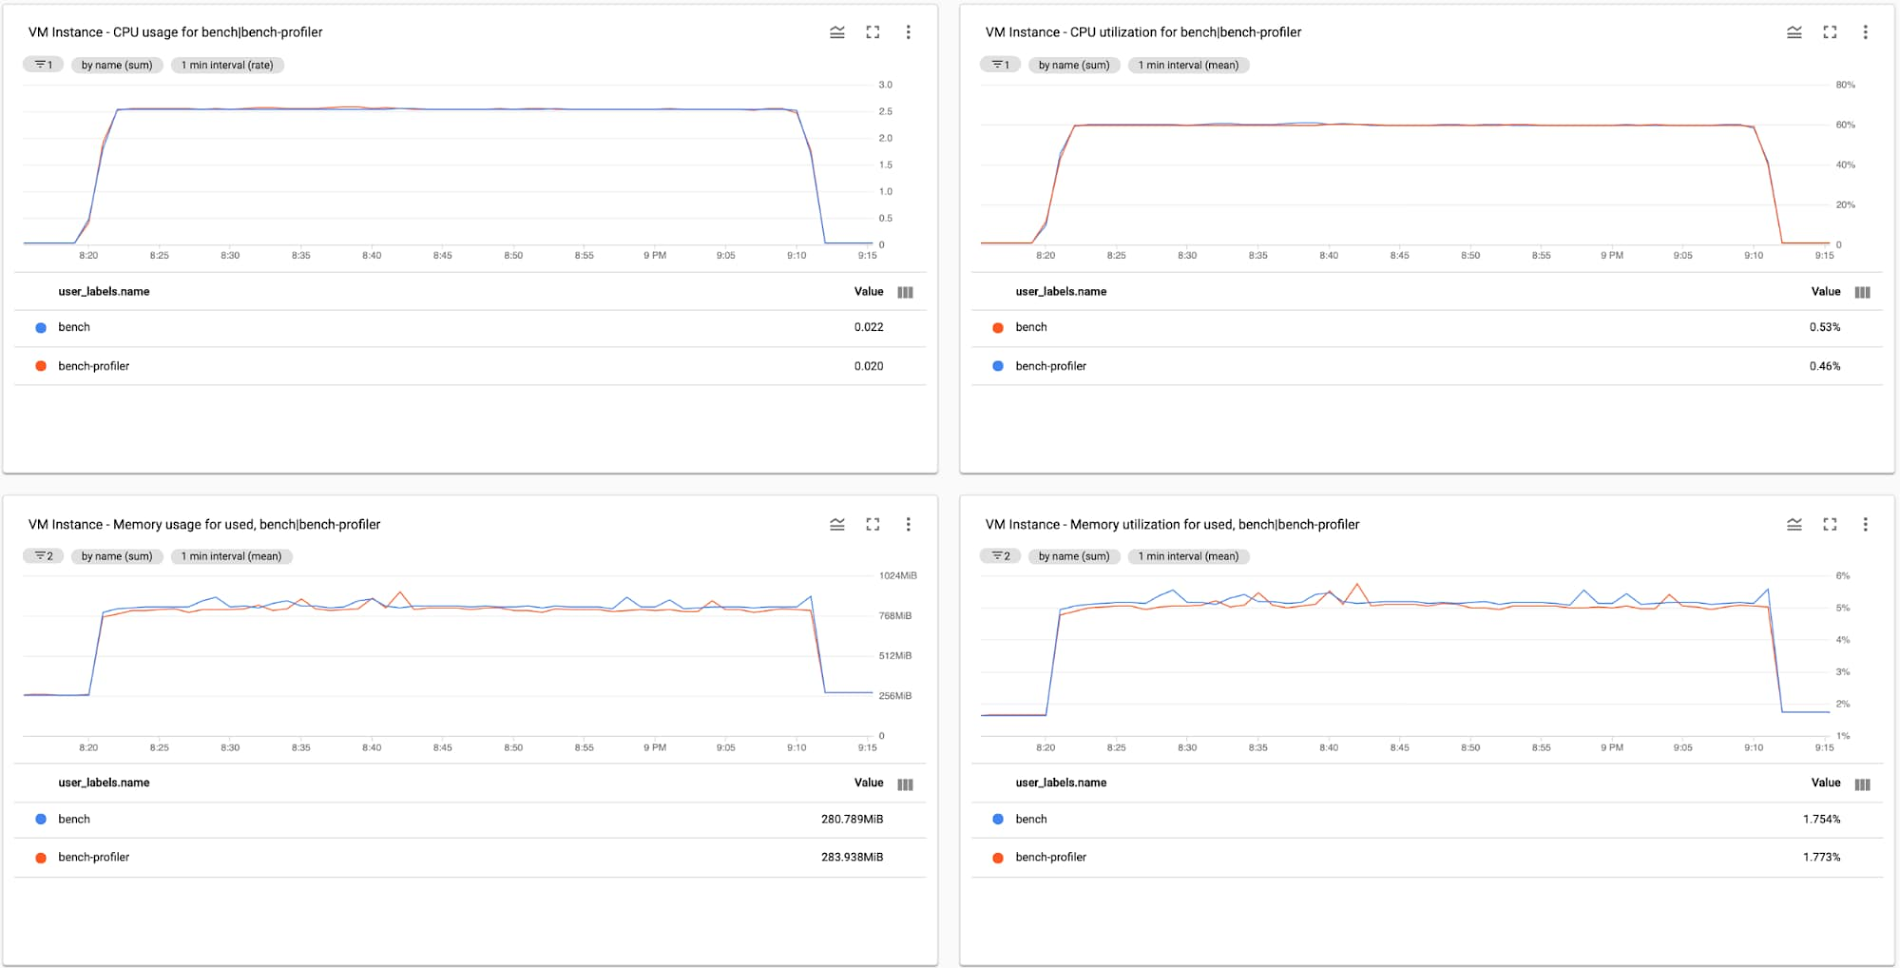
In the second test, we see that Profiler’s only impact on application is in line with the previous observations that the increase in memory consumption is roughly 23 MB (2.8%) of memory, or 3MB per service, and a negligible increase in CPU (less than 0.5%) consumption.
In both tests, the increase in memory usage can be attributed to the increase in the application’s binary size after linking with the Profiler agent.
In exchange, you gain deep insight into code performance, down to each function call, as shown here for the hotel reservation application:
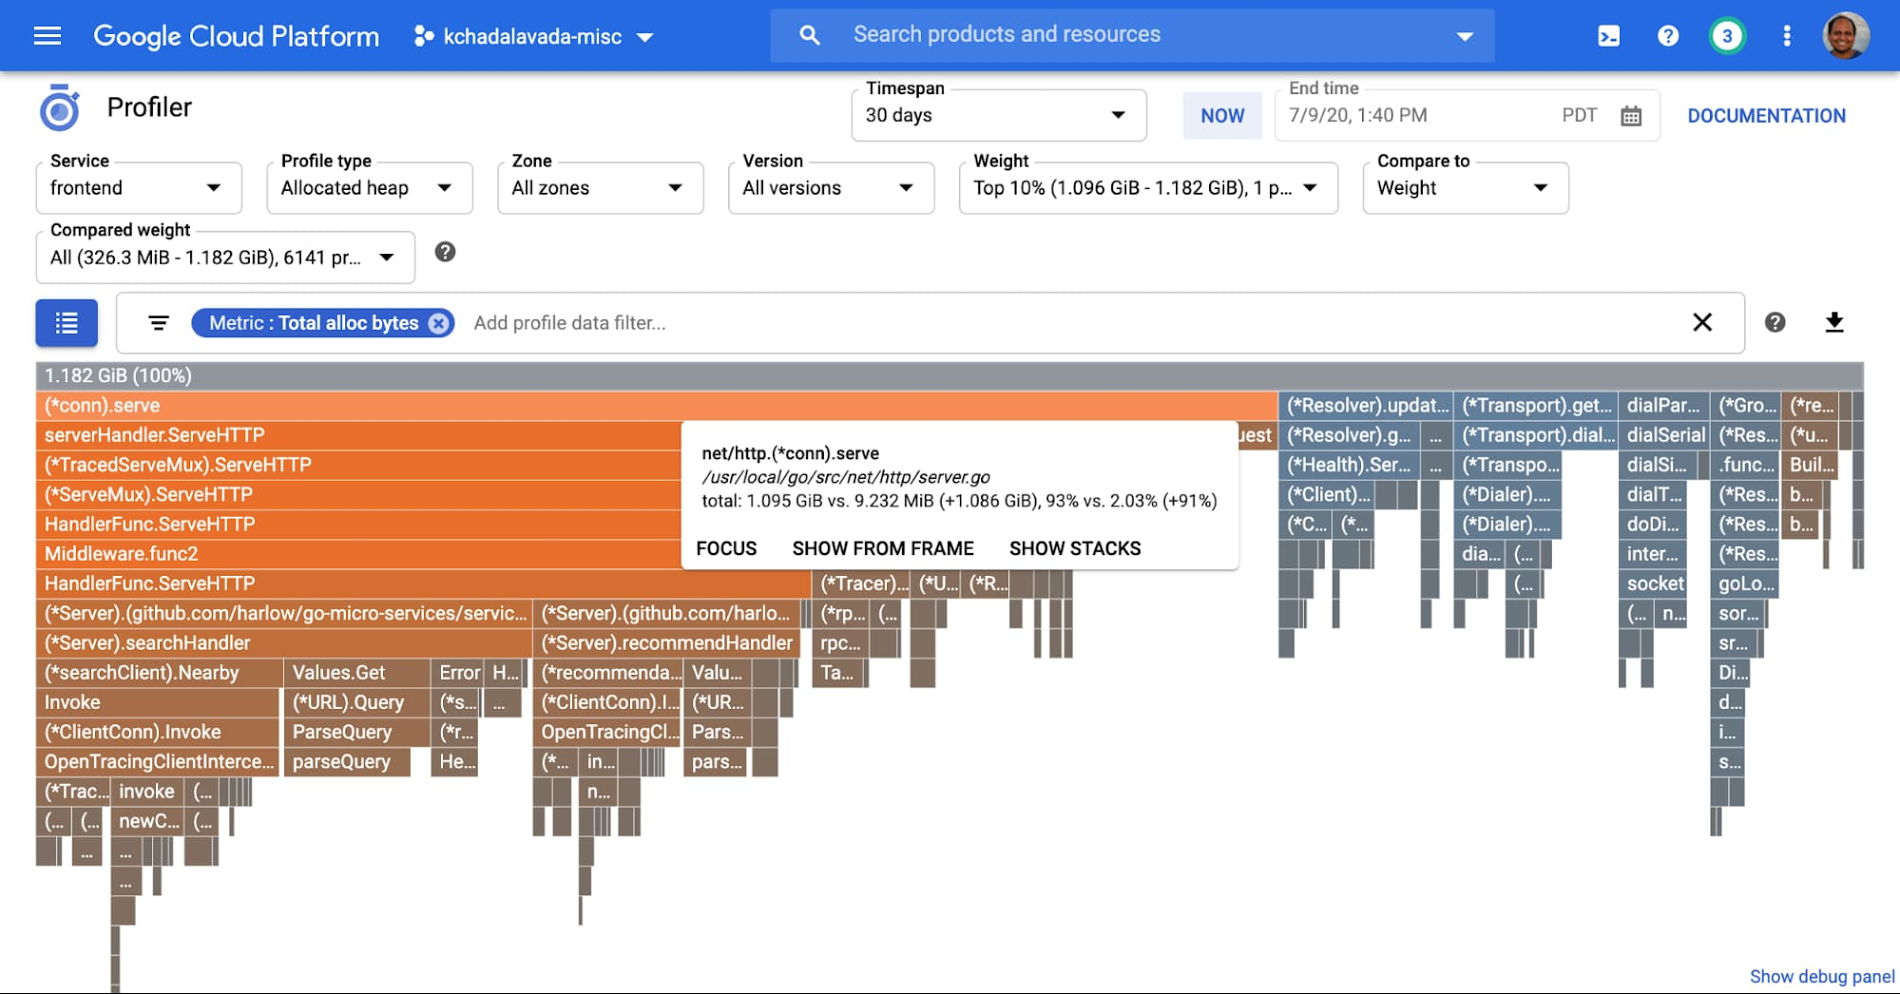
Here we use Profiler to analyze the memory usage of the benchmark’s “frontend” service. We utilize Profiler’s weight filter and weight comparison features to determine the functions that increased their memory usage while the application scaled from 1,000 QPS to 10,000 QPS, which are highlighted in orange.
Conclusion
In short, Profiler introduces no discernible impact on an application’s performance, and a negligible impact on CPU and memory consumption. And in exchange, it lets you continuously monitor the production performance of your services without affecting their performance or incurring any additional costs! That’s a win-win, in our book. To learn more about Profiler, be sure to read this Introduction to Profiler, and this blog about its advanced features.