See how your code actually executes with Stackdriver Profiler, now GA
Morgan McLean
Product Manager for Stackdriver Profiler
We’re happy to announce that Stackdriver Profiler is now generally available. This is an important piece of our Stackdriver monitoring and logging tool for Google Cloud Platform (GCP) services. It brings continuous CPU and heap profiling, so you can improve the performance of your cloud services and cut costs.
Stackdriver Profiler shows you how your code actually executes in production. You can see how functions are called and which functions are consuming the most CPU and memory, with no noticeable performance impact. Profiler is free to use and supports Java, Go, Node.js, and Python applications running on Google Kubernetes Engine (GKE), Google Compute Engine, containers, VMs, or physical machines running anywhere. Here’s what it looks like:
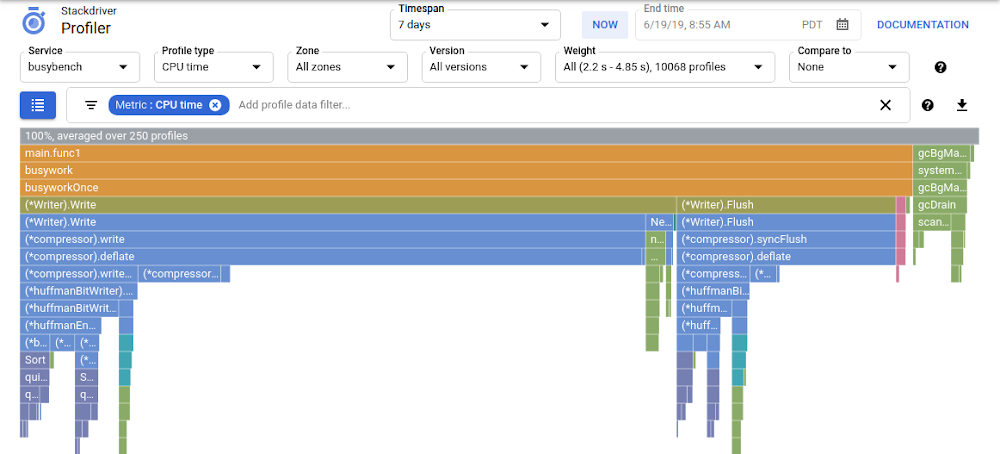

Profiler is useful for optimizing the performance of your code, tracking down the sources of memory leaks, and reducing your costs. It provides insight about production performance that isn’t available anywhere else.
Using Profiler in production
Many of our largest customers are having great success with Profiler. We’ll let them describe the impact that it’s had on their businesses:
"Using Stackdriver Profiler, the back-end team at Outfit7 was able to analyze the memory usage pattern in our batch processing Java jobs running in App Engine Standard, identify the bottlenecks and fix them, reducing the number of OOMs [out-of-memory] errors from a few per day to almost zero,” says Anže Sodja, senior software engineer at Outfit7 Group (Ekipa2 subsidiary). “Stackdriver Profiler helped us to identify issues fast, as well as significantly reducing debugging time by enabling us to profile our application directly in the cloud without setting up a local testing environment."

In addition, Snap Inc. has found great success using Profiler. "We used Stackdriver Profiler as part of an effort to improve the scalability of our services,” says Evan Yin, software engineer at Snap Inc. “It helped us to pinpoint areas we can optimize and reduce CPU time, which means a lot to us at our scale."
Making Profiler continually better
We’re always working to add useful new functionality to Profiler. We recently added weight filtering and a table showing the aggregate cost of each function, and we’ve added even more features in the past few months:
Full support for Python applications running on containers and VMs
New optional coloring modes for the flame graph, which highlights functions based on their consumption, exposed via the new “color mode” filter in the filter bar
Tool tips for filters, accessible through the question mark button to the right of the filter bar
The focus table now works with the comparison feature and adds additional comparison columns when two sets of profiles are being compared
We’re really excited that Profiler is now generally available, and we hope that you are too. In the coming months and quarters we’ll keep focusing on ways to make this product even better. If you haven’t yet used Stackdriver Profiler, get started here.
