How to use Stackdriver monitoring export for long-term metric analysis
Charles Baer
Product Manager, Google Cloud
Our Stackdriver Monitoring tool works on Google Cloud Platform (GCP), Amazon Web Services (AWS) and even on-prem apps and services with partner tools like Blue Medora’s BindPlane. Monitoring keeps metrics for six weeks, because the operational value in monitoring metrics is often most important within a recent time window. For example, knowing the 99th percentile latency for your app may be useful for your DevOps team in the short term as they monitor applications on a day-to-day basis.
However, there’s a lot of value in a longer-term analysis over quarters or years. That long-term analysis may reveal trends that might not be apparent with short-term analysis. Analyzing longer-term Monitoring metrics data may provide new insights to your DevOps, infrastructure and even business teams. For example, you might want to compare app performance metrics from Cyber Monday or other high-traffic events against metrics from the previous year so you can plan for the next high-traffic event. Or you might want to compare GCP service usage over a quarter or year to better forecast costs. There might also be app performance metrics that you want to view across months or years.
With our new solution guide, you can understand the metrics involved in analyzing long-term trends. The guide also includes a serverless reference implementation for metric export to BigQuery.
Creating a Stackdriver reference architecture for longer-term metrics analysis
Here’s a look at how you can set up a workflow to get these longer-term metrics:


Monitoring provides a time series list API method, which returns collected time series data. Using this API, you can download your monitoring data for external storage and analysis. For example, using the Monitoring API, you could download your time series and then store it in BigQuery for efficient analysis.
Analyzing metrics over a larger time window means that you’ll have to make a design choice around data volumes. Either you include each individual data point and incur the time and cost processing of each one, or you aggregate metrics over a time period, which reduces the time and cost of processing at the expense of reduced metrics granularity.
Monitoring provides a powerful aggregation capability in the form of aligners and reducers available in the Monitoring API. Using aligners and reducers, you can collapse time-series data to a single point or set of points for an alignment period. Selecting an appropriate alignment period depends on the specific use case. One hour provides a good trade-off between granularity and aggregation.
Each of the Monitoring metrics have a metricKind and a valueType, which describe both the type of the metric values as well as what the values represent (i.e., DELTA or GAUGE values). These values determine which aligners and reducers may be used during metric aggregation.
For example, using an ALIGN_SUM aligner, you can collapse your App Enginehttp/server/response_latencies metrics for each app in a given Stackdriver Workspace into a single latency metric per app per alignment period. If you don’t need to separate the metrics by their associated apps, you can use an ALIGN_SUM aligner combined with a REDUCE_PERCENTILE_99 reducer to collapse all of your App Engine latency metrics into a single value per alignment period, as shown here: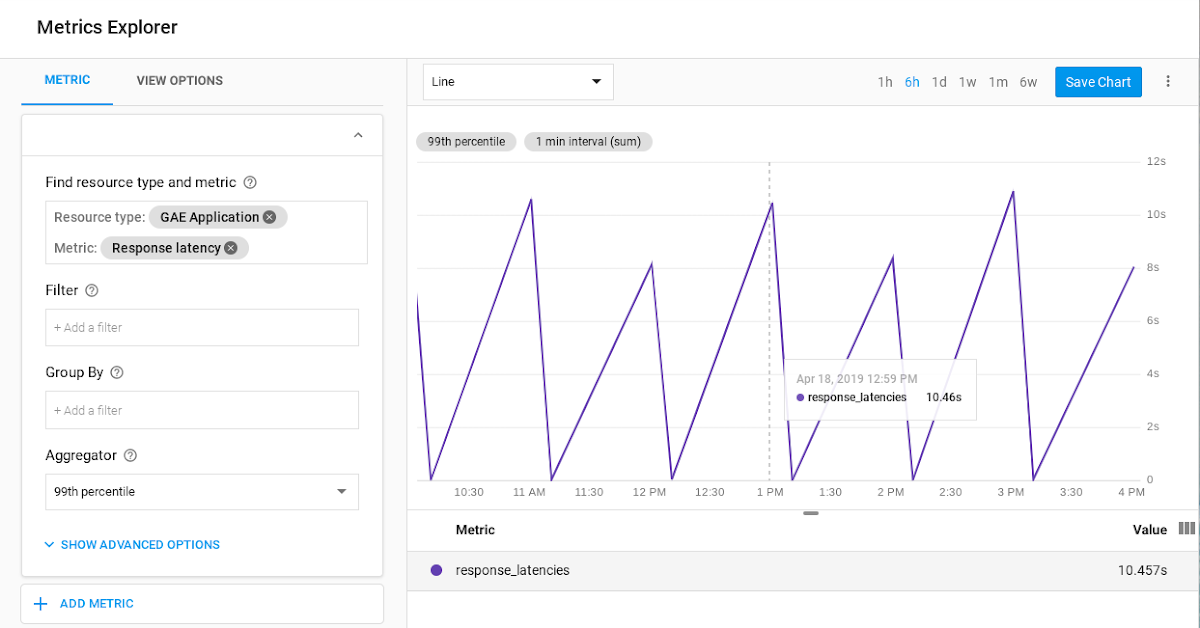

For more considerations on metrics, metric types, and exporting to BigQuery for analysis, check out our solution guide.
Be sure to let us know about other guides and tutorials you’d like to see using the “Send Feedback” button at the top of the solution page. And you can check out our full list of how-to solutions for all GCP products.
