Ten ways troubleshooting GKE apps is now easier in Cloud Logging, part 2
Charles Baer
Product Manager, Google Cloud
Eyamba Ita
Product Manager
At Google Cloud, we know that developer time is precious. That’s why we’re always looking for ways to improve your productivity. In our first post, we covered the first five of ten new features that we launched in Cloud Logging so that you can more quickly get to the logs that matter and resolve issues more quickly. In this post, we’ll cover the last five!
Improved logs display for Google Kubernetes Engine (GKE) in the Cloud Console – improved display and log filtering in the GKE section of the Cloud Console
Pivot around a log entry – easily find related logs by pinning a log entry
Filter severity updates – more easily filter by severity and above to find error logs
Hide/Show similar log entries – reduce noise by hiding logs
Histogram filtering – use the histogram to easily filter logs
New date/time options – new quick options to make date/time selection easier
Faster text searches – a new built-in function to find strings in your logs that uses automatically created indexes to reduce query time
Find and highlight in log results – find values in log results
Copy/paste log improvements – better copy/paste formatting
Show/hide summary chips + Wrap log lines – toggle to a basic text view by removing summary chips, toggle to wrap log lines
Continuing the example in our previous blog post, we’ll focus on the actions that happen after an issue has been identified with an alert or dashboard. In the scenario, there is a microservices-based ecommerce application that is deployed to Google Kubernetes Engine (GKE). Each microservice generates logs that can be used to understand the system behavior. There are intermittent errors generated in our application that have prompted a troubleshooting session to understand the root cause.
Using the same demo GKE app as in our first blog post, we’ll continue the process of troubleshooting an example application and point out how the new features streamline the troubleshooting steps.
6. New date/time options
Troubleshooting often requires adjusting the date/time of searches to understand behavior at specific dates and times. Selecting the date/time quickly can often introduce additional clicks, which translate into more effort. With our latest update, picking common date/time ranges is even easier. Since consistency is important, the same date/time picker is now used in Cloud Monitoring, Metrics Explorer, Logs Dashboard and Log Analytics.
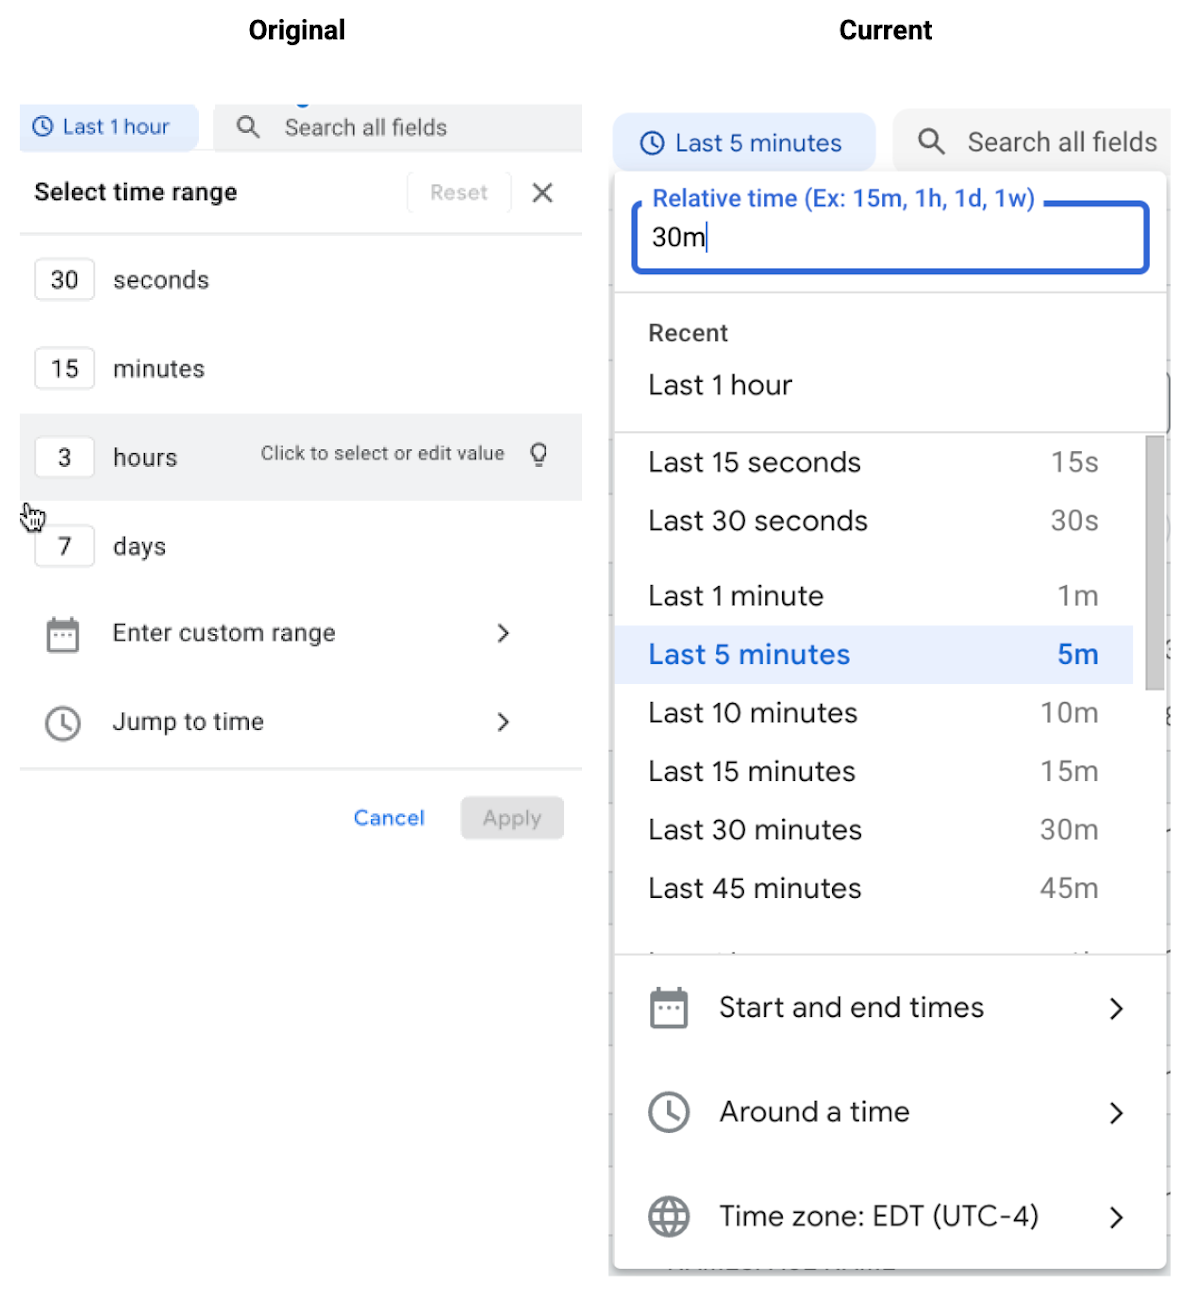

You can now select quick options in the date/time pickers ranging from the last 5 minutes to the last 30 days. To make it even faster, we added the relative time option at the top of the date/time picker so that you can enter shortcuts like 1h or 30m for relative time.
In our GKE application example, we may need to look at logs over the last five minutes and then broaden that to the last 30 minutes to determine when the error started. For example, to look at the last 5 minutes of logs, you can select the Last 5 minutes option. To look at the last 30 minutes of logs, you can enter 30m in the Relative time box.
7. Faster text searches
Troubleshooting is often done under the pressure to fix a user-facing issue, which means that faster is better. We’re excited to announce that queries using the simple text search box just got faster.
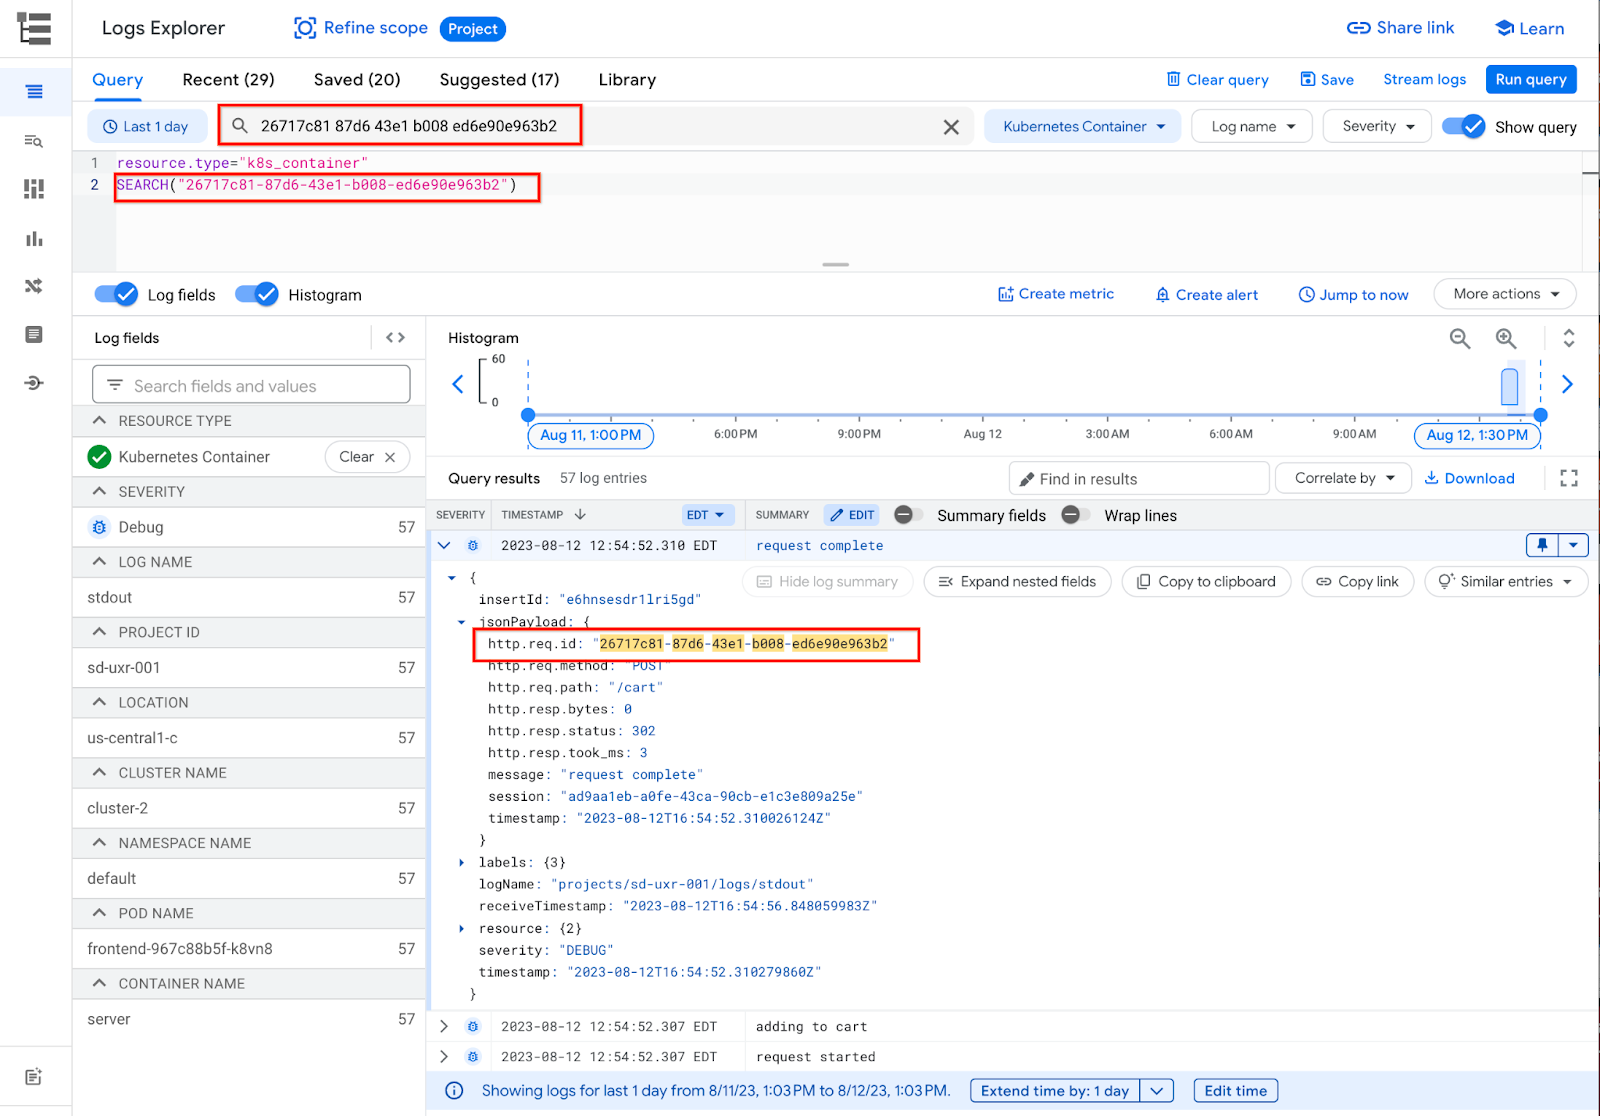
Our new token-based SEARCH function makes use of a new automatic token index to speed up the results of your query. The SEARCH function works by breaking your text into tokens and looking for those string tokens in the index. And the best part is that it’s automatic! Just enter a search and the Logs Explorer will automatically add the SEARCH function. The query then uses the indexes so that your query is faster. There’s no additional cost for the indexing and you don’t have to set it up. It’s all there for you automatically.
In our example, we could use a text search to quickly find a specific request id across logs for the previous day. The SEARCH function is automatically added to the query and finds the matching string token in the logs using the index, returning a result quickly.

8. Find and highlight in log results
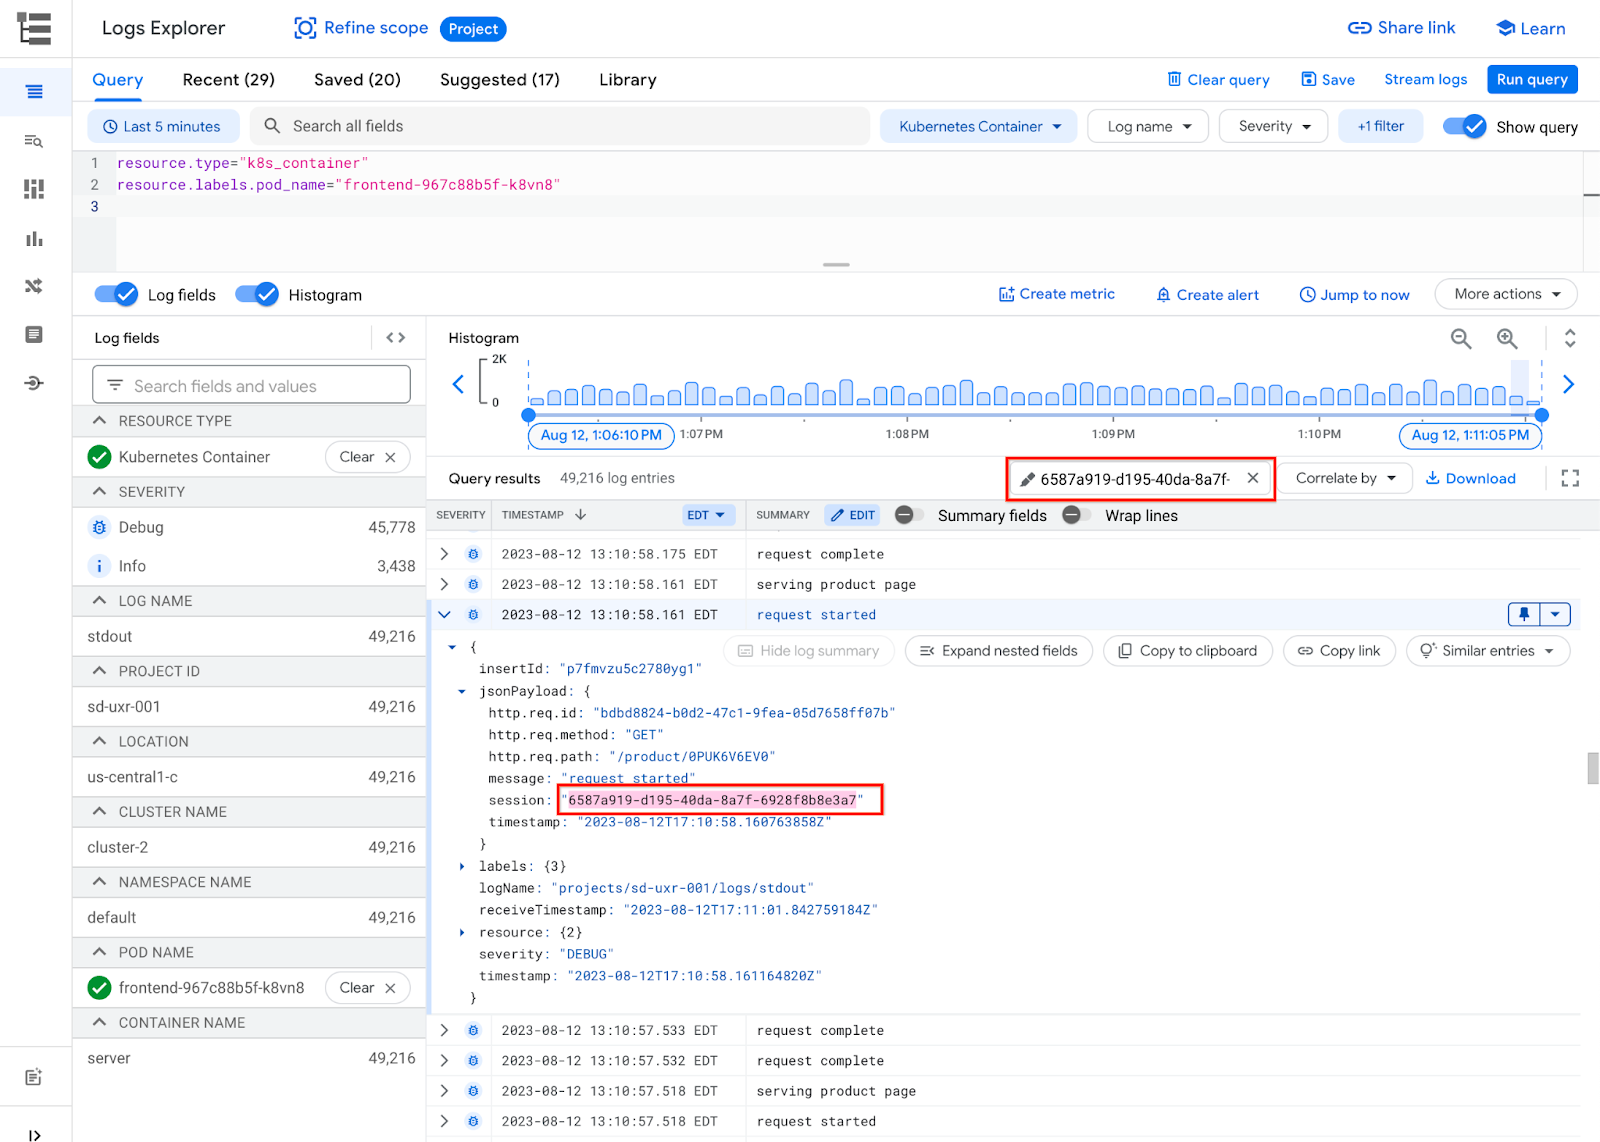
Continuing with the theme of quickly finding query results, our new Find in results option on the query results bar provides a way to find specific values in your query results without running another query, making it easy to find the value in the logs.
In our example, if we want to look at logs for a specific session within our results, using the Find in results to search for the “6587a919-d195-40da-8a7f-6928f8b8e3a7” session makes it easy to see the values in the logs. This is particularly useful for finding values in very large log lines.

9. Copy/paste log improvements
Troubleshooting is often a team sport which means that sharing information is critical. With this update, selecting logs to copy/paste preserves formatting in a way that makes it easier to share the log information. There are several different ways to share information in Logs Explorer including sharing a link, shared queries, downloading the logs, sharing a link to the log entry, but a simple copy/paste is often the easiest way to share the information quickly.
In our example, once we’ve found a specific set of logs for a specific session id, we may want to share the information with a teammate to show the timing/sequence of the log entries. Now, a simple select/copy from the query results in Logs Explorer will preserve the logs in a format matching the summary lines so that our teammates can see the timing and log information that they need.


The resulting logs when pasted appear in the format below.


10. Show/hide summary chips + Wrap log lines
With our latest launch, you can now customize the way your query results are presented using toggles to turn on/off the summary fields and line wrapping.
In our troubleshooting example, you may prefer to see the more text-heavy view by hiding summary lines and wrap log lines.
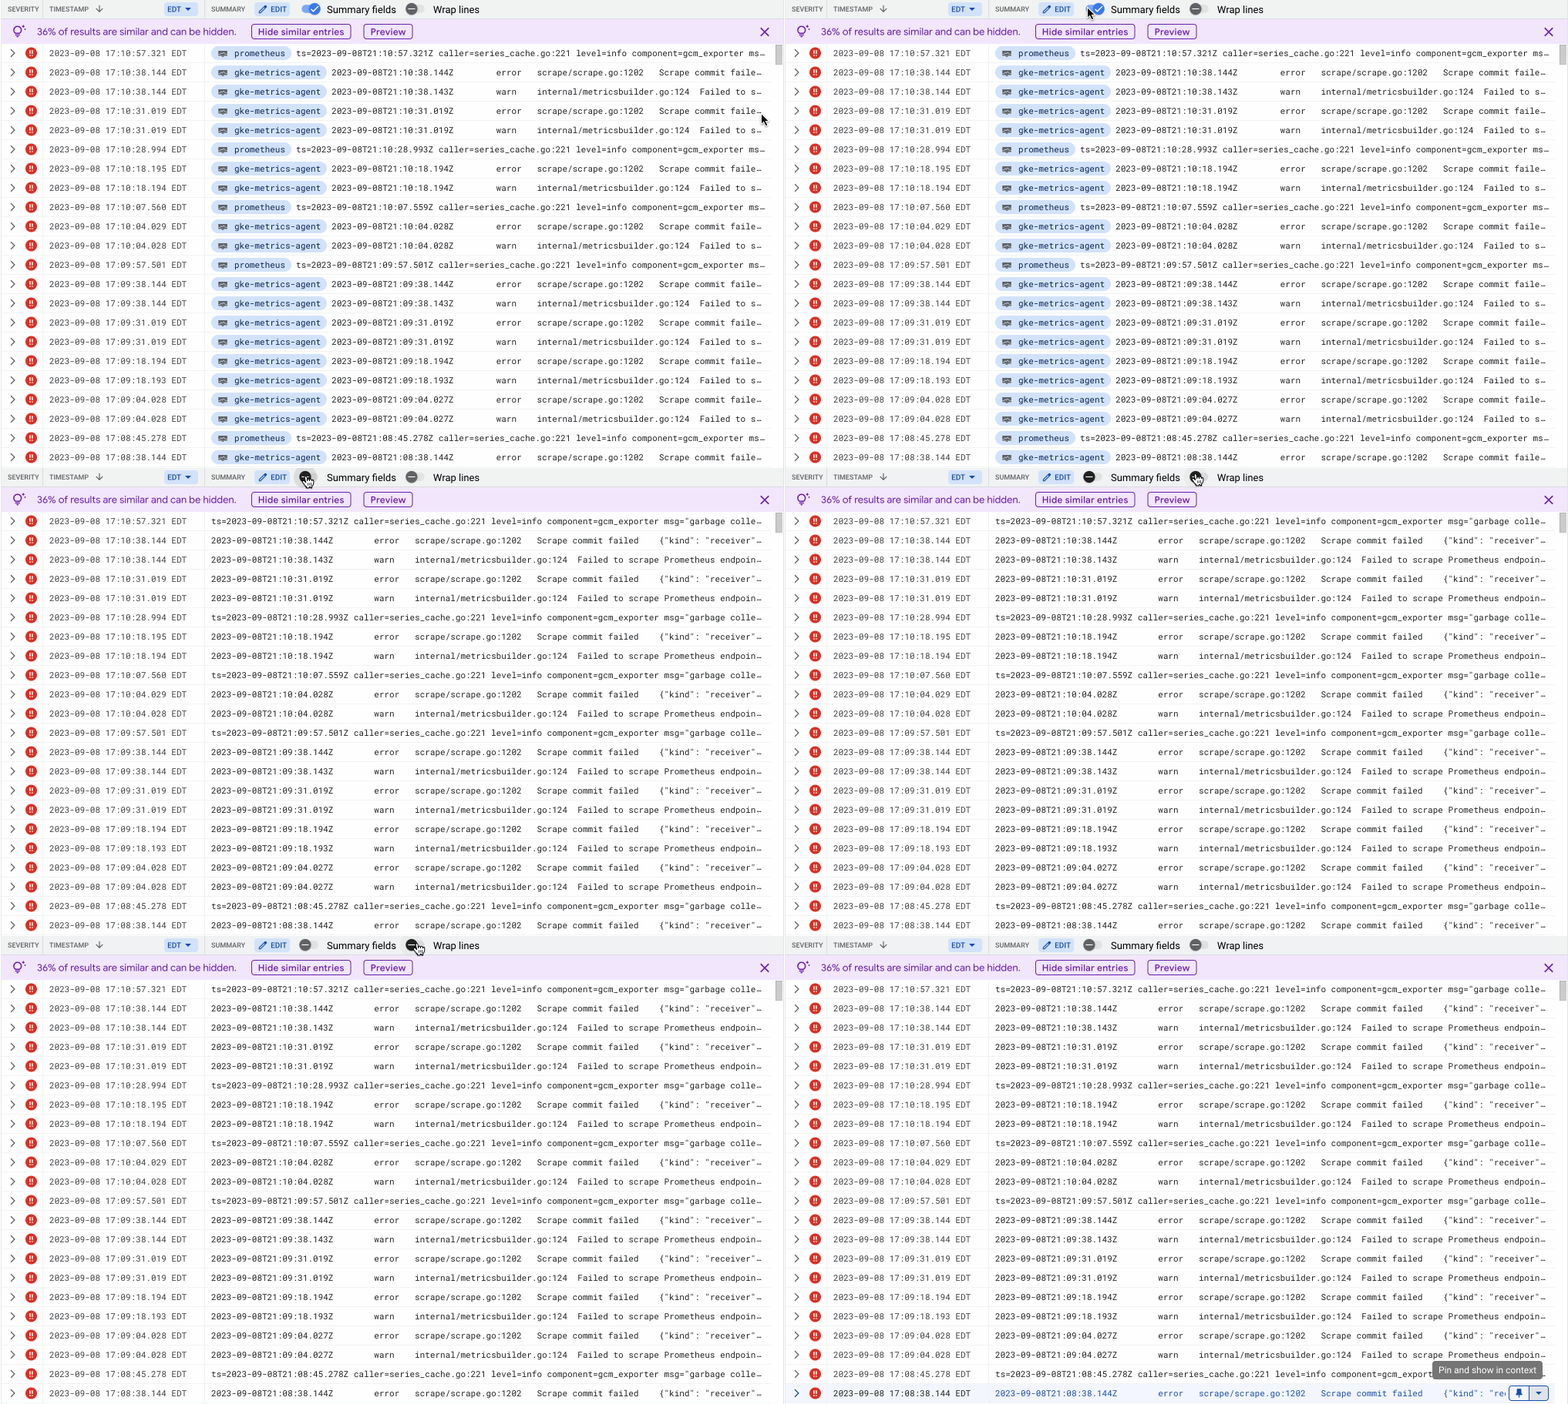

Summary fields toggled on – the default summary fields are displayed. Any of your custom summary fields also will appear.
Summary fields toggled off – the default summary fields are hidden and the list of logs is a basic text view. Any of your custom summary fields will still appear.
Wrap lines toggled off – each log entry is truncated, but only takes up a single line.
Wrap lines toggled on – each log entry is wrapped so that you can see the full summary of the log entry without truncation.
There are so many different ways to troubleshoot and unique preferences for which information to see at which phase of the troubleshooting process. Now, you can decide when you want to see a text view or a view enhanced with summary chips OR when you want the log lines to wrap on the screen or not. The choice is yours!
What’s next
These new features in Cloud Logging can help you find the critical logs even faster. But we’re not stopping there. In our next post, we’ll highlight other recent improvements to Error Reporting and how that helps GKE users. In the meantime, if you haven’t tried Logs Explorer, you can get started today.

