Ten ways troubleshooting GKE apps is now easier in Cloud Logging, part 1
Charles Baer
Product Manager, Google Cloud
At Google Cloud, we know that developer time is precious. That’s why we’re always looking for ways to improve productivity. We’d like to share ten new features that we launched in Cloud Logging so that you can more quickly get to the logs that matter and resolve issues more quickly.
Improved logs display for Google Kubernetes Engine (GKE) in the Cloud Console – improved display and log filtering in the GKE section of the Cloud Console
Pivot around a log entry – easily find related logs by pinning a log entry
Filter severity updates – more easily filter by severity and above to find error logs
Histogram filtering – use the histogram to easily filter logs
Hide/Show similar log entries – reduce noise by hiding logs
New date/time options – new quick options to make date/time selection easier
New SEARCH function + indexes – a new built-in function to find strings in your logs that uses indexes to reduce query time
Search/highlight in log results – find values in log results
Copy/paste log improvements – better copy/paste formatting
Error Reporting updates – filter by GKE resources in Error Reporting and integration into the GKE section of the Cloud Console
In this blog post, we’ll focus on the actions that happen after an issue has been identified with an alert or dashboard. Using an example, we’ll step through the process of troubleshooting an example application and point out how the new features streamline the troubleshooting steps. Since there are too many features to cover in a single blog, we’ll talk about the first five here and the others in follow-on blog posts.
Better GKE troubleshooting, by example
Here’s an example scenario and how the new features help reduce time spent finding logs. In the scenario, there is a microservices-based ecommerce application that is deployed to GKE. Each microservice generates logs which can be used to understand the system behavior. There are intermittent errors generated in our application that have prompted a troubleshooting session to understand the root cause.
First up, let’s take a look at the service in GKE. In GKE, metrics and logs are integrated into the workload and cluster pages via the observability and logs tabs. You can find your infrastructure metrics and application logs right from GKE! The screenshot below shows the error logs for the frontend service.
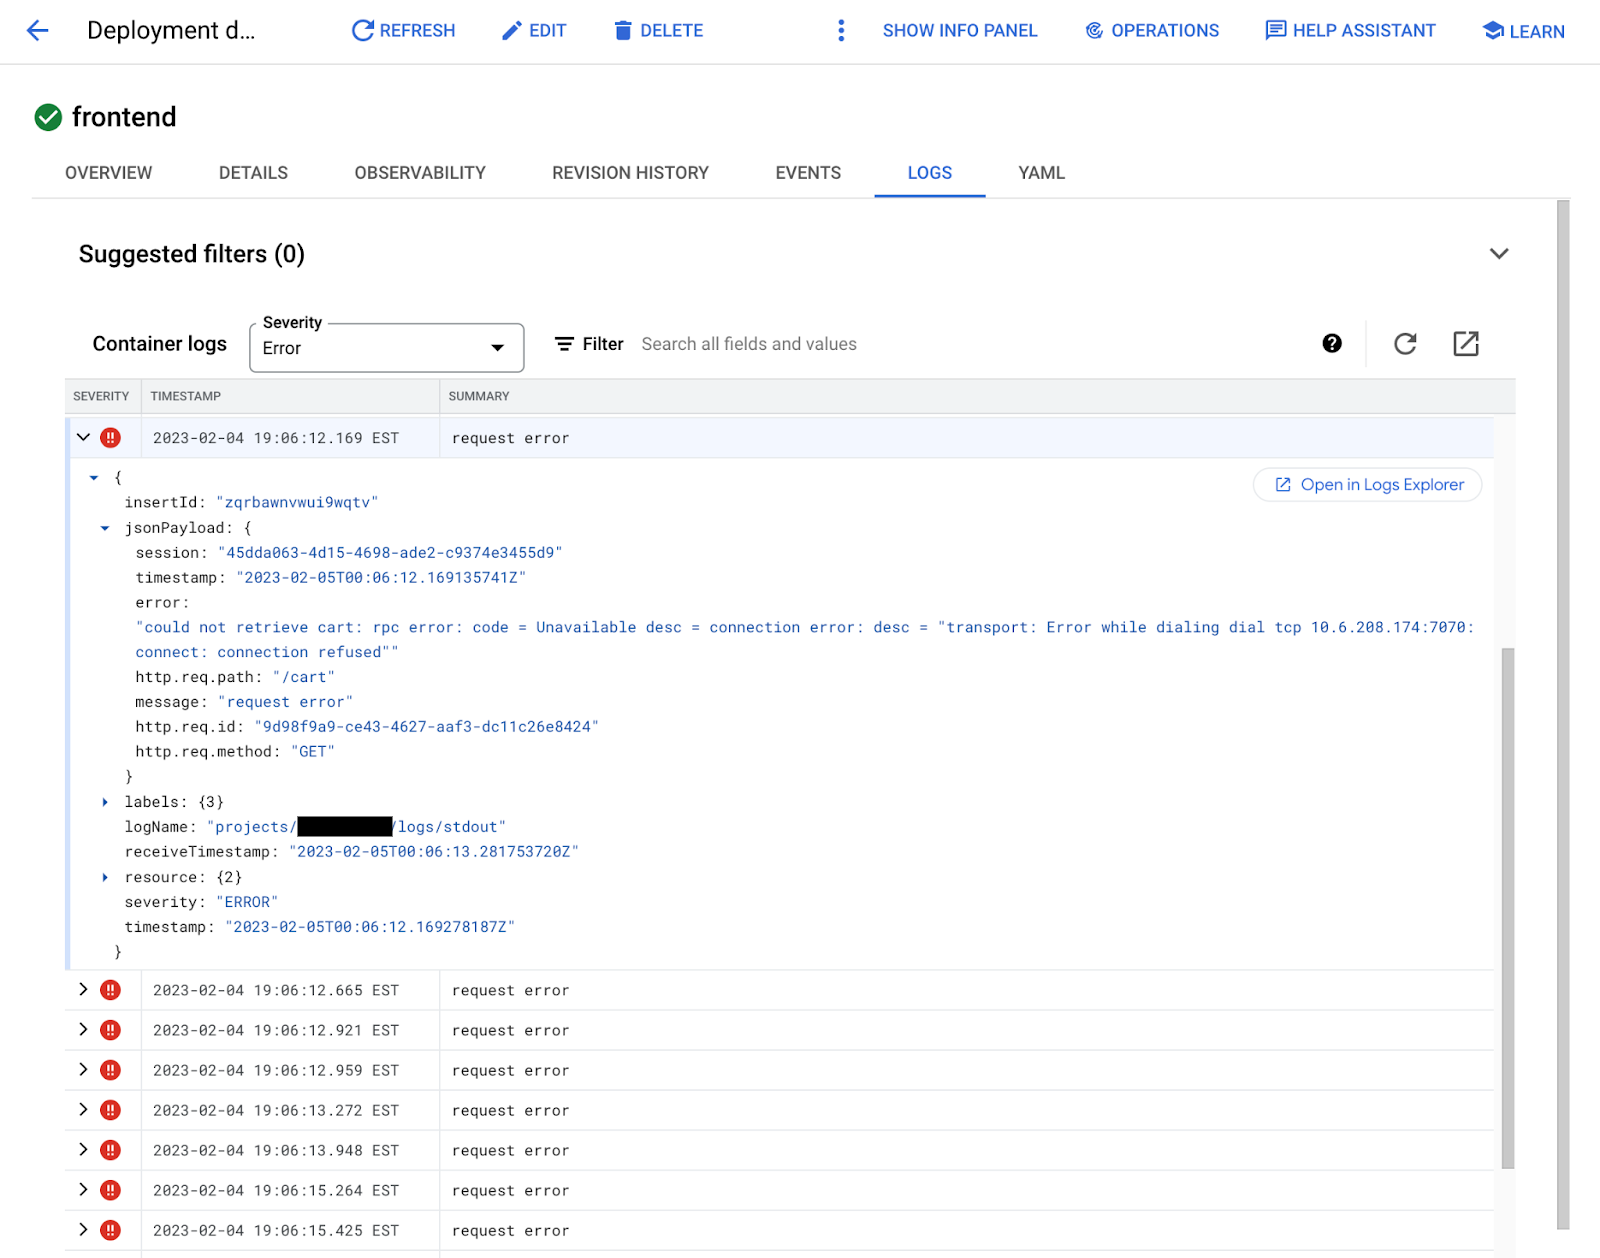

1. A new look for the GKE logs tab
With this latest launch, when the logs are expanded, you can see the full JSON structure and all the log fields which can help you quickly see the details of the errors. Basic filtering by severity and text search helps to narrow to specific logs. When you need more filtering capabilities and a histogram, there is a link to open Logs Explorer with a fully qualified search for the container logs.
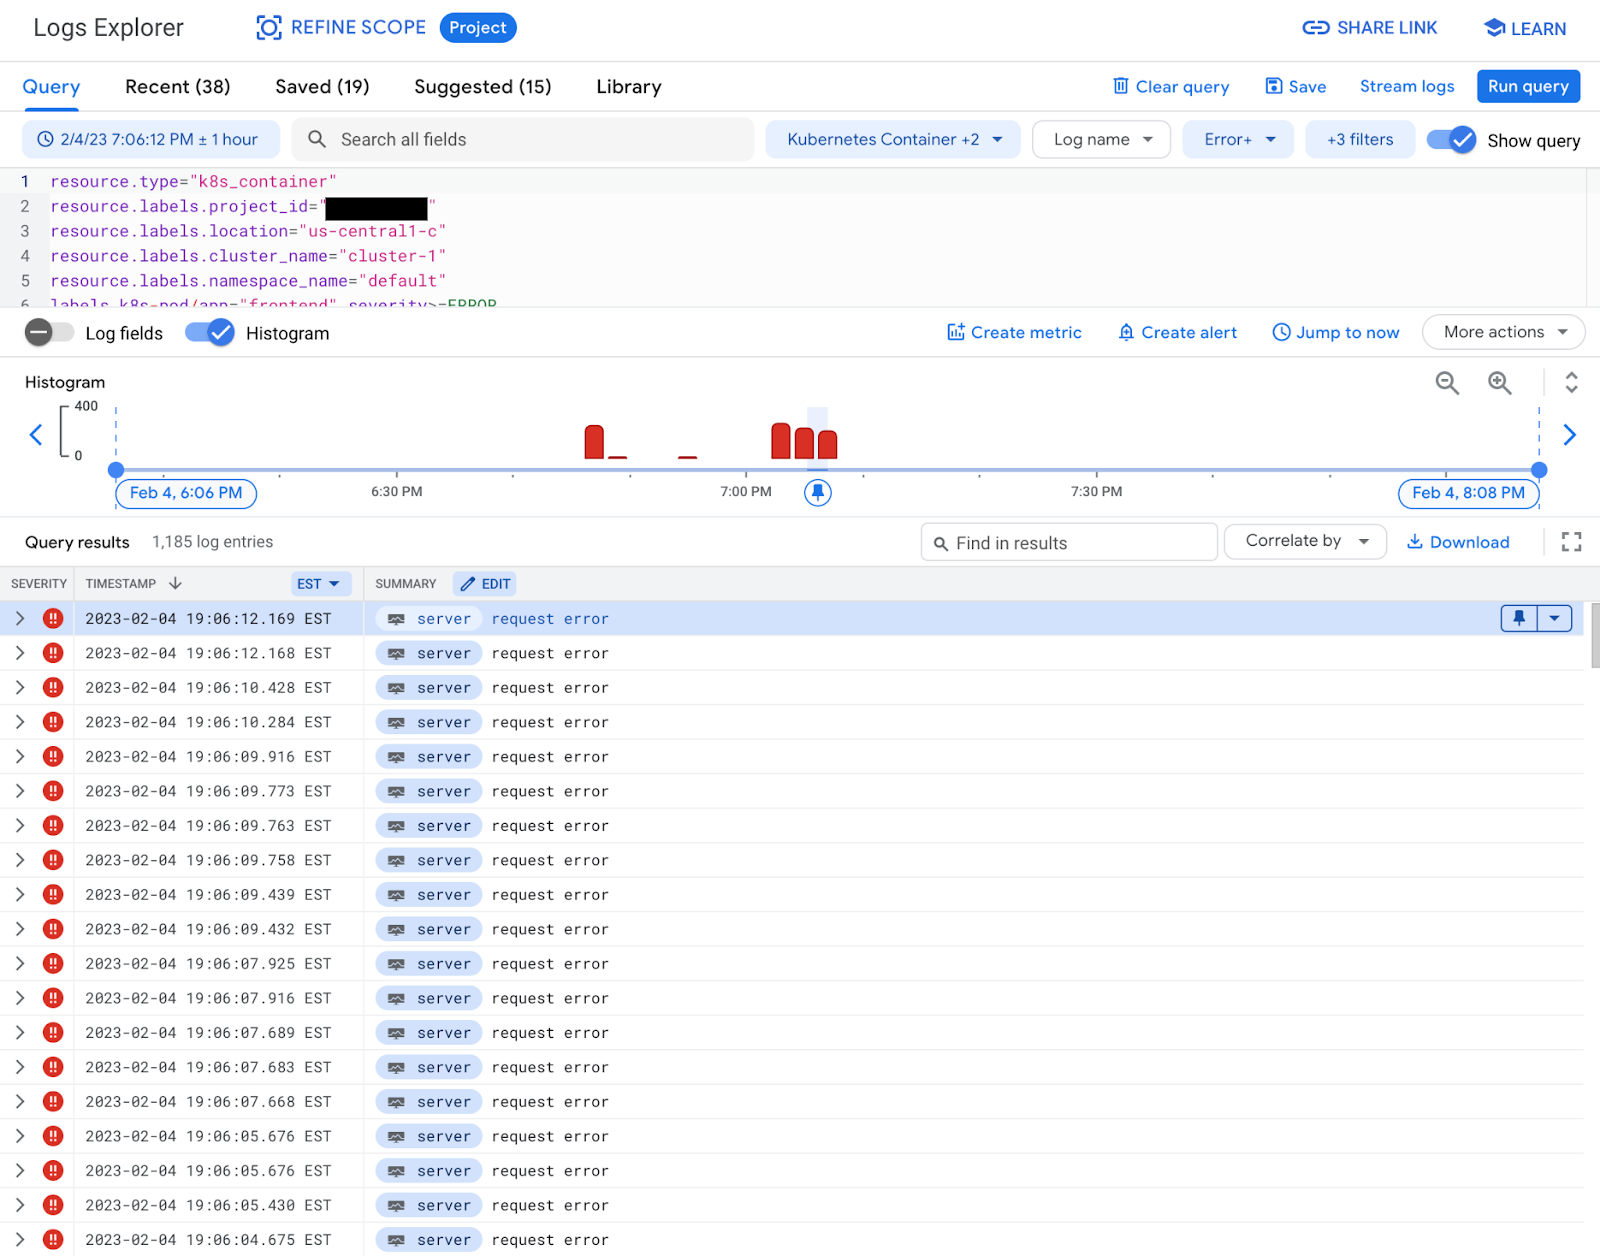

A key part of troubleshooting is often finding a specific log of interest and then looking for the context around that log. Pivoting around a log entry can help to better understand the context of the logs. For example, looking at the full set of logs for a specific request that generated an error can help better understand the system behavior.
2. Pivot around a log entry
Under the dropdown next to the pin icon on each log entry, there are now two options to find related logs for a specific log:
Same resource.type – shows all the logs in the same resource type, k8s_container in this example
Same resource.labels – shows all the logs generated by the same resource, the frontend container in this example
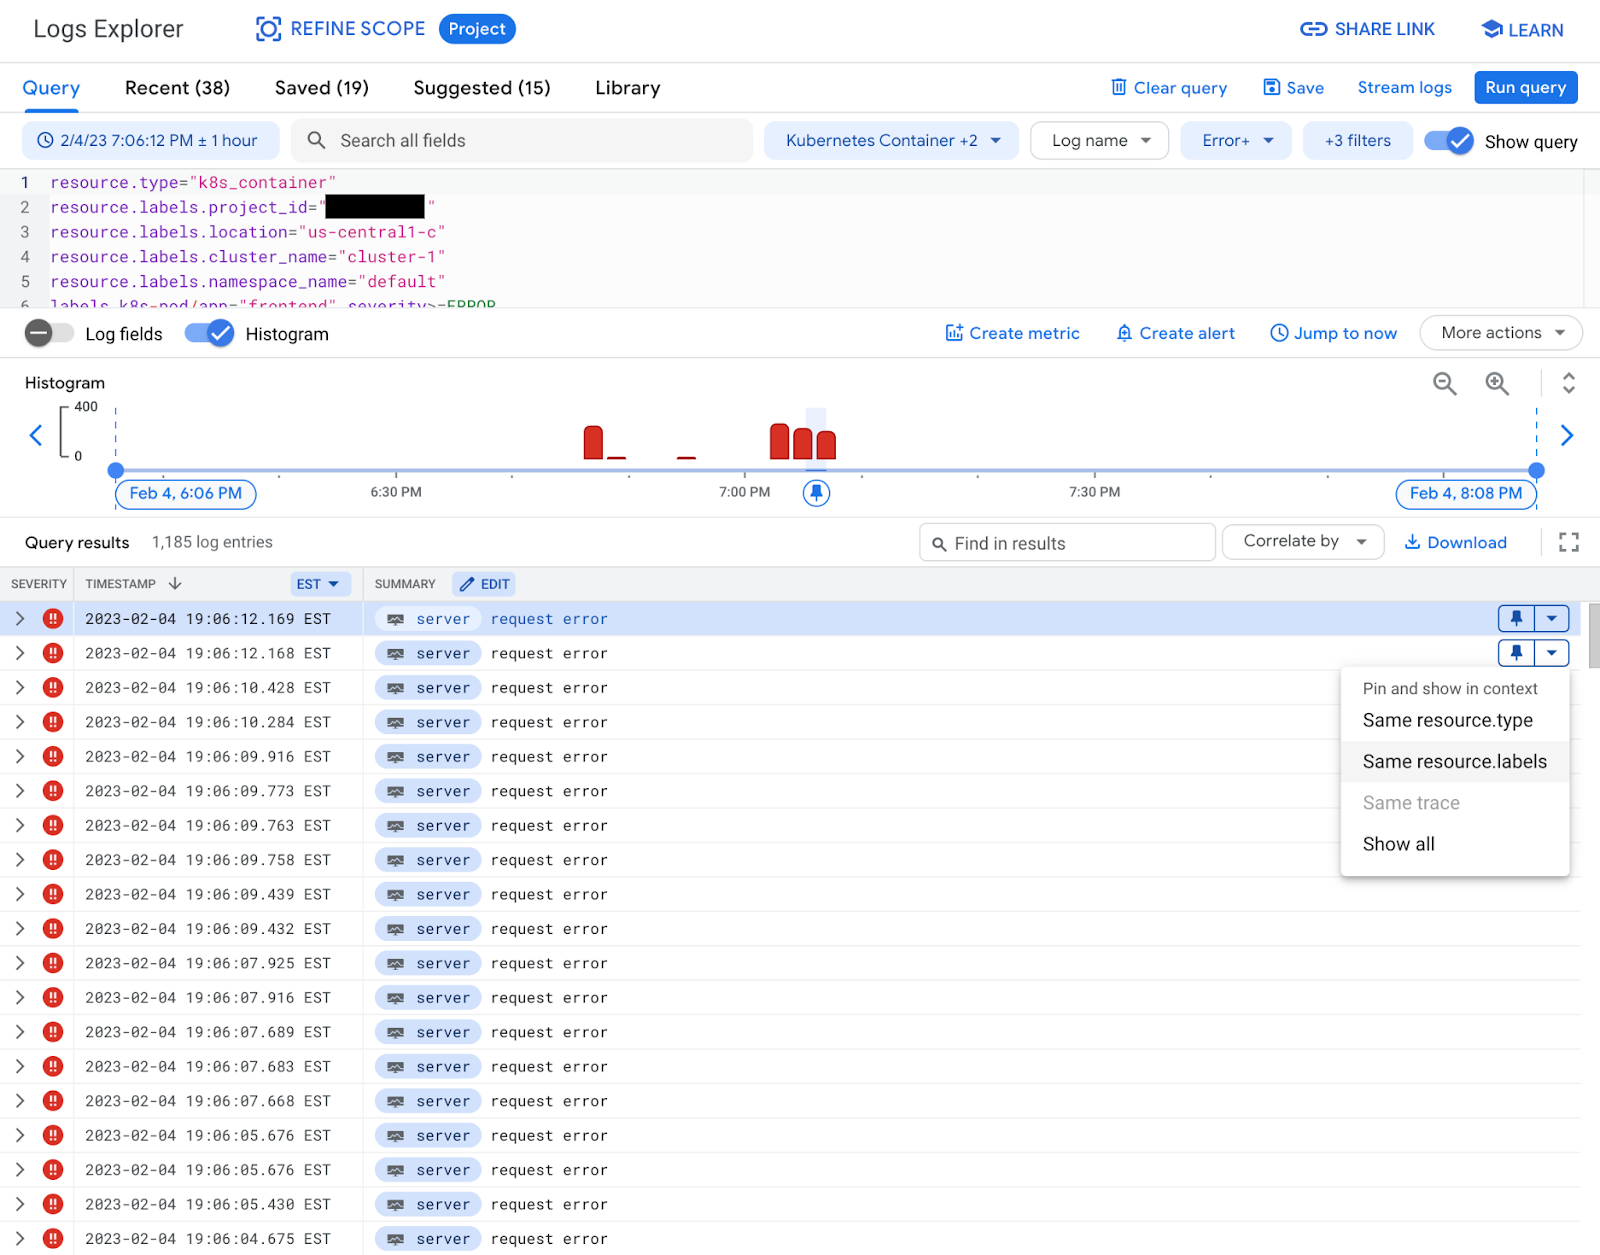

In the example, using the “Same resource.labels” shows the error logs in the context of all the logs generated by the container. The specific log entry is also pinned, which means that the pinned log entry will stay at the top of the list of logs for easy comparison to other log entries. Now, it’s easy to see that while there are errors, there are also many successful requests and now the details of each request are easy to see.
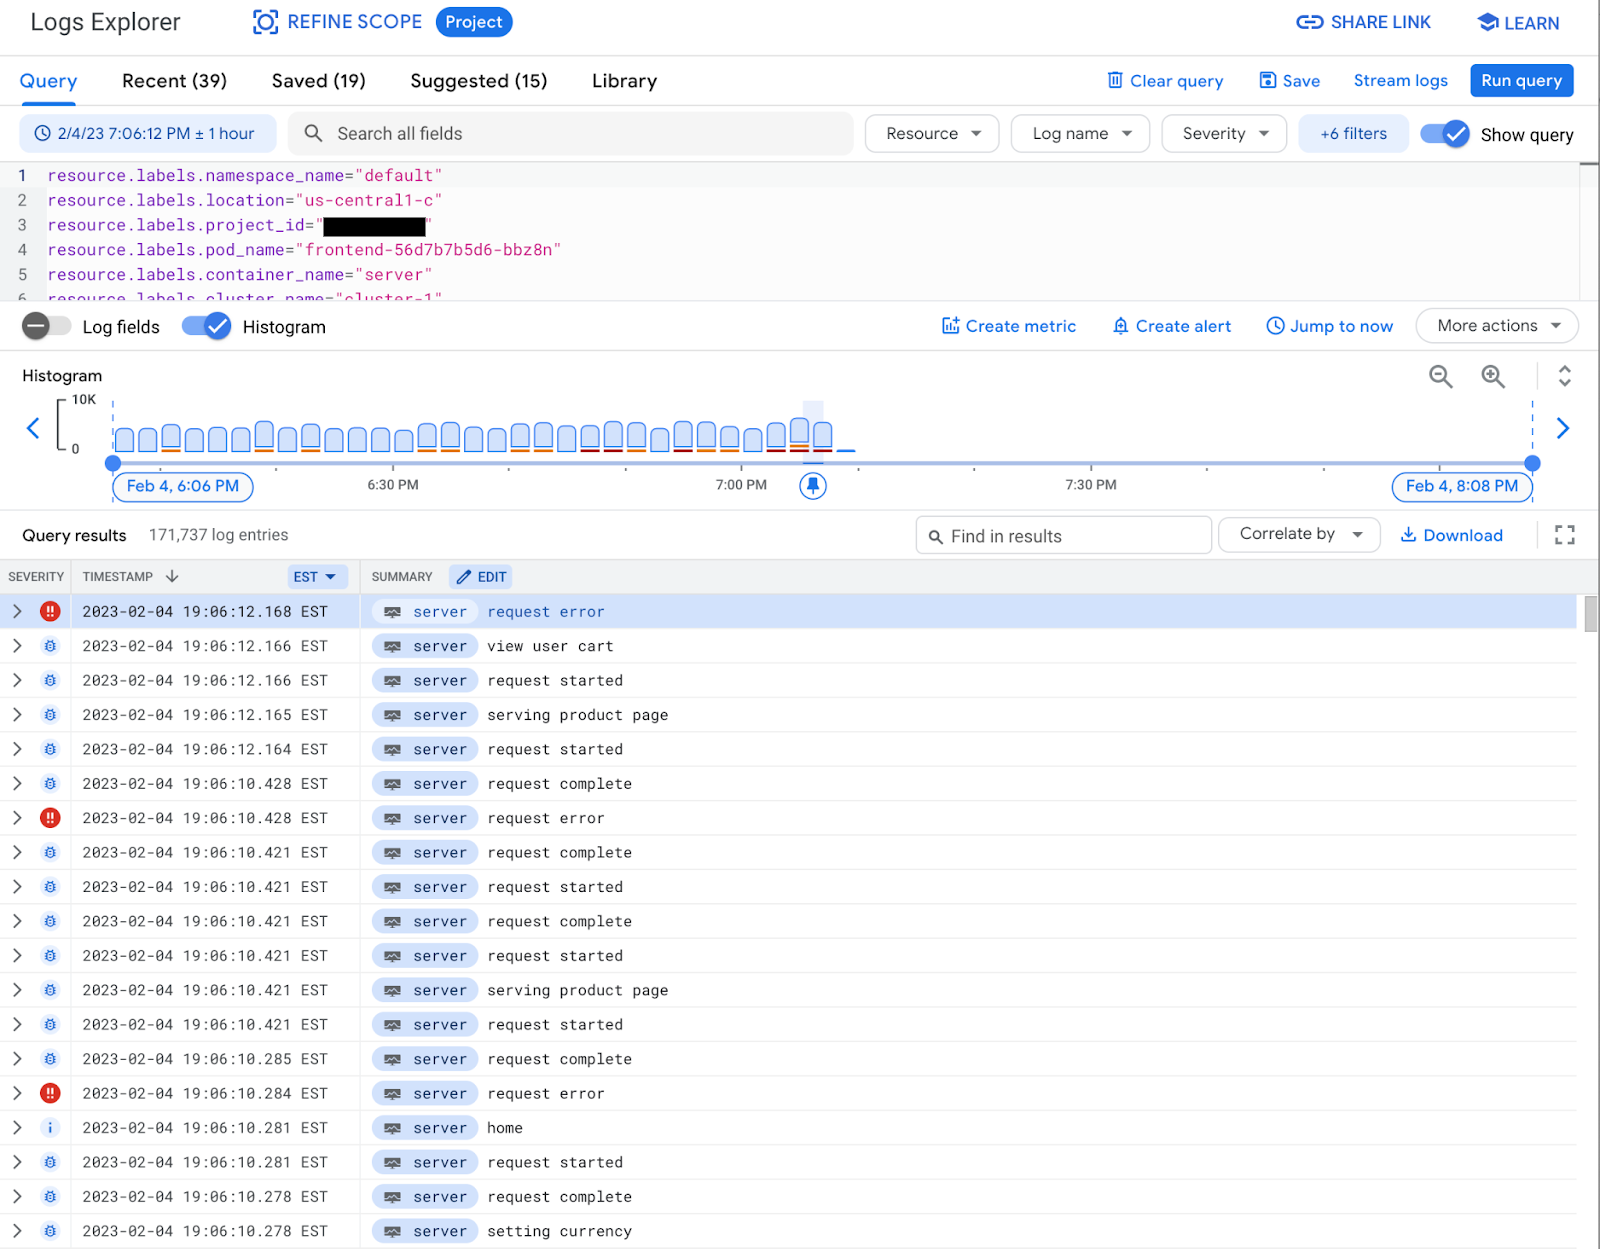

Severity is a key attribute in logs and sometimes it’s useful to filter in or out logs based on their severity. With this recent change, the severity selector can be used to filter out debug logs or even show logs with error and higher severity.
3. Filter by severity from log line
In our example, using the “Hide debug entries” hides all of the logs after they’ve already provided the necessary context.
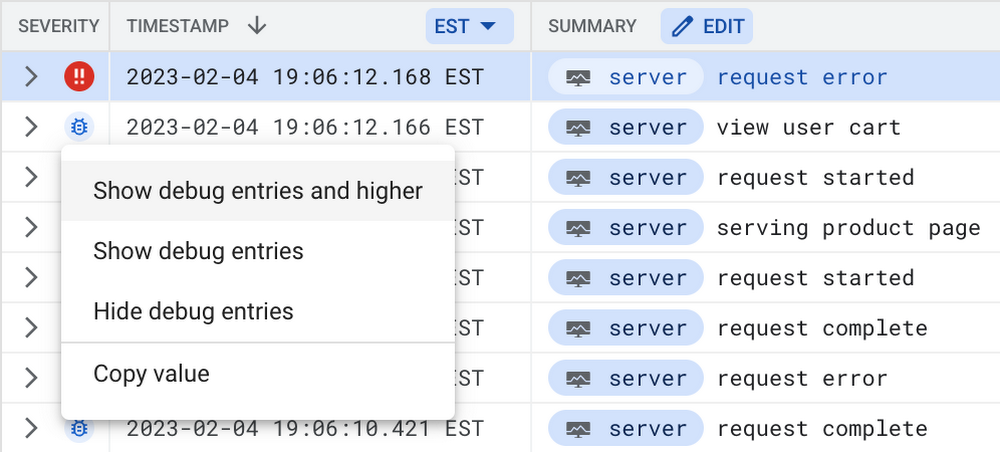

This same feature is also now available in the severity dropdown.
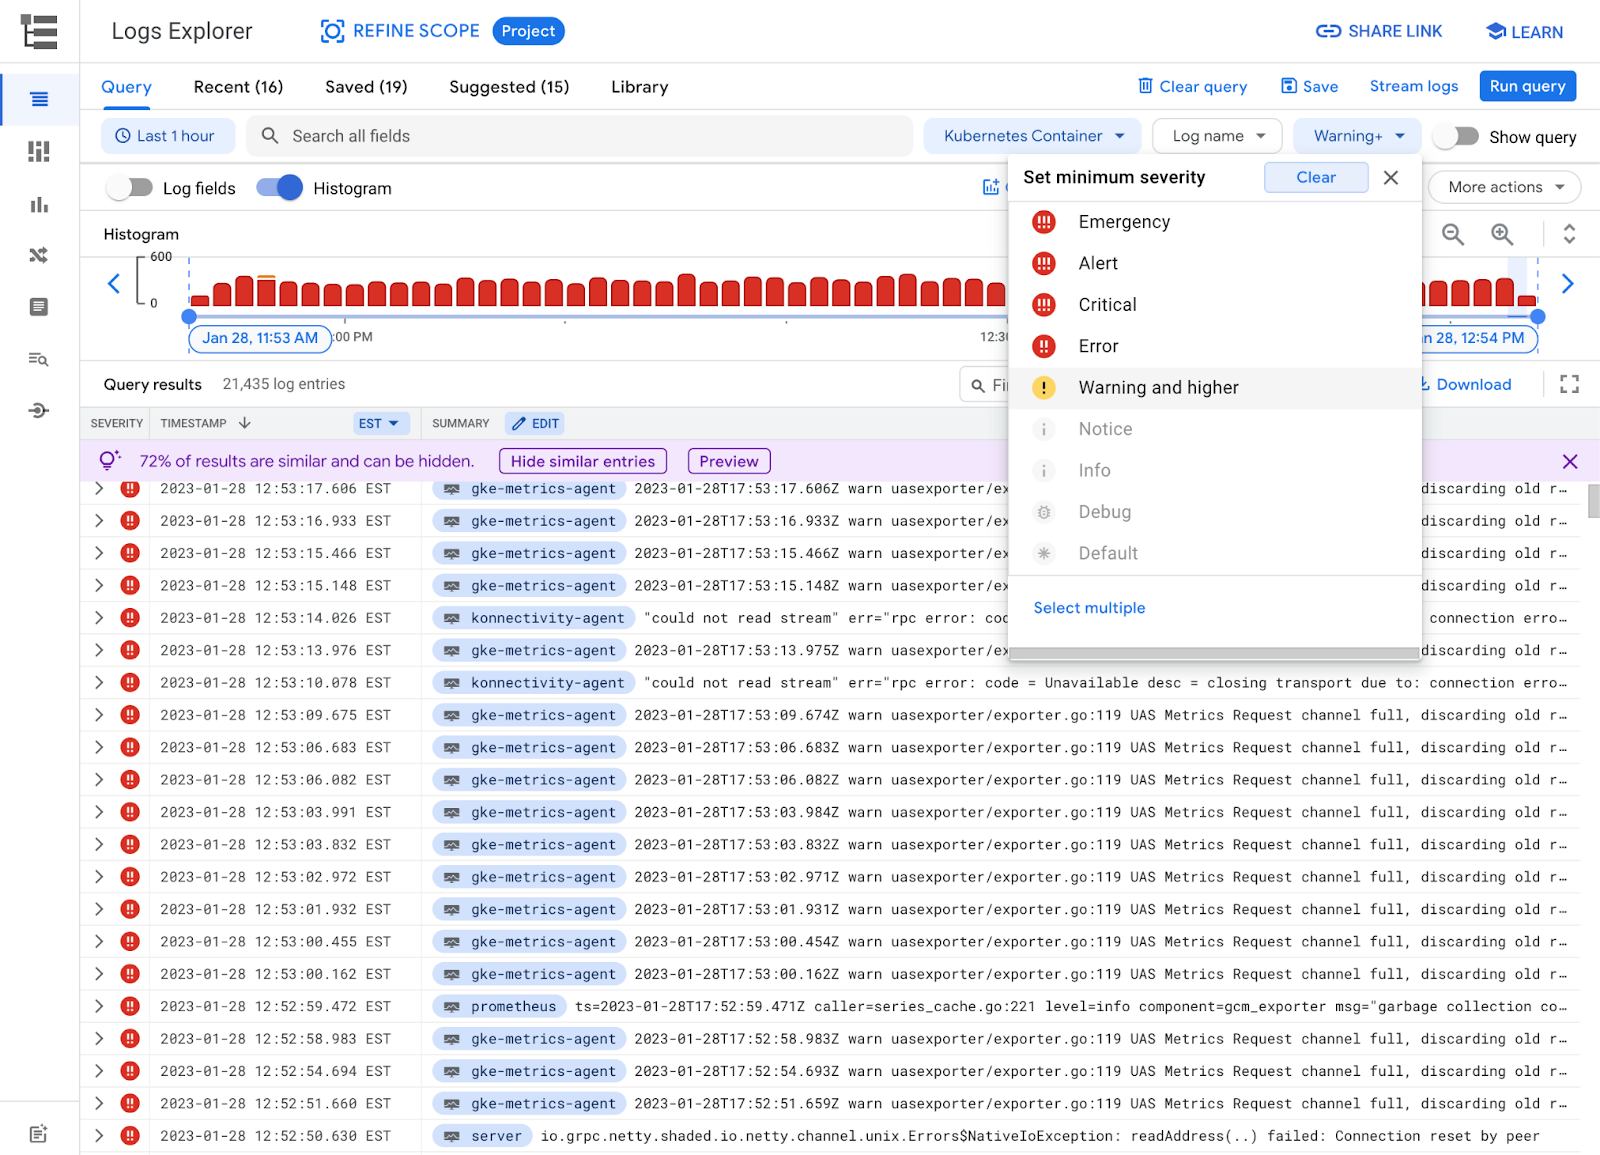

One key challenge in troubleshooting is finding the signal amidst the noise. Now, with the “Hide similar entries” feature, Cloud Logging gets rid of the noise for you.
4. Hide similar logs
In the example, the “Hide similar entries” is displayed using a purple row in the log results, which includes an option to filter out the noisy logs. Selecting “Hide similar entries” applies the right filter to your query to remove the logs. Using the Preview option, the specific details about the query and the sample logs are displayed.
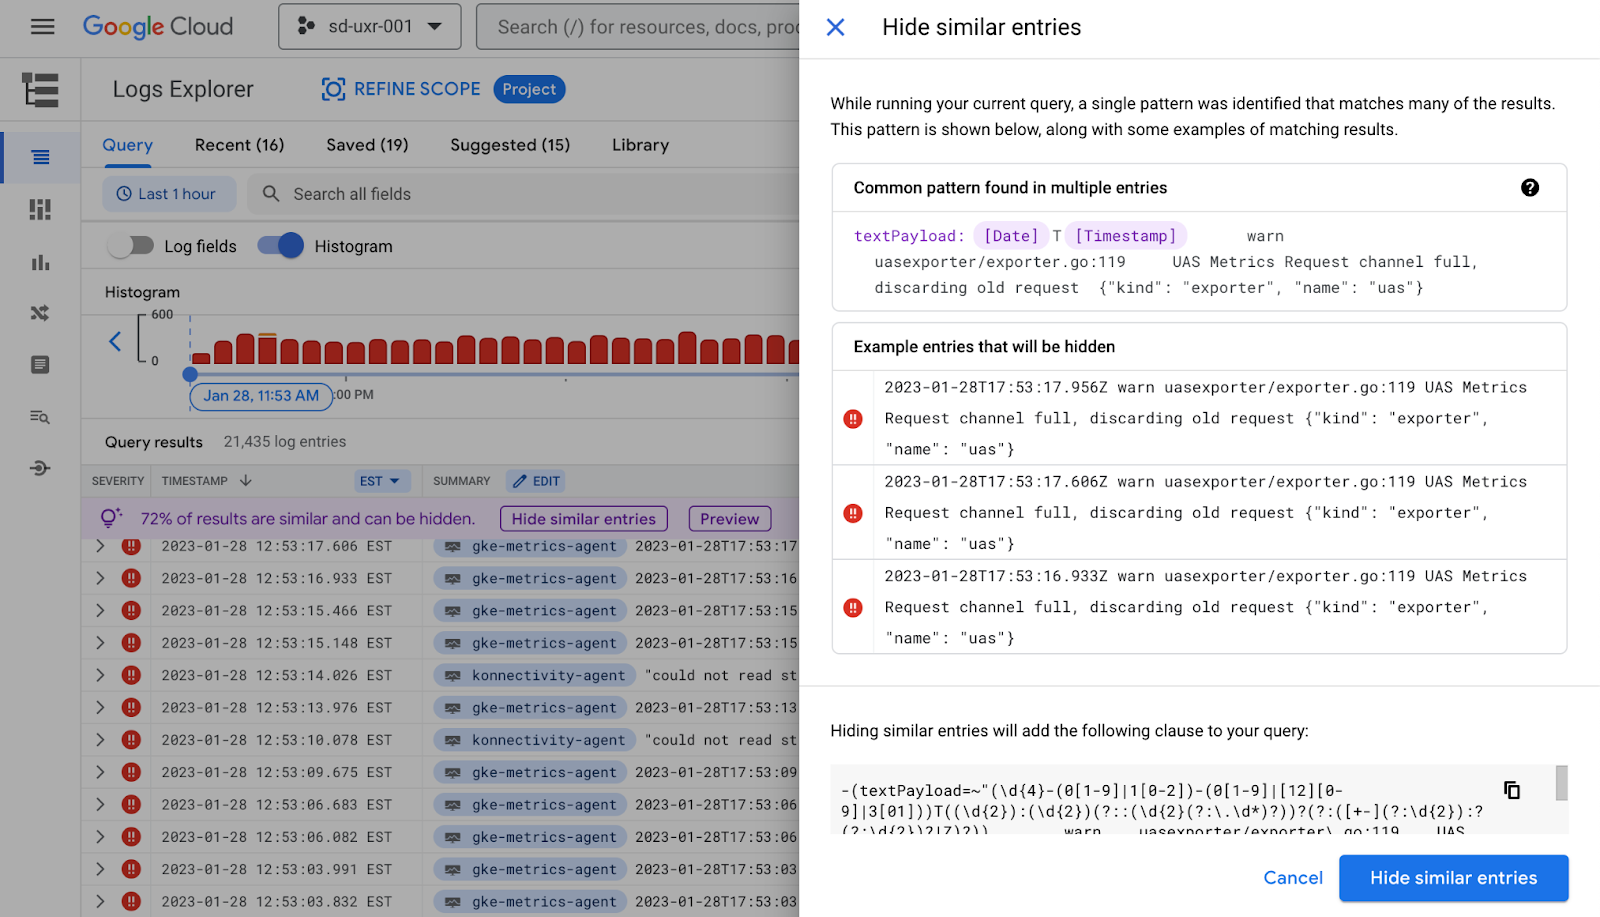

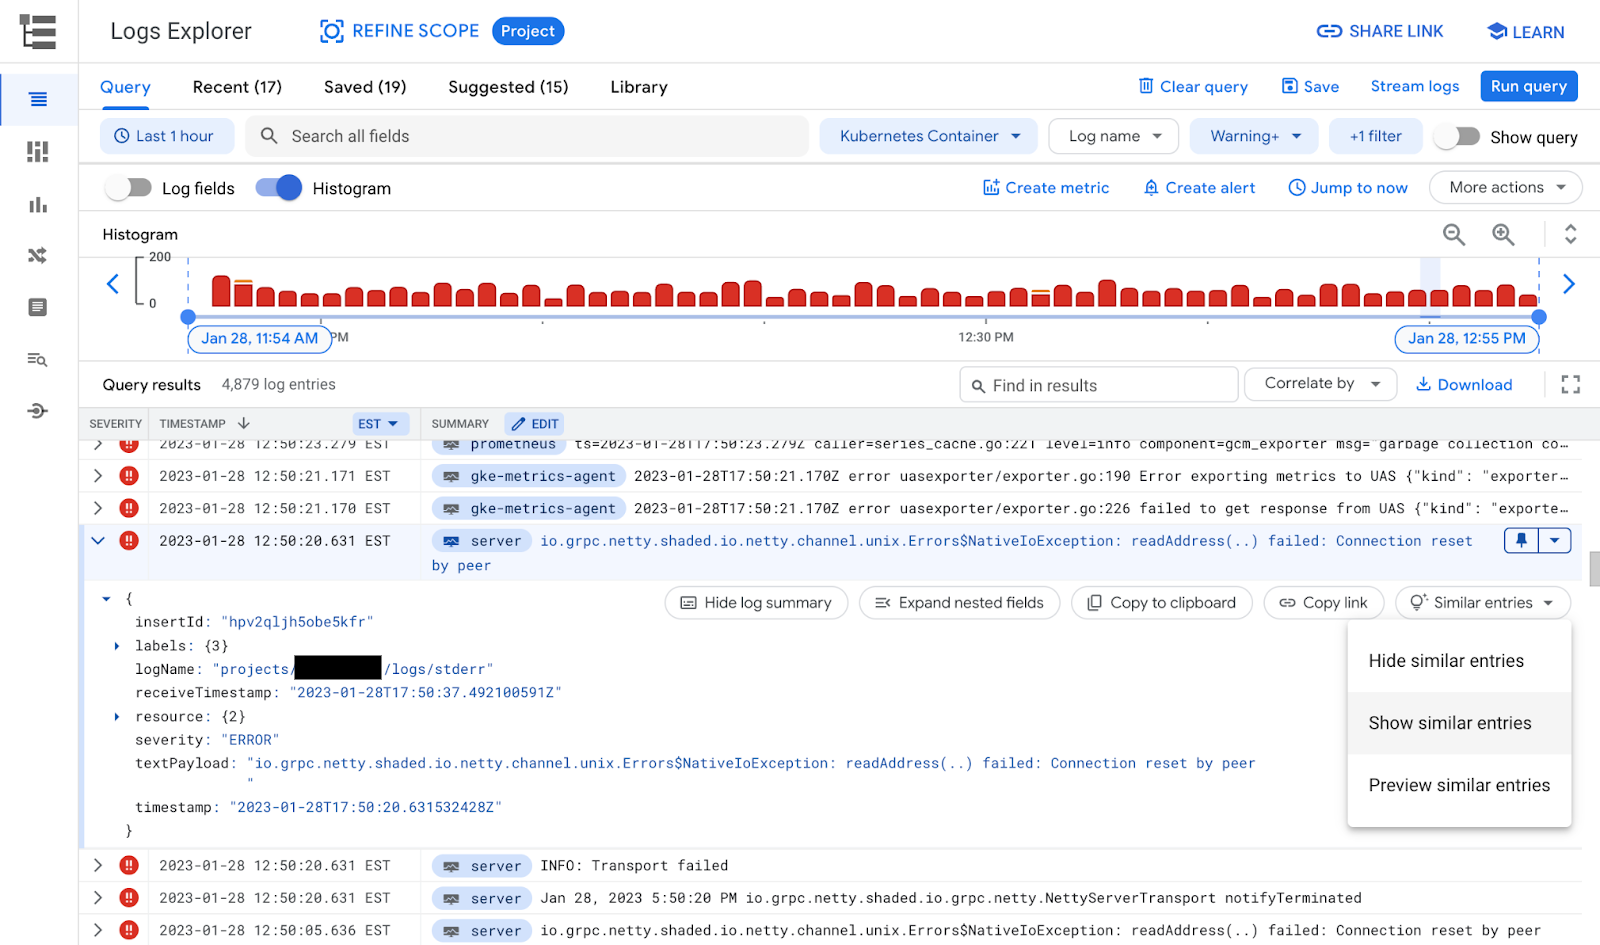
The same ability to filter is also available in each log entry. With this recent launch, you can now Hide, Show or Preview similar log entries to help filter out noisy logs by adding a query filter.

Understanding the frequency of an error or event in the logs is an important aspect of troubleshooting. The histogram in the Logs Explorer provides several simple ways to help navigate to the important logs.
5. Using the histogram to filter logs
Expand histogram – when you need to dig into the frequency, expand the histogram to make it larger
Synchronized scrolling – as you scroll through the logs, the histogram shows the corresponding time window on the histogram
Zoom in/out – the zoom in/out expands or decreases the time range of the logs
Scroll/zoom to time – query or scroll to the logs for a specific time range
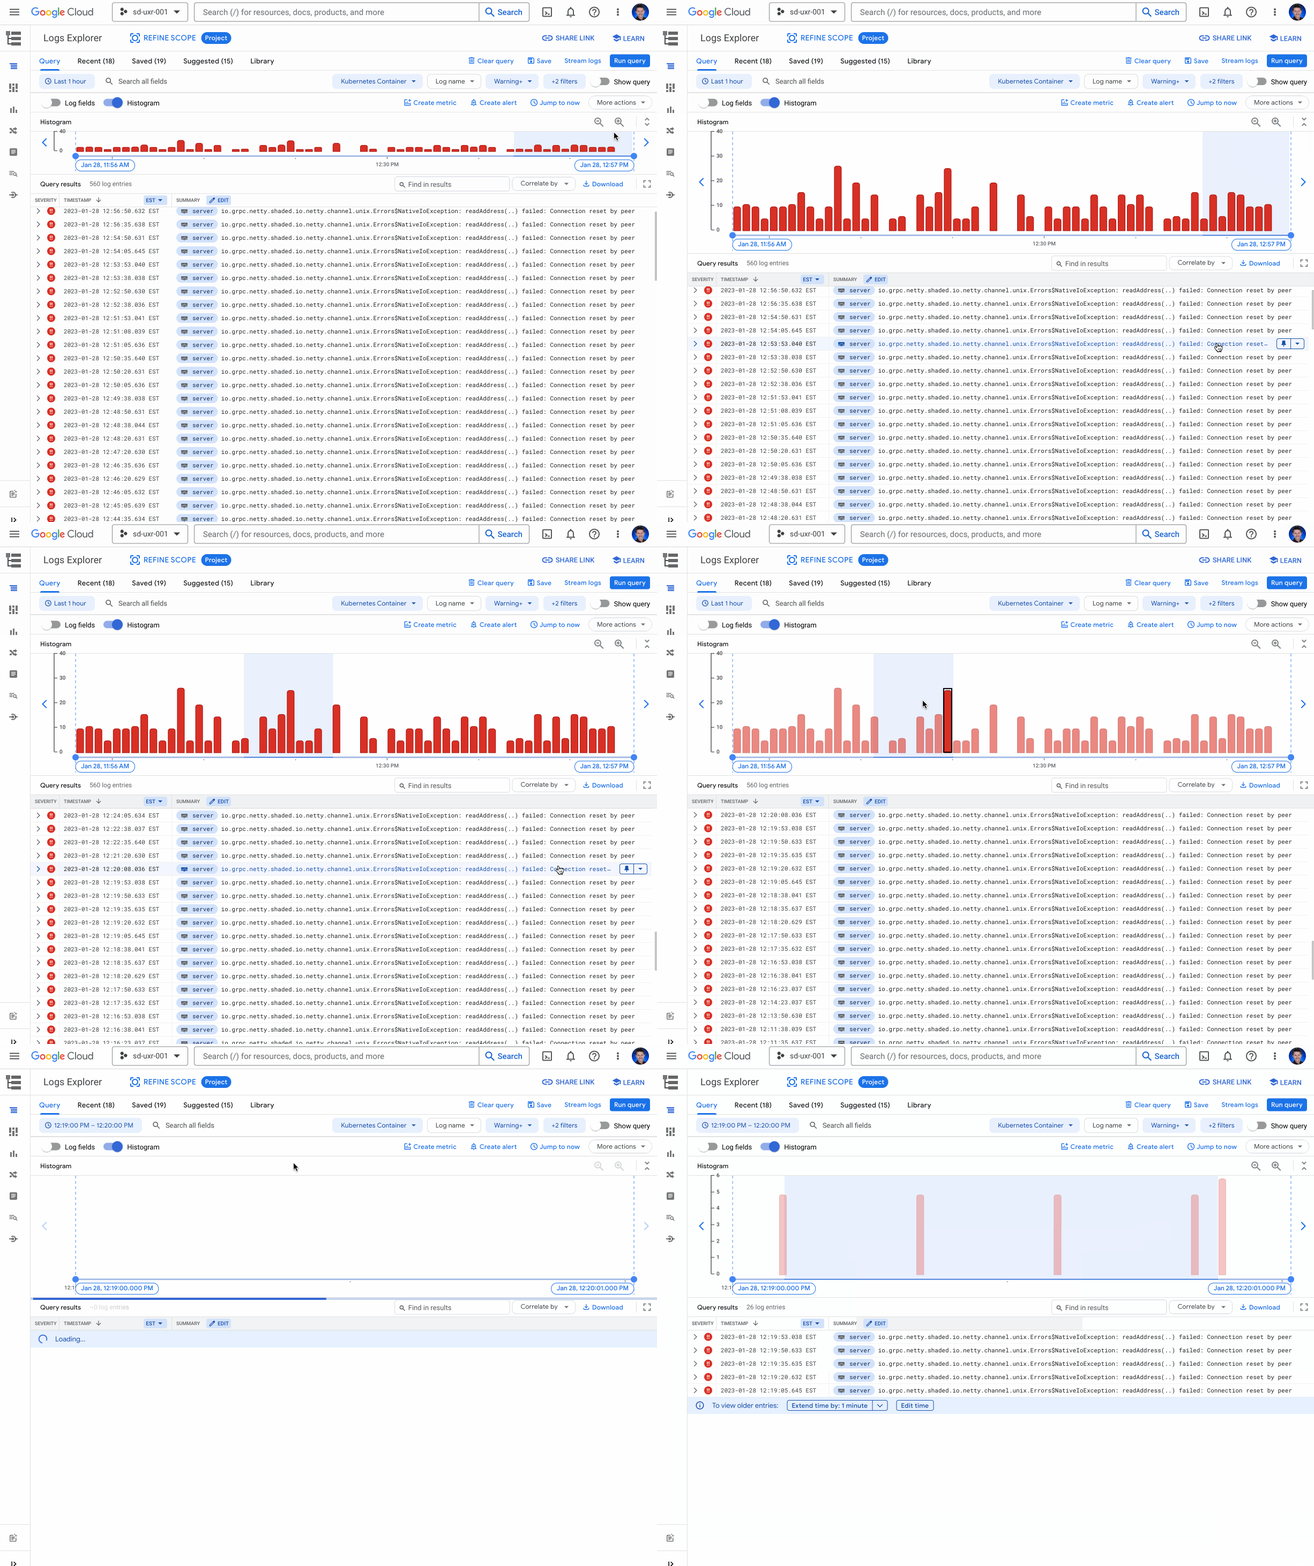

In the example, narrowing the time range to focus on the logs around a spike in error logs helps narrow down the logs to a specific configuration issue. With this context, enough information is available to update the configuration and resolve the issue.
What’s next
These new features in Cloud Logging can help you find the critical logs even faster. But we’re not stopping there. This is the first post in a series about the new features specifically designed by developers for developer troubleshooting in Cloud Ops. In our second post in this series, we’ll highlight other recent improvements to Logging and Error Reporting. In the meantime, if you haven’t tried Logs Explorer, you can get started today.
