Profiling Kubernetes init time: Google Cloud Performance Atlas
Colt McAnlis
Developer Advocate
Kubernetes offers an excellent set of features for container orchestration and deployment, which lends itself to creating extremely fast boot times for new instances. That being said, this fast boot time can often be lost in production if your containers do a lot of work during the initialization phase.
To achieve container boot-time harmony, it’s important to properly profile and understand how long your containers take to initialize. In practice, that process can be a bit troublesome, so here are a few tips and tricks to help you quickly track down that data.
Too busy to read? Check out the video summary on Youtube!!
Understanding pods and containers
A Kubernetes pod is made up of a series of containers, which provide endpoints and services for the instance itself. The pod is considered “ready” once all the containers have been initialized, and the health checks pass. To help facilitate proper bootup, the initialization process breaks up containers into two main groups:- Init containers, which execute in a serial order, as defined by the setup scripts
- Parallel containers, which are executed in random parallel order.


This design has some interesting quirks and can sometimes be problematic. For instance, if a single init container takes a long time to boot up, it blocks the initialization of all the containers that follow. As such, it’s critical to understand the performance of both types of containers, as it may have a serious impact on your pod boot performance.
Timing init containers
Currently, init containers do not emit detailed information about how long it took them to initialize in the pod boot phase. As such, you must do any boot-phase analysis manually using the get pod command:This command returns the pod status, and if you have init containers defined, the status of the init containers (in the STATUS field). For example, a status of “Init:1/2" indicates that one of two init containers has completed successfully:
To determine how long each container takes to initialize, we can successively poll the get pod command about every 10 ms or so, parse the output, and compute the timing delta between when the status value changes. Below is a graph that shows off a small prototype consisting of four init containers which the above function was called on repeatedly:
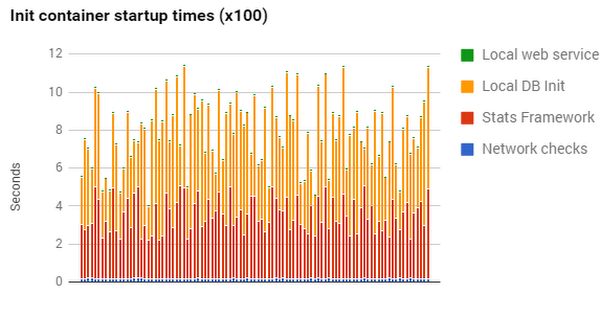

In the image above, you can clearly see that the stats-gathering container (Stats Framework) and the DB initialization (Local DB Init) containers are taking the most time to get off to the races. Since these are initialization containers, all subsequent services are delayed about 4-12 seconds, as these stages block the initialization of other work groups.
Timing parallel containers
Timing parallel containers is much trickier, since each one can start and stop in whatever order it wants, and container-specific boot information is not emitted via logging.To get this information, we must adopt a similar method to how health checks work: For each container, expose a new entry point called “/health”, which returns the string “Success”. Repeatedly polling the endpoints for each container from an external location yields three different states:
- error - The service is not up and running yet (red bar below)
- 400 / 500 - The service is booting, but the endpoint is not available yet (yellow bar below)
- “Success”
The goal is to add a /health entry point to each container, and have a script poll each one to get boot times. We can create a chart on how long the container took to start, and how long each stage was:
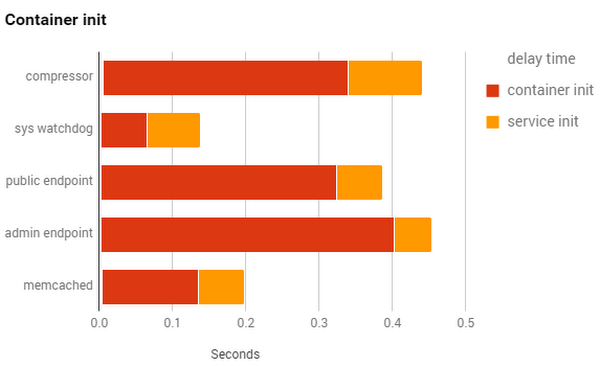

In the chart above, we can see the delay time (how long it took initialization to start for a container) as well as a break out between the time it takes for our container to initialize vs. the services in the container.
Every millisecond counts
With this in mind, here are some best practices for optimizing pod boot times:- Be mindful that init containers are in the critical path. Since the containers initialize linearly, the time spent executing one can delay the startup time of others. A single bad actor can significantly delay startup time. Consider how much work executes during the containers’ init phase vs. later on, in the parallel phase. (Note: Google Developer Advocate Kelsey Hightower has a great article on navigating this complexity.)
- Avoid parallel init dependencies. Containers that initialize in parallel are done so randomly, which can impact your pod boot time if the containers have dependencies between them. If container A needs Container B, there could be a problem if A gets initialized before B, causing A to wait an unspecified amount of time. If possible, consider moving these dependencies to the init phase, or find a way to remove the dependency completely.
If you’d like to know more about ways to optimize your Google Cloud applications, check out the rest of the Google Cloud Performance Atlas blog posts and videos. Because when it comes to performance, every millisecond counts.


