Gain visibility and take control of Stackdriver costs with new metrics and tools
Mary Koes
Product Manager, Google Cloud
Summit Tuladhar
Software Engineer
A few months back, we announced new simplified Stackdriver pricing that will go into effect on June 30. We’re excited to bring this change to our users. To streamline this change, you’ll receive advanced notifications and alerting on the performance and diagnostics data you track for cloud applications, plus flexibility in creating dashboards, without having to opt in to the premium pricing tier.
We’ve added new metrics and views to help you understand your Stackdriver usage now as you prepare for the new pricing to take effect. We’ve got some tips to help you maximize value while minimizing costs for your monitoring, logging and application performance management (APM) solutions.
Getting visibility into your monitoring and logging usage
In anticipation of the pricing changes, we’ve added new metrics to make it easier than ever to understand your logs and metrics volume. There are three different ways to view your usage, depending on which tool you prefer: the billing console; updated summary pages in the Stackdriver console; or metrics available via the API and Metrics Explorer.
1. Analyzing Stackdriver costs using the billing console
Stackdriver is now reporting logging and monitoring usage on the new SKUs (fancy name for something you can buy—in this case, volume of metrics or logs), which are visible in the billing console. Don’t worry—until June 30, the costs will still be $0, but you can view your existing volume across your billing account by going to the new reports page in the billing console. To view your current Stackdriver logging and monitoring usage volume, select group by SKU, filter for Log Volume, Metric Volume or Monitoring API Requests, and you’ll see your usage across your billing account. (See more in our documentation). You can also analyze your usage by exporting your billing data to BigQuery. Once you understand your usage, you can easily estimate what your cost will be after June 30 using the pricing calculator under the Upcoming Model tab.
2. Analyzing Stackdriver costs using the Stackdriver console
We’ve also updated the tools for viewing and managing volumes of logs and metrics within Stackdriver itself.
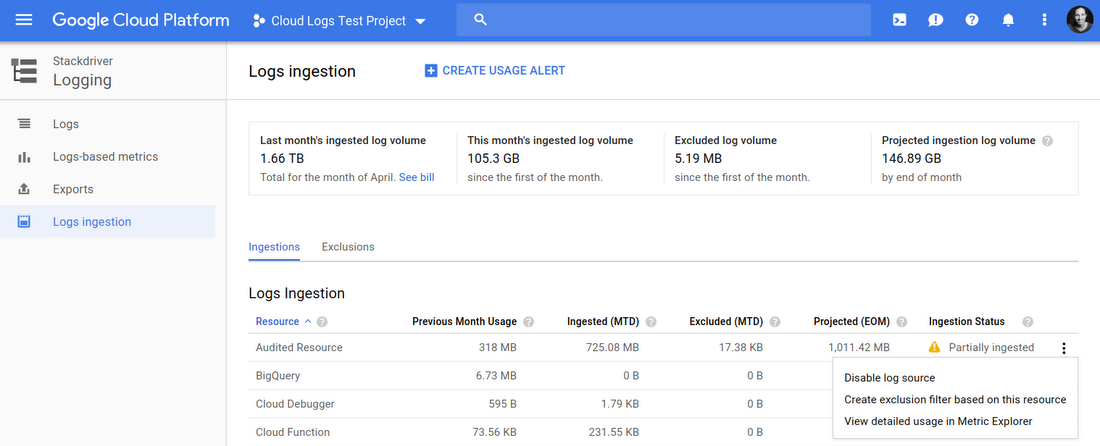

The Logs Ingestion page, above, now shows last month’s volume in addition to the current month’s volume for the project and by resource type. We’ve also added handy links to view detailed usage in Metrics Explorer right from this page as well.
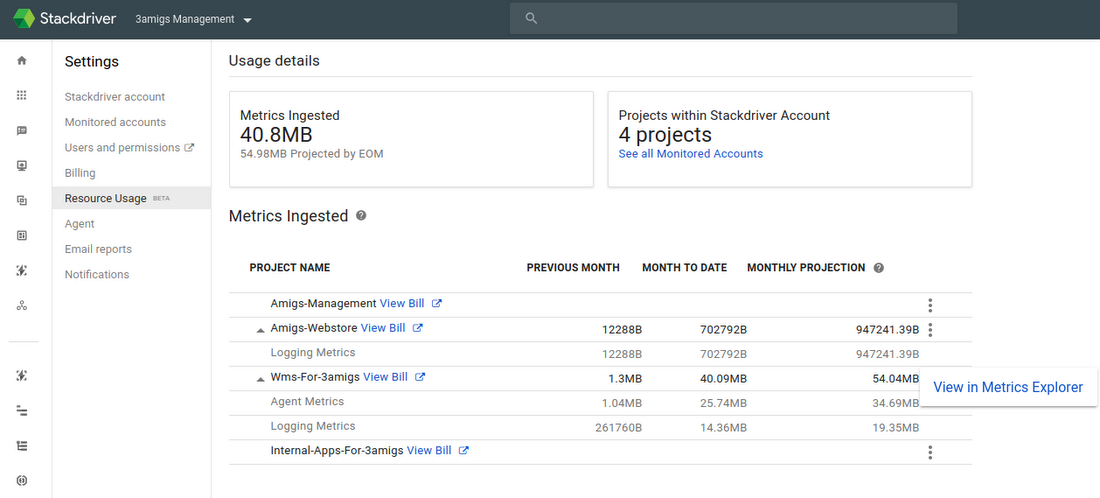

The Monitoring Resource Usage page, above, now shows your metrics volume month-to-date vs. the last calendar month (note that these metrics are brand-new, so they will take some time to populate). All projects in your Stackdriver account are broken out individually. We’ve also added the capability to see your projected total for the month and added links to see the details in Metrics Explorer.
3. Analyzing Stackdriver costs using the API and Metrics Explorer
If you’d like to understand which logs or metrics are costing the most, you’re in luck—we now have even better tools for viewing, analyzing and alerting on metrics. For Stackdriver Logging, we’ve added two new metrics:
- logging.googleapis.com/billing/bytes_ingested provides real-time incremental delta values that can be used to calculate your rates of log volume ingestion. It does not cover excluded logs volume. This metric provides a resource_type label to analyze log volume by various monitored resource types that are sending logs.
- logging.googleapis.com/billing/monthly_bytes_ingested provides your usage as a month-to-date sum every 30 minutes and resets to zero every month. This can be useful for alerting on month-to-date log volume so that you can create or update exclusions as needed.
- monitoring.googleapis.com/billing/bytes_ingested provides real-time incremental deltas that can be used to calculate your rate of metrics volume ingestion. You can drill down and group or filter by metric_domain to separate out usage for your agent, AWS, custom or logs-based metrics. You can also drill down by individual metric_type or resource_type.


If you’re interested in an even deeper analysis of your logs usage, check out this post by one of Google’s Technical Solutions Consultants that will show you how to analyze your log volume using logs-based metrics in Datalab.
Controlling your monitoring and logging costs
Our new pricing model is designed to make the same powerful log and metric analysis we use within Google accessible to everyone who wants to run reliable systems. That means you can focus on building great software, not on building logging and monitoring systems. This new model brings you a few notable benefits:
- Generous allocations for monitoring, logging and trace, so many small or medium customers can use Stackdriver on their services at no cost.
- Monitoring: All Google Cloud Platform (GCP) metrics and the first 150 MB of non-GCP metrics per month are available at no cost.
- Logging: 50 GB free per month, plus all admin activity audit logs, are available at no cost.
- Pay only for the data you want. Our pricing model is designed to put you in control.
- Monitoring: When using Stackdriver, you pay for the volume of data you send, so a metric sent once an hour costs 1/60th as much as a metric sent once a minute. You’ll want to keep that in mind when setting up your monitoring schedules. We recommend collecting key logs and metrics via agents or custom metrics for everything in production; development environments may not need the same level of visibility. For custom metrics, you can write points at a smaller time granularity. Another way is to reduce the number of time series sent by avoiding unnecessary labels for custom and logs-based metrics that may have high cardinality.
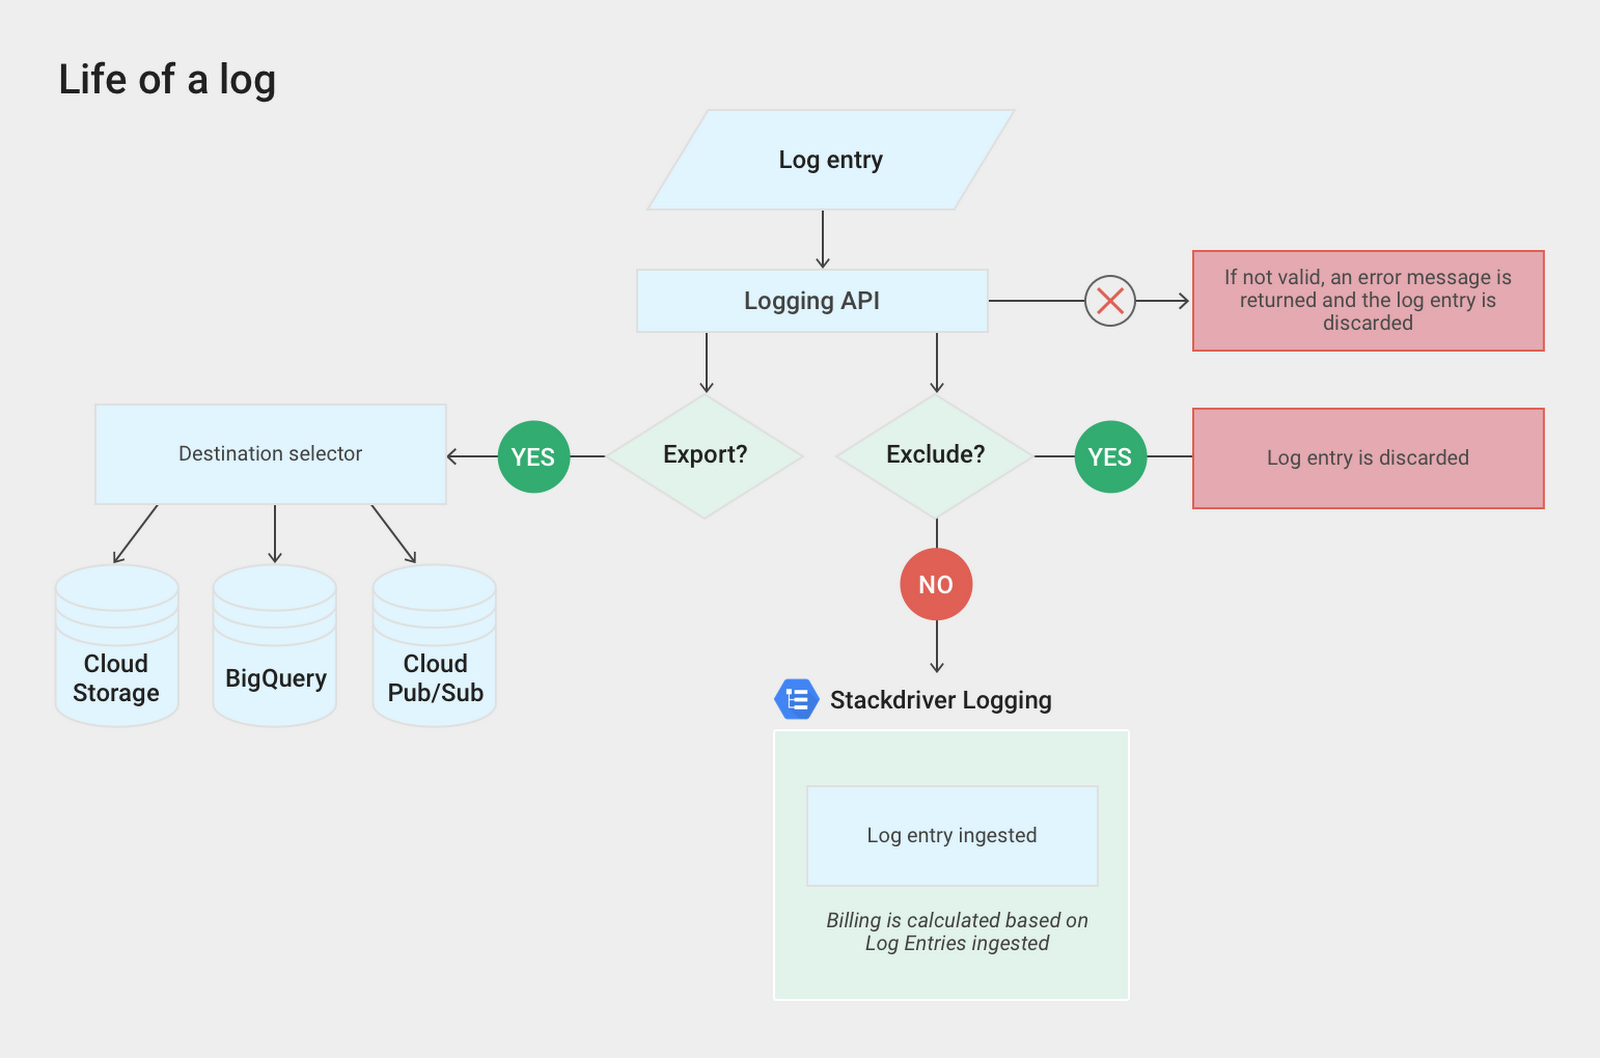
- Logging: The exclusion filter in Logging is an incredible tool for managing your costs. The way we’ve designed our system to manage logs is truly unique. As the image below shows, you can choose to export your logs to BigQuery, Cloud Storage or Cloud Pub/Sub without needing to pay to ingest them into Stackdriver. You can even use exclusion filters to collect a percentage of logs, such as 1% of successful HTTP responses. Plus, exclusion filters are easy to update, so if you’re troubleshooting your system, you can always temporarily increase the logs you’re ingesting.

Let’s look at how to combine the visibility from the new metrics with the other tools in Stackdriver to follow a specific monthly budget. Suppose we have $50 per month to spend on logs, and we’d like to make that go as far as possible. We can afford to ingest 150 GB of logs for the month. Looking at the Log Ingestion page, shown below, we can easily get an idea of our volume from last month—200 GB. We can also see that 75 GB came from our Cloud Load Balancer, so we’ll add an exclusion filter for 99% of 200 responses.


To help make sure we don’t go over our budget, we’ll also set a Stackdriver alert, shown below, for when we reach 145 GB on the monthly log bytes ingested. Based on the cost of ingesting log bytes, that’s just before we’ll reach the $50 monthly budget threshold.
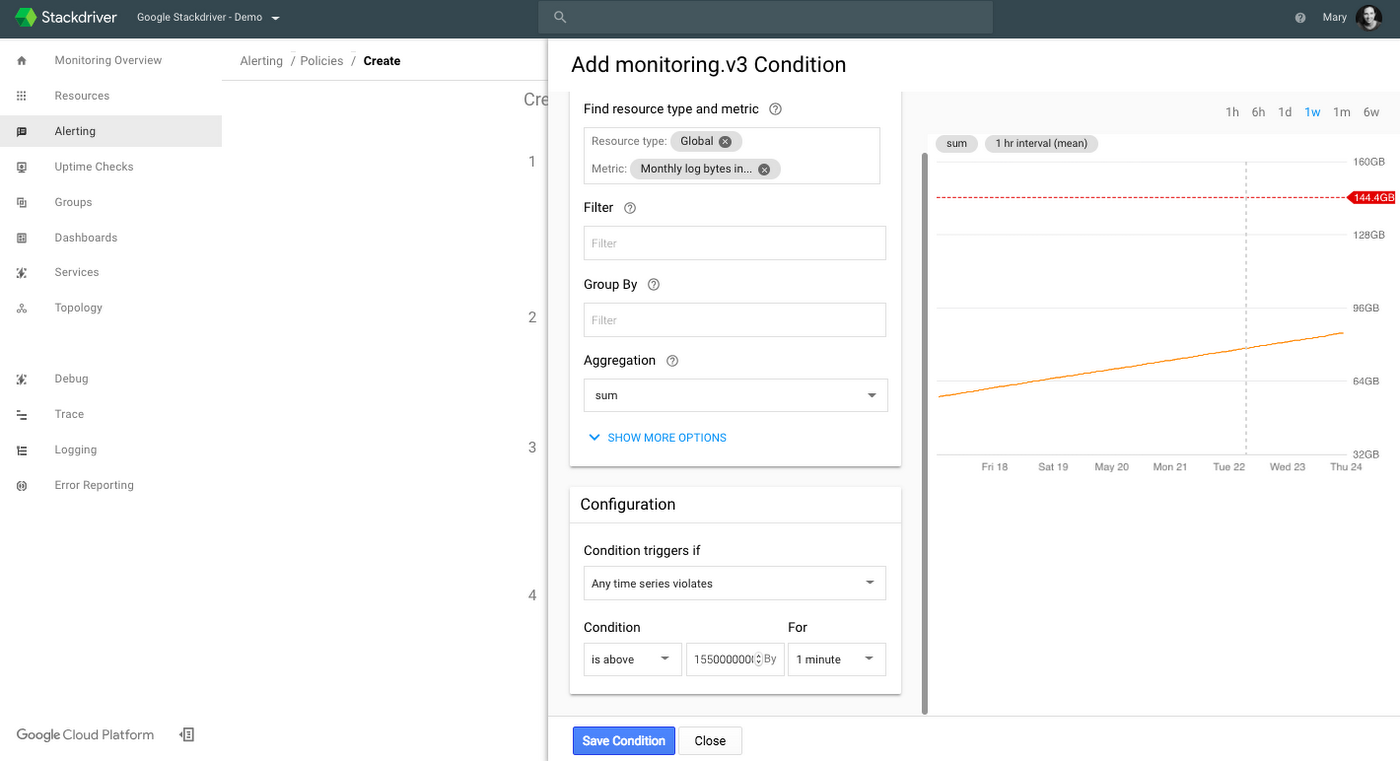

Based on this alerting policy, suppose we get an email near the end of the month that our volume is at 145 GB for the month to date. We can turn off ingestion of all logs in the project with an exclusion filter like this:
logName:*
Now only admin activity audit logs will come through, since they don’t count toward any quota and can’t be excluded. Let’s suppose we also have a requirement to save all data access logs on our project. Our sinks to BigQuery for these logs will continue to work, even though we won’t see those logs in Stackdriver Logging until we disable the exclusion filter. So we won’t lose that data during that period of time.
Like managing your household budget, running out of funds at the end of the month isn’t a best practice. Turning off your logs should be considered a last option, similar to turning off your water in your house toward the end of the month. Both these scenarios run the risk of making it harder to put out fires or incidents that may come up. One such risk is that if you have an issue and need to contact GCP support, they won’t be able to see your logs and may not be able to help you.
With these tools, you’ll be able to plan ahead to help ensure you’re avoiding ingesting less useful logs throughout the month. You might turn off unnecessary logs based on use, rejigger production and development environment monitoring or logging, or decide to offload data to another service or database. Our new metrics, views and dashboards give you a lot more tools to see how much you’re spending in both resources and IT budget in Stackdriver. You’ll be able to bring flexibility and efficiency to logging and monitoring, and avoid unpleasant surprises.
To learn more about Stackdriver, check out our documentation or join in the conversation in our discussion group.
Related content
