Beyond CPU: horizontal pod autoscaling with custom metrics in Google Kubernetes Engine
Maks Osowski
Product Manager, Google Kubernetes Engine
[Editor's note: This is one of many posts on enterprise features enabled by Kubernetes Engine 1.10. For the full coverage, follow along here.]
Many customers of Kubernetes Engine, especially enterprises, need to autoscale their environments based on more than just CPU usage—for example queue length or concurrent persistent connections. In Kubernetes Engine 1.9 we started adding features to address this and today, with the latest beta release of Horizontal Pod Autoscaler (HPA) on Kubernetes Engine 1.10, you can configure your deployments to scale horizontally in a variety of ways.
To walk you through your different horizontal scaling options, meet Barbara, a DevOps engineer working at a global video-streaming company. Barbara runs her environment on Kubernetes Engine, including the following microservices:
- A video transcoding service that processes newly uploaded videos
- A Google Cloud Pub/Sub queue for the list of videos that the transcoding service needs to process
- A video-serving frontend that streams videos to users
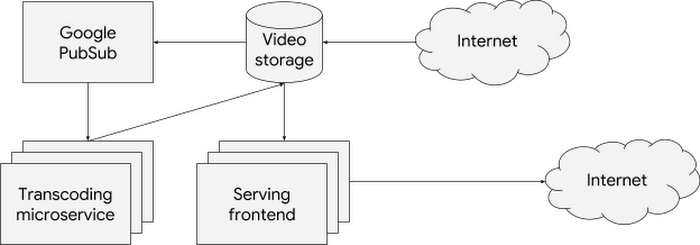

To make sure she meets the service level agreement for the latency of processing the uploads (which her company defines as a total travel time of the uploaded file) Barbara configures the transcoding service to scale horizontally based on the queue length—adding more replicas when there are more videos to process or removing replicas and saving money when the queue is short. In Kubernetes Engine 1.10 she accomplishes that by using the new ‘External’ metric type when configuring the Horizontal Pod Autoscaler. You can read more about this here.
To handle scaledowns correctly, Barbara also makes sure to set graceful termination periods of pods that are long enough to allow any transcoding already happening on pods to complete. She also writes her application to stop processing new queue items after it receives the SIGTERM termination signal from Kubernetes Engine.
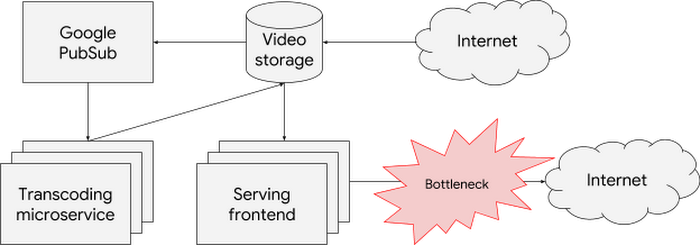

Once the videos are transcoded, Barbara needs to ensure great viewing experience for her users. She identifies the bottleneck for the serving frontend: the number of concurrent persistent connections that a single replica can handle. Each of her pods already exposes its current number of open connections, so she configures the HPA object to maintain the average value of open connections per pod at a comfortable level. She does that using the Pods custom metric type.
To scale based on the number of concurrent persistent connections as intended, Barbara also configures readiness probes such that any saturated pods are temporarily removed from the service until their situation improves. She also ensures that the streaming client can quickly recover if its current serving pod is scaled down.
It is worth noting here that her pods expose the open_connections metric as an endpoint for Prometheus to monitor. Barbara uses the prometheus-to-sd sidecar to make those metrics available in Stackdriver. To do that, she adds the following YAML to her frontend deployment config. You can read more about different ways to export metrics and use them for autoscaling here.
Recently, Barbara’s company introduced a new feature: streaming live videos. This introduces a new bottleneck to the serving frontend. It now needs to transcode some streams in real- time, which consumes a lot of CPU and decreases the number of connections that a single replica can handle.
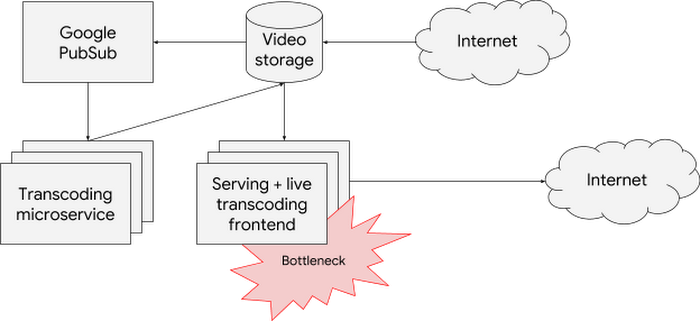

To deal with that, Barbara uses an existing feature of the Horizontal Pod Autoscaler to scale based on multiple metrics at the same time—in this case both the number of persistent connections as well as CPU consumption. HPA selects the maximum signal of the two, which is then used to trigger autoscaling:
These are just some of the scenarios that HPA on Kubernetes can help you with.


