New in Cloud Monitoring: Better tools for analysis, uptime checks, and alerts
Kyle Benson
Product Manager, Cloud Ops
We here on the Cloud Monitoring team have had a busy few months rolling out new capabilities to help you detect, troubleshoot, and remediate issues with your infrastructure and applications running on and outside of Google Cloud. We recently launched several new features to improve the visualization and troubleshooting experience and unify several key experiences for our users.
Let’s take a closer look at some of these new features:
New visualization tools for simplified troubleshooting
These features are all about making it easier to explore your telemetry when it matters most.
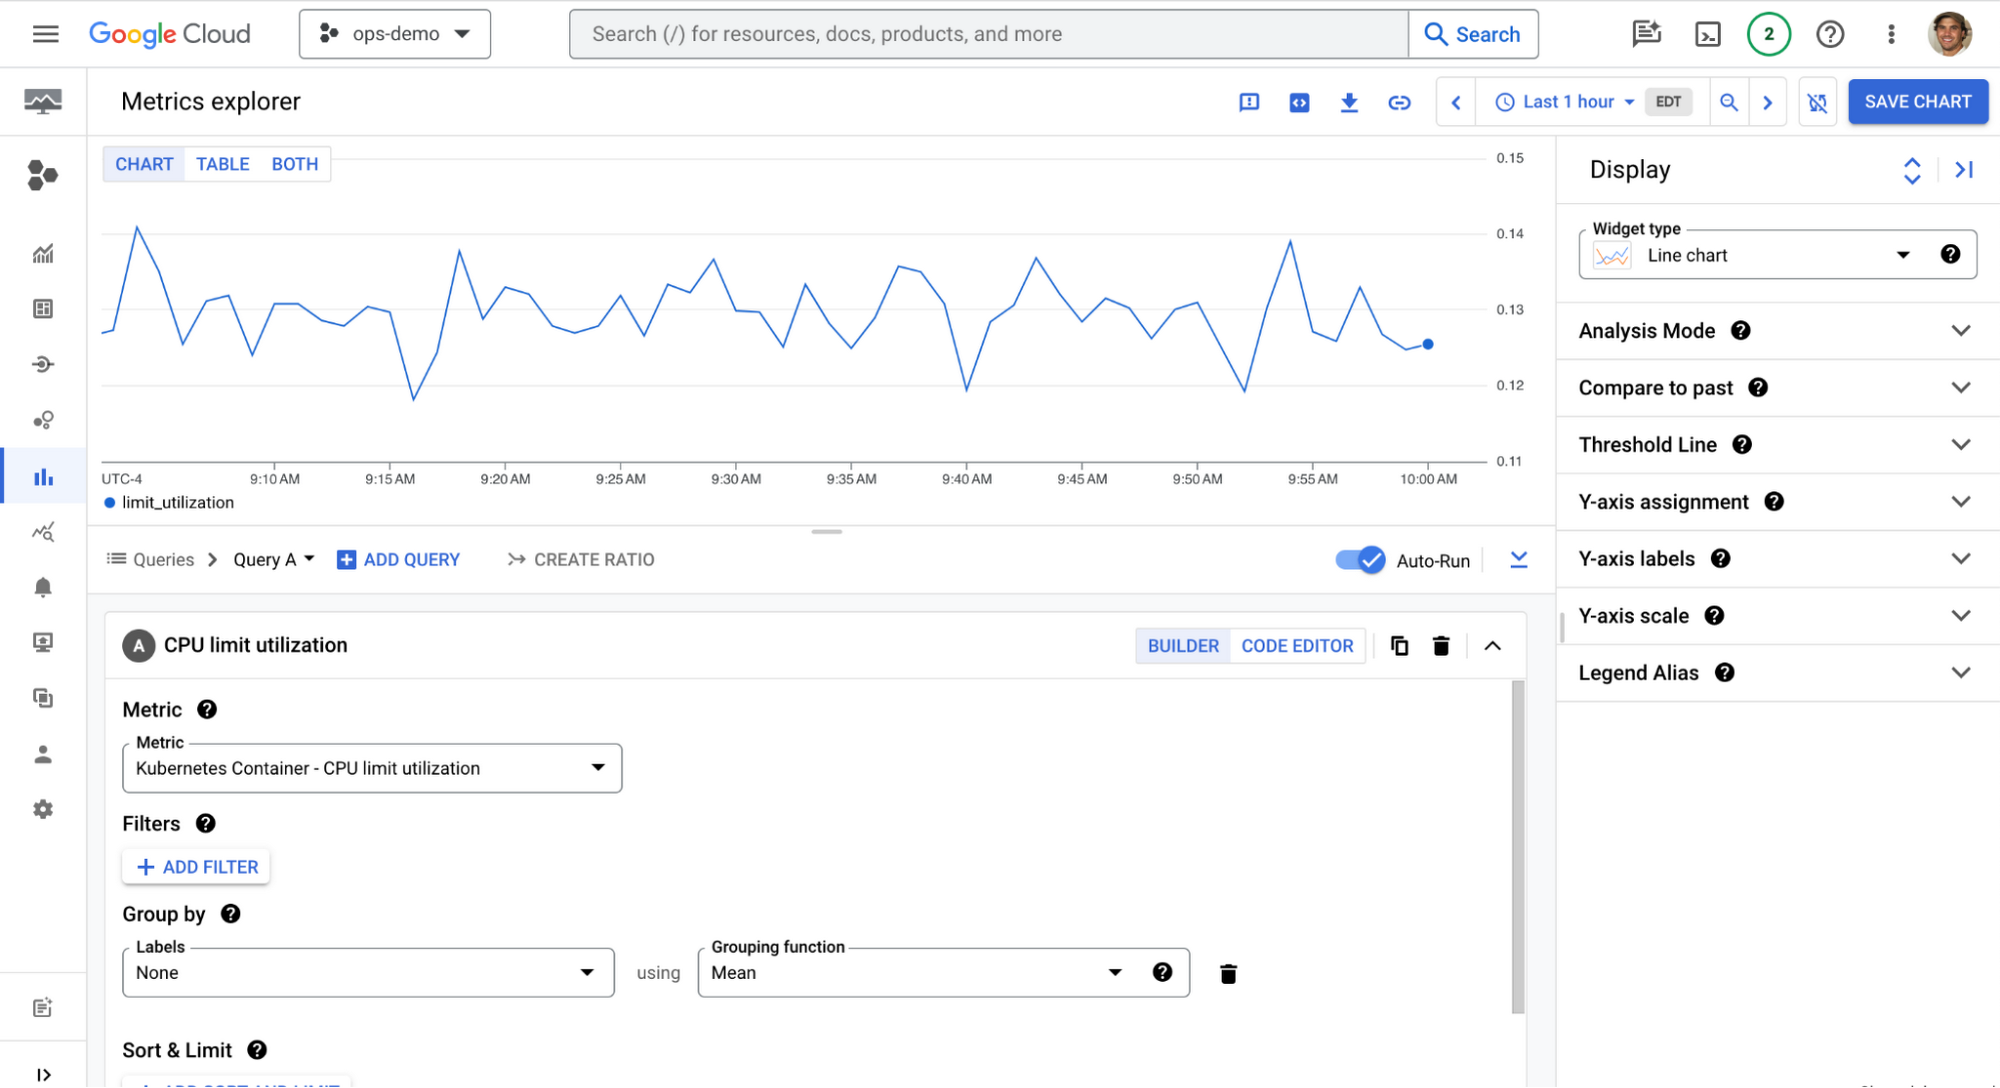
New Metrics Explorer experience
The new Metrics Explorer has a simpler UI and improved information architecture for exploring metrics with ease. It provides better support for multiple metric correlation when investigating issues, viewing multiple queries on the same chart, improved discoverability for additional display actions such as compare to past, a new and intuitive timeframe picker, and clearer support for advanced queries using MQL and PromQL. This makes it easier to find the metrics you need and understand what they mean.

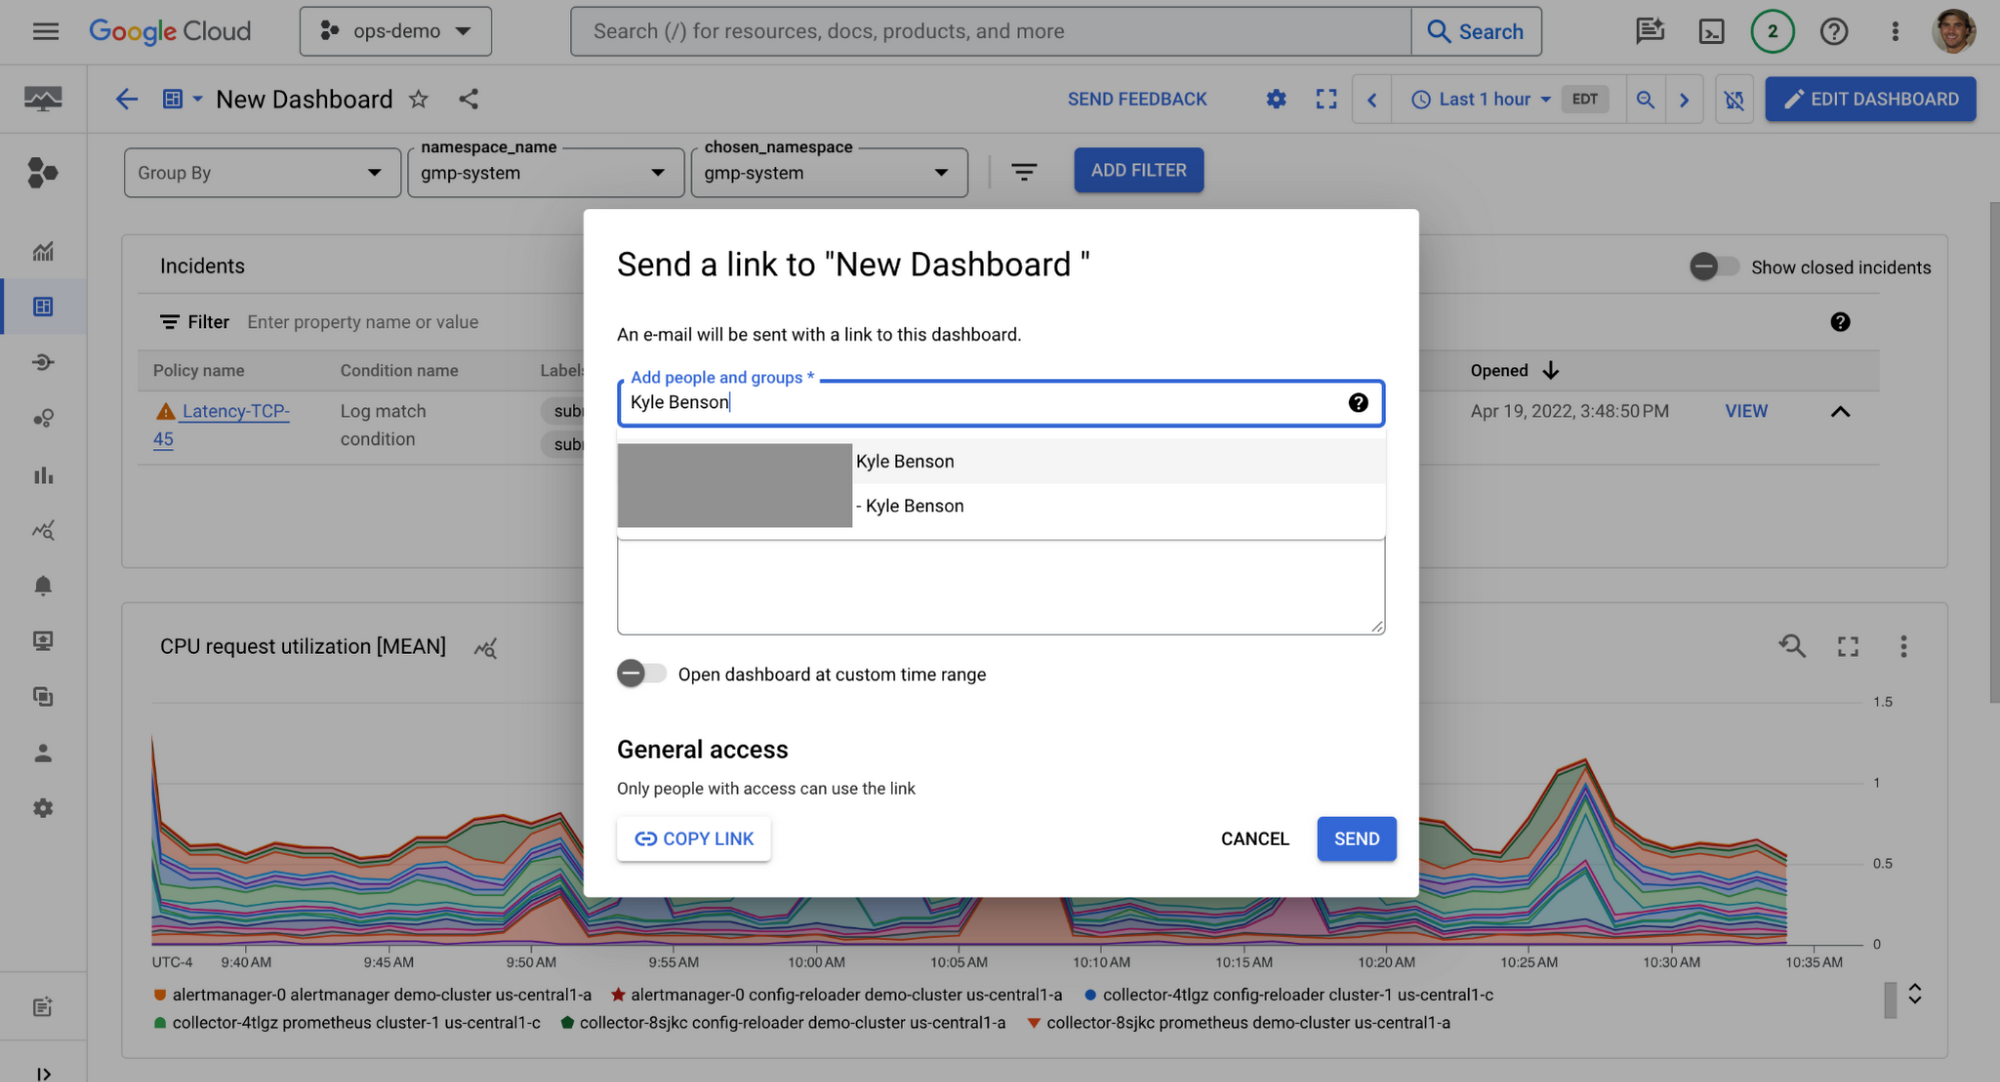
Shareable dashboards
Shareable dashboards make it easy to collaborate with others on shared issues and adjust IAM permissions to give team members the access they need to help in real time. To create a shareable dashboard, simply click the Share button in the top right corner of the dashboard and enter the email addresses of the people you want to share it with. They will then be able to view the dashboard in their own Monitoring account.

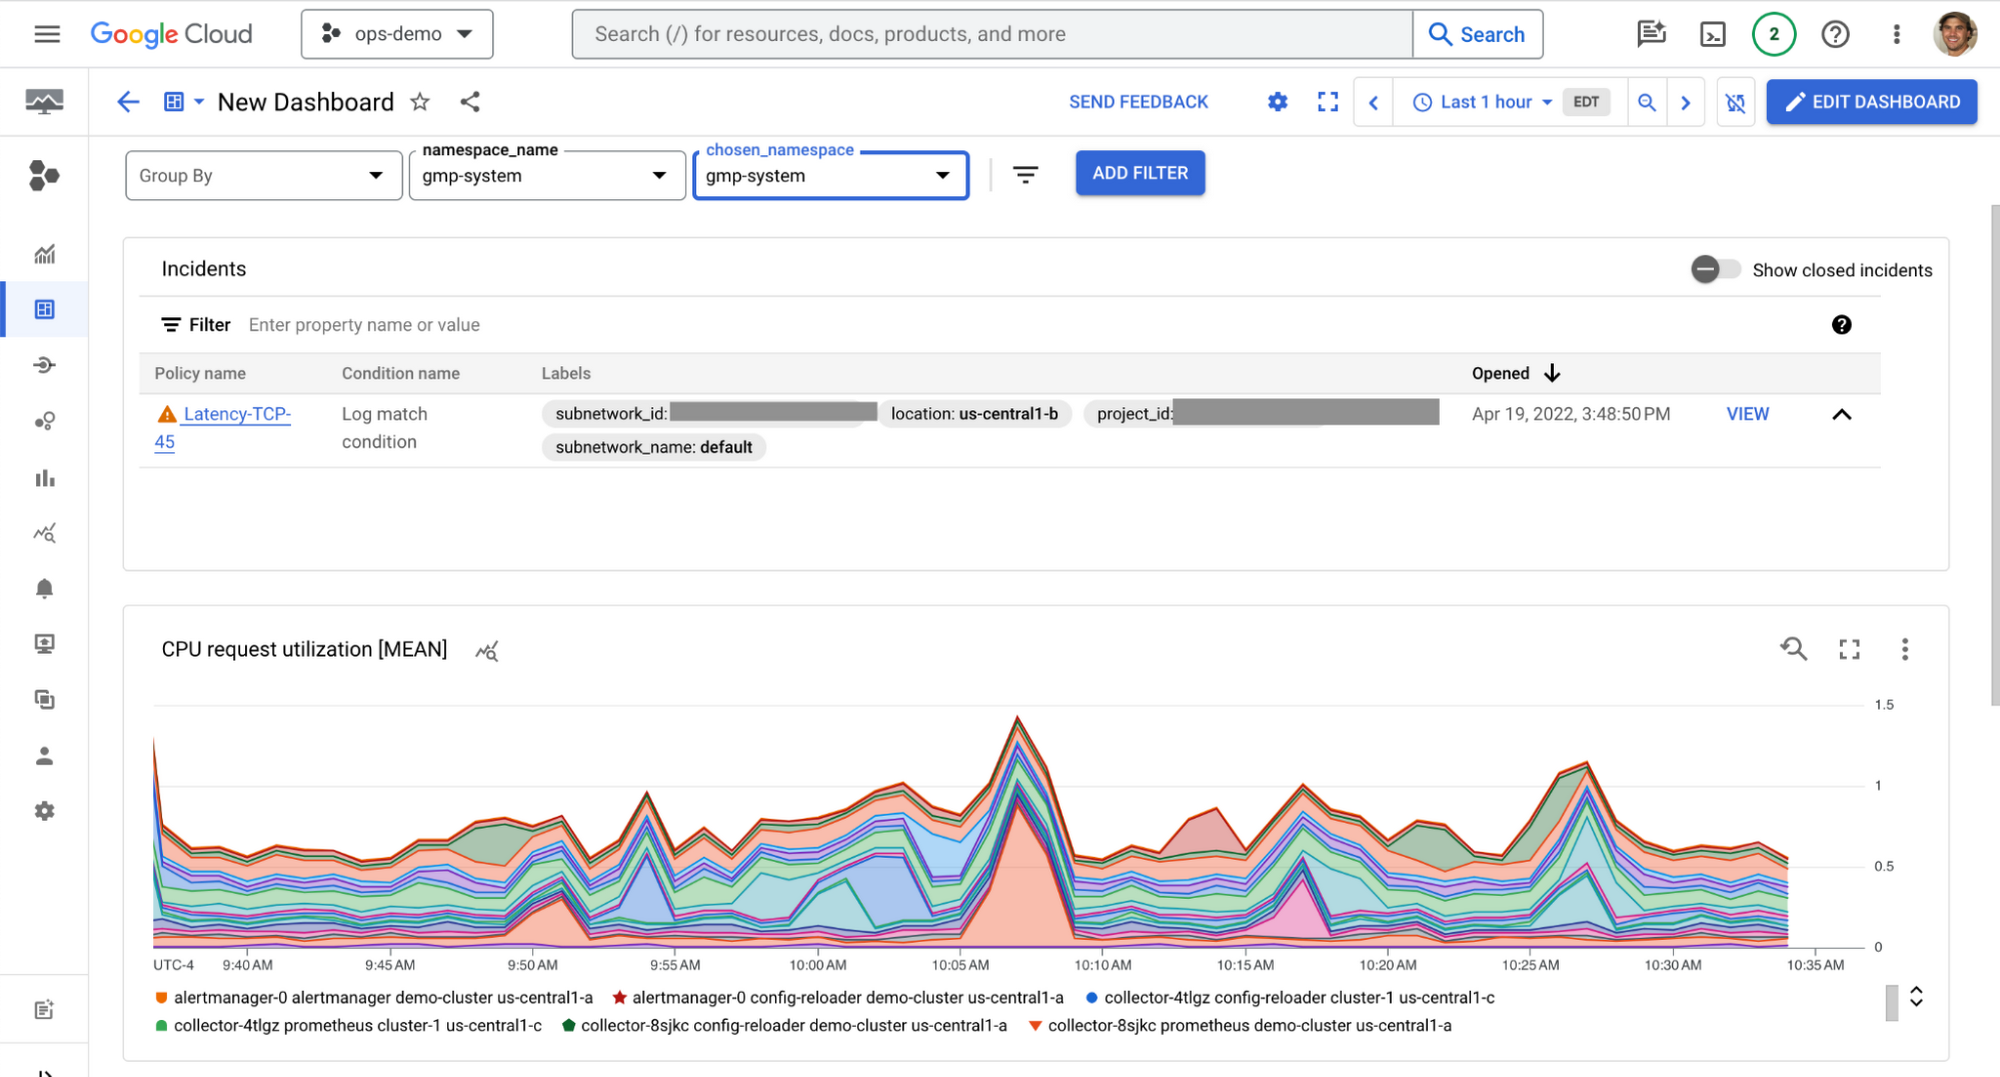
New incident widget
The new incident widget for dashboards provides visibility into active incidents alongside visuals of other key metrics and logs, so you can act to resolve them quickly. To view the incident widget, click the Incidents tab in the Monitoring console. The widget will show you a list of all active incidents, along with their severity, status, and affected resources. You can also click on an incident to view more details, such as the root cause and affected users.

Improved consistency
The simplified and visually consistent interfaces make it easier to use Monitoring throughout Google Cloud and understand the data it provides. For example, the new Metrics Explorer uses the same design as other Monitoring views, so you can easily switch between them. Additionally, the new incident widget is now integrated with the other Monitoring views, so you can see all of your incidents in one place.
Expanded blackbox monitoring with uptime checks
Uptime checks in Cloud Monitoring allow you to determine whether a resource is available and behaving as expected from the perspective of the end user. We’ve recently integrated uptime checks with additional Google Cloud services.
GKE uptime check integration
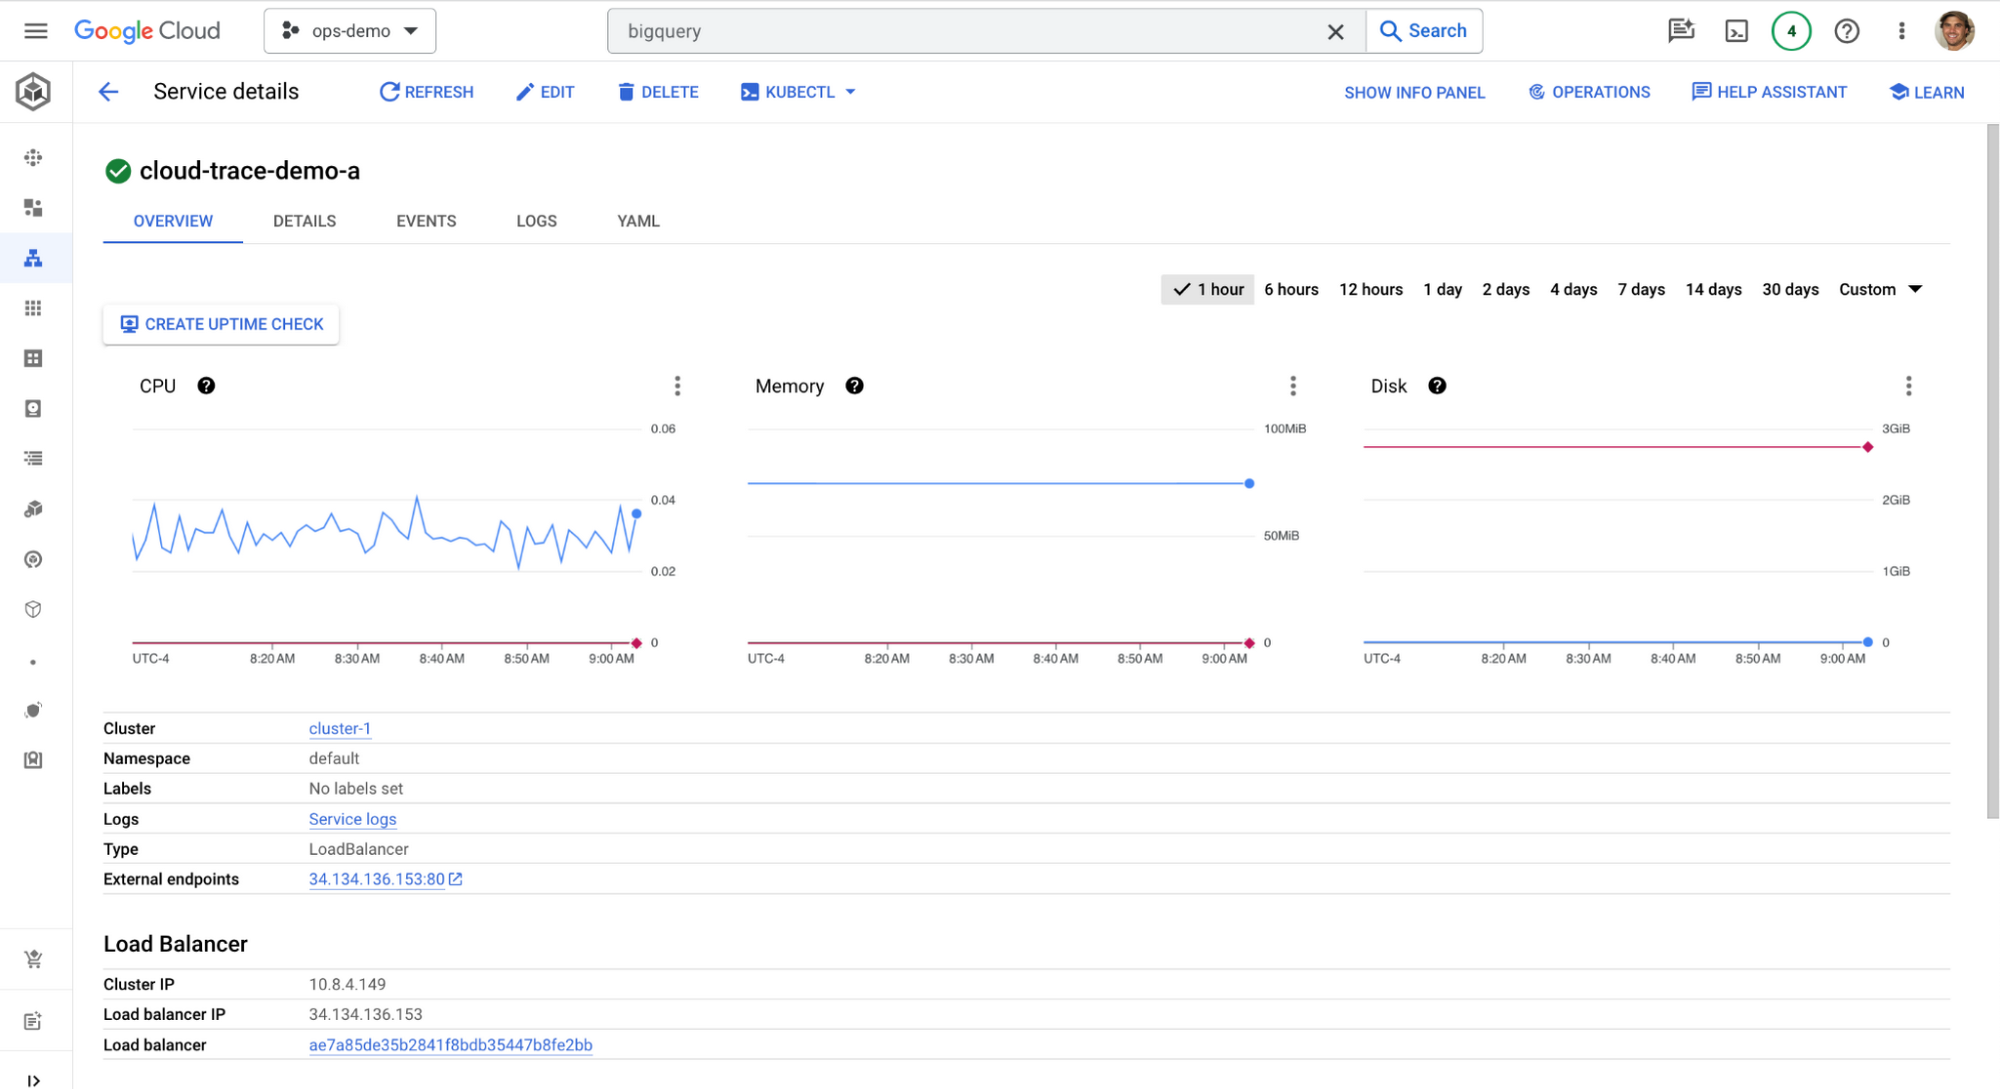

We’ve expanded on our support for GKE service uptime Checks, by letting you create uptime checks directly from the Google Kubernetes Engine console. If you’re checking out a service inside the GKE UI, you can immediately create an uptime check directly from that UI without having to leave your current spot. Uptime Checks are one of the easiest ways to start monitoring your services without any extra instrumentation, making it a great way for users to get started monitoring their GKE services quickly.
Uptime check for Cloud Run
We’ve also introduced a new dedicated uptime check for Cloud Run, making it easier to create targets against Cloud Run services and better track the health of your service as experienced by end users or customers.
Improvements in Alerting
Alert policies drive much of the troubleshooting cycle. To improve the signal-to-noise ratio for people less experienced with Google Cloud, we now offer recommendations to simplify onboarding.
Recommended alert policies
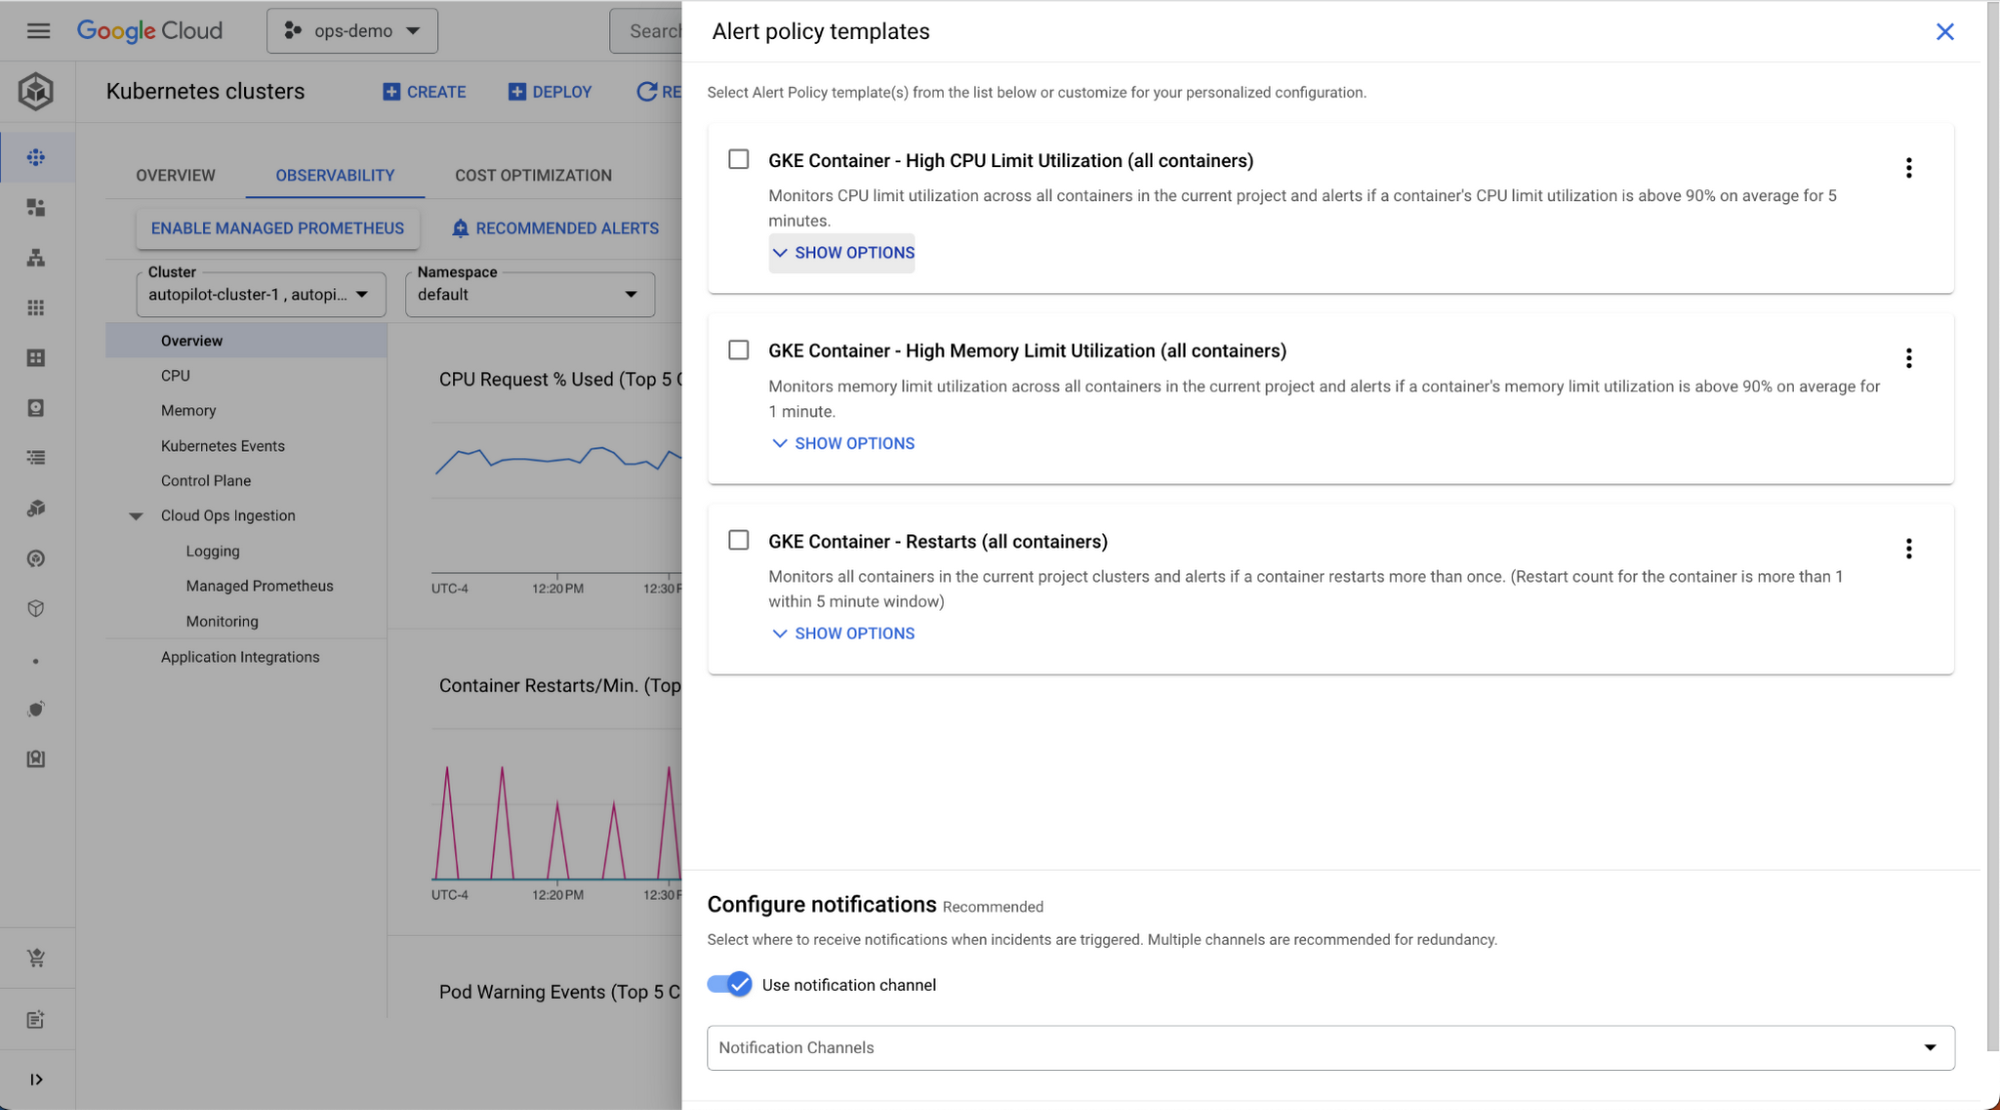
We recently introduced recommended alert policies to help you get started with monitoring top Google Cloud services. This includes networking services, Compute Engine, and GKE. The templates are available in Cloud Console and can be fetched programmatically from GitHub. Here’s an example of the UI:

Alerting snoozes
You can now snooze alerts to help reduce noise for your team. This is useful during planned maintenance windows or when you’re in the middle of a known escalating outage. This experience is available today via the API, UI, and gCloud with Terraform compatibility. Scheduling recurring snoozes is possible by calling the API and using a cron job, with support for built-in recurrences coming later.
Simplified signal collection
Last but not least, with the new Ops Agent integration, you can easily collect OpenTelemetry Protocol (OTLP) Metrics and Traces from your Compute Engine workloads. Together, Ops Agent and OTLP provide push-based metrics, automatic authorization, and Prometheus/PromQL compatibility.
If you're using Google Cloud Monitoring, we encourage you to try out the new features and see how they can help you improve your troubleshooting experience. As always, to provide feedback on these new features, select the Question Mark icon in the top right corner and select ‘Give Feedback’.
