Deliver exception messages through Slack and Webhooks for fast resolution
Eyamba Ita
Product Manager
Alek Szilagyi
Software Engineer, Google Cloud
Building new applications is a lot of fun, but troubleshooting and fixing the crashes that can come with app development is not. While many organizations are fast adopting the DevOps model, there are still some legacy frameworks where developers and operations teams are separate. Developers build and submit apps to their ops team, who in turn deploy and maintain the production stack.
A common issue that arises due to this workflow is the time it takes to find and resolve crashes. To help reduce the time it takes to find crashes, we recently introduced new notification channels for our Alerting product. Building on that release, we’re happy to announce today that you can send Error Reporting notifications through both Slack and Webhooks.
What is Error Reporting?
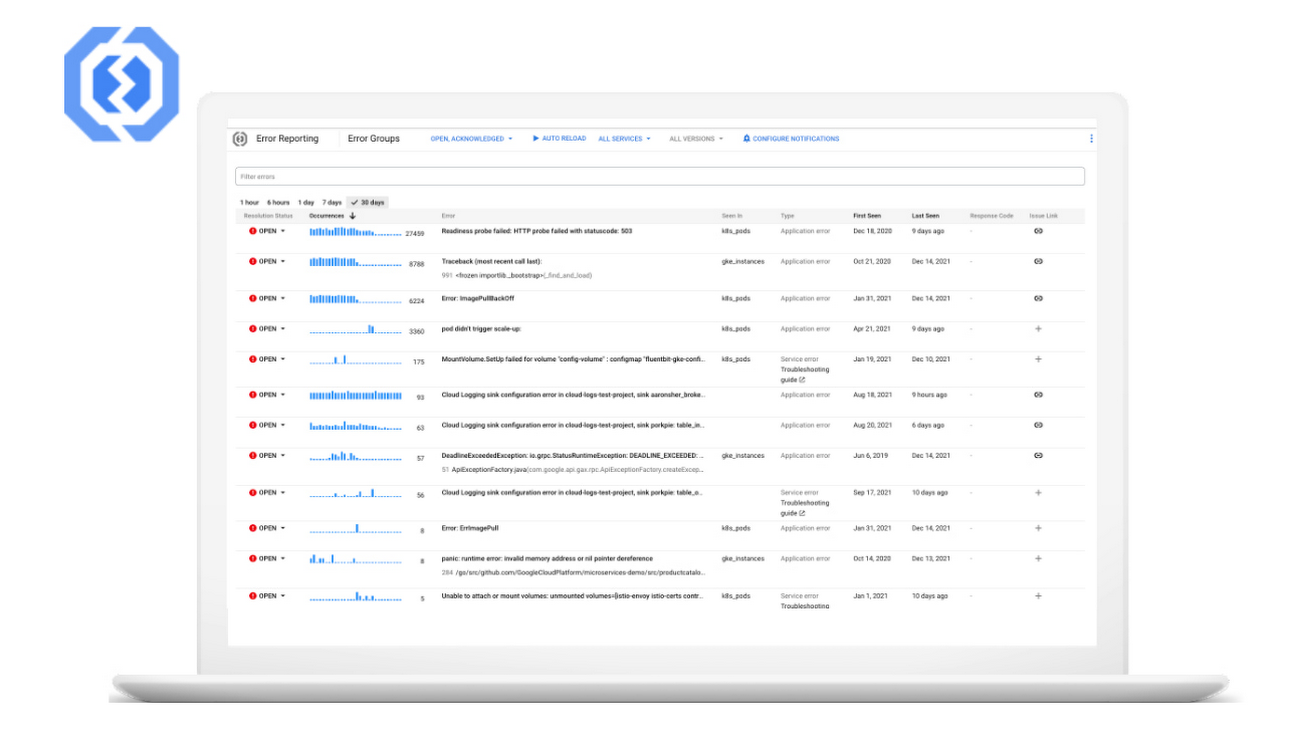
Error Reporting can analyze, aggregate, and notify you about crashes in your running cloud services. It can synthesize this information from ingested logs in Cloud Logging and has a dedicated page that displays the details of the errors, including a histogram of occurrences, list of affected versions, request URL, and links to the request log.

What are we launching?
Building on our recent launch of alerting notification channels, today we are announcing an extension of Error Reporting’s notification capabilities to include Slack and Webhooks.
With this launch, your teams can receive notifications about crashes directly into their configured Slack channel or preferred collaboration platform using webhooks.
Crash information can then be quickly swarmed, discussed, and resolved.
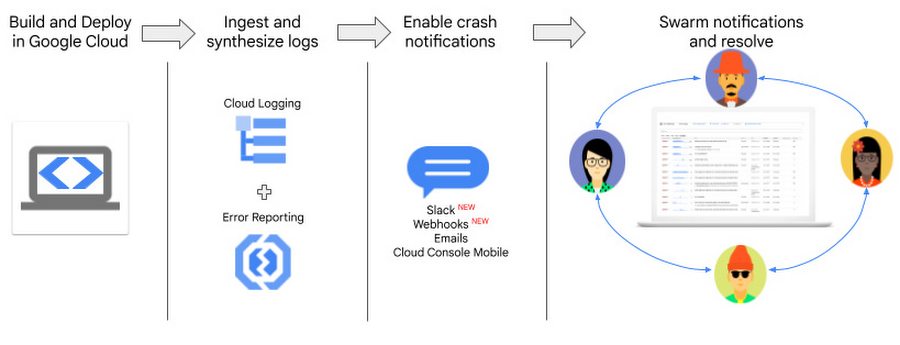

These new channels join our existing Error Reporting notification capabilities of email and the Google Cloud Console mobile app.
What do I have to do to enable Error Reporting and these notifications?
Error Reporting is automatically enabled as soon as logs that contain error events like stack traces are ingested into Cloud Logging. Alternatively, you can self configure Error Reporting for a new project if you won’t be using Cloud Logging.
To configure the new notification channels, see documentation here for Slack and Webhooks, or keep reading below:
Enabling Slack
- In Slack: Create a Slack workspace and channel at the Slack site. Record the channel URL.
- In the Cloud Console, select Monitoring
- Click Alerting and then click Edit notification channels.
- In the Slack section, click Add new to open the Slack sign-in page:
- Select your Slack workspace.
- Click Allow to enable Cloud Monitoring access to your Slack workspace. This action takes you back to the Monitoring configuration page for your notification channel.
- Enter the name of the Slack channel you want to use for notifications.
- Enter a display name for the Slack notification channel.
- (Optional) To test the connection between Cloud Monitoring and your Slack workspace, click Send test notification. If the connection is successful, then you see a message This is a test alert notification... in the Slack notification channel that you specified. Check the notification channel to confirm receipt.
- If the Slack channel you want to use for notifications is a private channel, then you must manually invite the Monitoring app to the channel:
- Open Slack.
- Go to the channel you specified as your Monitoring notification channel.
- Invite the Monitoring app to the channel by entering and sending the following message in the channel:
- /invite @Google Cloud Monitoring
- Be sure you invite the Monitoring app to the private channel you specified when creating the notification channel in Monitoring. Inviting the Monitoring app to public channels is optional.
Enabling Webhooks
- The webhook handler: Identify the public endpoint URL to receive webhook data from Monitoring.
- In the Cloud Console, select Monitoring
- Click Alerting and then click Edit notification channels.
- In the Webhook section, click Add new.
- Complete the dialog.
- Click Test Connection to send a test payload to the Webhook endpoint. You can go to the receiving endpoint to verify delivery.
- Click Save.
Webhook schema
The Webhook schema structure for Error Reporting, is as follows:
Schema structure, version 1.0
Basic authentication
In addition to the webhook request sent by Cloud Monitoring, basic authentication utilizes the HTTP specification for the username and password. Cloud Monitoring requires your server to return a 401 response with the proper WWW-Authenticate header. For more information about basic authentication, see the following:
Token authentication
Token Authentication requires a query string parameter in the endpoint URL and a key that the server expects to be secret between itself and Monitoring. The following is a sample URL that includes a token:
https://www.myserver.com/stackdriver-hook?auth_token=1234-abcd
If Monitoring posts an incident to the endpoint URL, your server can validate the attached token. This method of authentication can be more effective when used with SSL/TLS to encrypt the HTTP request, which can prevent snoopers from learning the token.
For an example server in Python, see this sample server.
Get Started Today
If you haven’t visited your Error Reporting console yet, give it a try today and learn more about it in documentation. When you’re ready to configure your notifications, consider Slack and Webhooks if they fit into your current alerting and notification strategy.
If you have any questions or want to start a discussion with other Error Reporting users, visit the Cloud Operations section of the Google Cloud Community and post a discussion topic.
