Trace exemplars now available in Managed Service for Prometheus
Lee Yanco
Senior Product Manager
Cross-signals correlation — where metrics, logs, and traces work together in concert to provide a full view of your system’s health — is often cited as the “holy grail” of observability. However, given the fundamental differences in their data models, these signals usually live in separate, isolated backends. Pivoting between signal types can be laborious, with no natural pointers or links between your different observability systems.
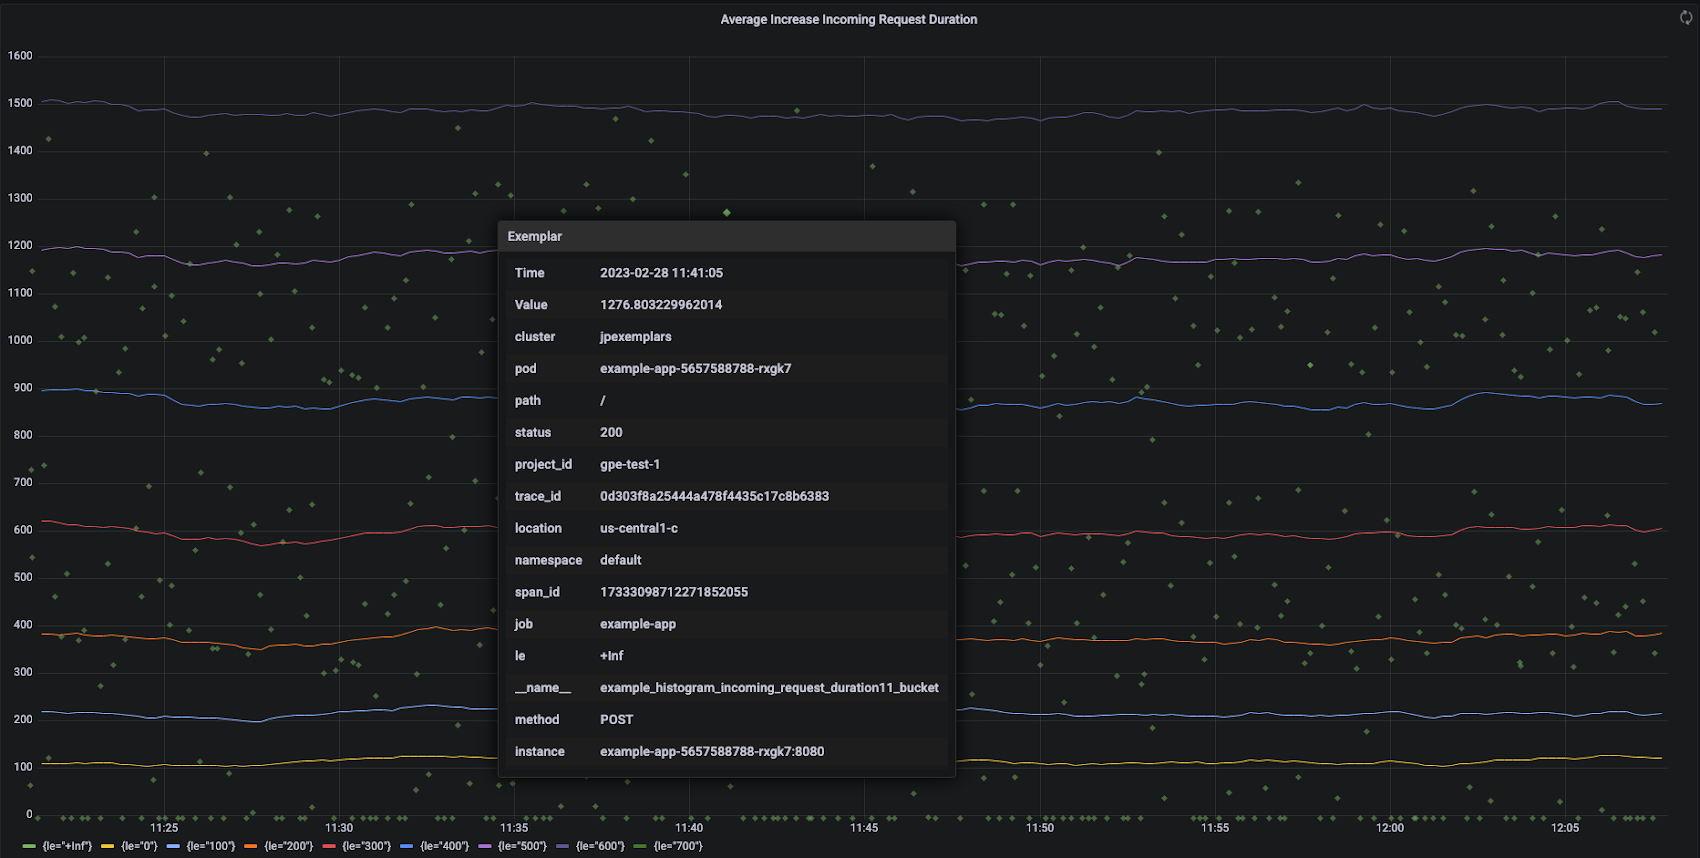
Trace exemplars provide cross-signals correlation between your metrics and your traces, allowing you to identify and zoom in on individual users who experienced abnormal application performance. Storing trace information with metric data lets you quickly identify the traces associated with a sudden change in metric values; you don't have to manually cross-reference trace information and metric data by using timestamps to identify what had happened in the application when the metric data was recorded.
To make it even easier to get started with this cross-signals story, we’re excited to announce that Managed Service for Prometheus now natively supports Prometheus exemplars!
Get a beginning-to-end view of high latency user journeys
As Google’s SRE book discusses in its section on monitoring distributed systems, it’s much more useful to measure tail latency instead of average latency. Latency is often very unbalanced, as the SRE book explains:
“If you run a web service with an average latency of 100 ms at 1,000 requests per second, 1% of requests might easily take 5 seconds. If your users depend on several such web services to render their page, the 99th percentile [p99] of one backend can easily become the median response of your frontend.”
By using a histogram (a.k.a., a distribution) of latencies instead of an average latency metric, you can see these high-latency events and take action before the p99.9 (99.9th percentile) latency becomes the p99, p90, or worse.
Exemplars provide the missing link between noticing an latency issue with metrics and performing root cause analysis with traces. When you add trace exemplars to your histograms, you can pivot from a chart showing a distribution of latencies into an example trace that generated p99.9 latency. You can then inspect the trace to see what calls took the most time, allowing you to identify and resolve creeping latency issues before they affect more of your users.


You can further investigate which flows are problematic by looking at the differences between a trace associated with p99.9 latency and a trace associated with p50 latency.
Managed Service for Prometheus exemplars remain available for querying for 24 months. Compare this retention period to upstream Prometheus, where exemplars are retained only while the data is in-memory, typically less than 14 days.
Prometheus exemplars work with both Cloud Trace and third-party tracing tools such as Grafana Tempo. They can be queried using PromQL in Grafana or by using the Query Builder in Cloud Monitoring. Querying exemplars by using PromQL in Cloud Monitoring is coming soon.
Getting started
Exemplars are already available on all Google Kubernetes Engine (GKE) clusters running version 1.25 and above that have Managed Service for Prometheus enabled. They can also be enabled when using self-deployed collection or with the OpenTelemetry Collector.
To correlate metrics with traces, you need to instrument them together. The most common way to do this is by using the OpenTelemetry SDK, but there are also native Prometheus Java, Go, and Python libraries.
For more information and instructions, please review the ”Use Prometheus exemplars” section of the Managed Service for Prometheus documentation.


