Monitor GCE instances with Prometheus and Ops Agent
Kyle Benson
Product Manager, Cloud Ops
Ridwan Sharif
Software Developer
Try Google Cloud
Start building on Google Cloud with $300 in free credits and 20+ always free products.
Free trialIf you’ve worked in the operations space for the last 5+ years, you’ve likely heard of or have started using Prometheus. The proliferation of Prometheus for time series metrics formatting, querying and storage across the open source world and enterprise IT has been shockingly fast, especially with teams using Kubernetes platforms like Google Kubernetes Engine (GKE). We introduced Google Cloud Managed Service for Prometheus last year, which has helped organizations solve their scaling issues when it comes to managing Prometheus storage and queries.
There’s a lot to love about the extensive ecosystem of Prometheus exporters and integrations to monitor your application workloads and visualization tools like Grafana, but we can sometimes hit challenges when trying to leverage these tools beyond Kubernetes based environments.
Crossing the chasm to the rest of your environment
What if you’re looking to unify your metrics across Kubernetes clusters and services running in VMs? Kubernetes makes it easy for Prometheus to auto-discover services and immediately start ingesting metrics, but today there is no common pattern for discovering VM instances.
We’ve seen a few customers try to solve this and hit some issues like:
Building in-house dynamic discovery systems is hard
We’ve seen customers build their own API discovery systems against the Google Compute APIs, their Configuration Management Databases, or other systems they prefer as sources of truth. This can work but requires you to maintain this system in perpetuity and usually requires building an event driven architecture for realistic timeline updates
Managing their own daemonized prometheus binaries
Maybe you love systemd on Linux. Maybe not so much. Either way, it’s certainly possible to build a Prometheus binary, daemonize it, and update its configuration to match your expected behavior and also scrape your local service for Prometheus metrics. This can work for many but if your organization is trying to avoid adding technical debt like most are, this means you still have to now track and maintain the prometheus work. Maybe that even means rolling your own RPM to maintain this and managing the SLAs for this daemonized version.
There can be a lot of pitfalls and challenges with extending Prometheus over to the VM world even though the benefits of a unified metric format and query syntax like PromQL are clear.
Making it simpler on Google Cloud
To make standardizing on Prometheus easier for you, we’re pleased to introduce support for Prometheus metrics in the Cloud Ops Agent, our agent for collecting logs and metrics from Google Compute instances.
The Ops Agent was released in 2021 and was based on the OpenTelemetry project for metrics collection, providing a great deal of flexibility from the community. That flexibility includes the ability to ingest Prometheus metrics, retain their shape, and upload it to Google Cloud Monitoring while maintaining the Prometheus metric structure.
This means that starting today you can deploy the Ops Agent and configure it to scrape Prometheus metrics.
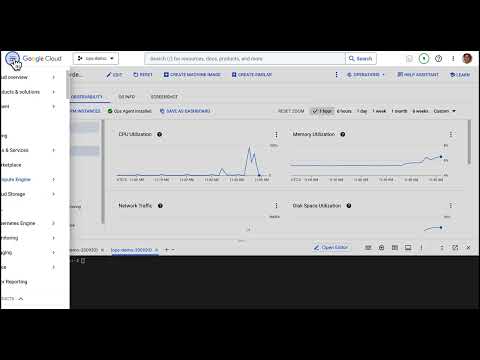
Here’s a quick walkthrough of what that looks like:

As you can see, being able to query Prometheus metrics becomes a fairly trivial process for users of the Ops Agent with GCE instances.
Get Started today
The first step to bringing this unified experience to your VMs is installing the Ops Agent on your VMs and then following the steps to configure for the Prometheus receiver.
When you’re ready you can even make this more programmatic by using our Ops Agent integration with automation tools like Terraform, Ansible, Puppet, and Chef to deploy the agent and dynamically customize the static config file as needed.


