Best practices for streamlining log centralization with Cloud Logging
Keith Chen
Product Manager
Jose Andrade
Customer Engineer
Try Gemini 3.1 Pro
Our most intelligent model available yet for complex tasks on Gemini Enterprise and Vertex AI
Try nowHaving insights into the health of your distributed systems is critical for maintaining system uptime, ensuring optimal performance, and swiftly resolving issues before they impact end-users. A centralized log management system, in particular, can be an especially powerful tool for operations teams. By centralizing logs, you get:
-
Unified visibility with a single pane of glass: Consolidating your logs into a single and easily accessible repository provides a comprehensive view of your system's health and performance. Easily identify trends, pinpoint potential issues, and monitor activity through a single pane of glass.
-
Efficient management at scale and familiarity: Centralizing logs not only streamlines operations and reduces costs, but also provides a familiar, consolidated interface for managing all observability data. This unified approach simplifies analysis and troubleshooting, especially for teams who are accustomed to traditional logging workflows and having a single interface for all of their observability.
-
Enhanced security and compliance: Centralizing your logs creates a unified data source for security analysts to investigate potential threats or anomalies. By consolidating logs from across your infrastructure, you enable faster and more efficient root cause analysis and incident response. Organizations are also able to confirm and enforce logging compliance requirements by auditing one single location.
Cloud Logging, a core component of the Google Cloud Observability suite, makes it easy to centralize and manage logs from diverse sources. In this blog post, we look at some best practices for leveraging Cloud Logging to conquer log management complexities and enhance your cloud observability.
1. Utilize aggregated sinks for efficient routing
Aggregated sinks streamline log routing management by automatically aggregating logs from all their child resources within a folder or an organization. This eliminates the need for manual configuration and individual routing at the project level, simplifying log collection and management.
-
Set up aggregated sinks at the folder level for each environment (e.g., production, non-production) to aggregate logs from all child resources.
-
Enable the intercepting option in aggregated sinks to prevent logs from being sent to child projects, avoiding redundant storage costs.
-
You can learn more about centralized log storage in the documentation.
2. Establish a central observability project as a management hub
A central observability project centralizes the management of logs from various sources, providing a management hub for easier configuration, access control, and analysis. This simplifies log management tasks and streamlines workflows for operations teams.
-
For each environment, and maybe each business unit, create a central observability project and designate it as the destination for the aggregated sinks created in step 1.
-
You use this project as a central hub for granular filtering and routing rules for aggregated logs before they reach their final destinations, providing flexibility and control.
-
Learn more about this approach here.
3. Customize log storage
Customizing your log storage helps ensure optimal retention and cost efficiency. By defining specific retention periods and grouping logs accordingly, you retain essential data while managing expenses effectively. Also customize log storage to your organizational structure to further streamline management and access control.
-
Create new, user-defined log sinks and log buckets tailored to your retention needs. Note that storing logs beyond the default retention period incurs additional costs. Therefore, group logs with the same retention periods in the same buckets to optimize storage costs. When creating log buckets, always select a specific region rather than the default "Global" option, and make sure to select the same region for all new log buckets
-
When creating the central observability project, configure it so the default log bucket is created in the same region as all the other log buckets. You may consider disabling the Default Log Sink, but make sure to create a "catch all" bucket for logs which do not have a set destination.
-
Consider further separating log buckets by your organizational structure (e.g., by application or team) to simplify access control and allocate logging costs more granularly. Additionally, you may create dedicated buckets for specific log types, such as VPC flow logs or data access logs, to streamline querying and analysis across your environment.
-
Enable "Observability Analytics" on new log buckets for advanced analytics with SQL on your log data at no extra cost. To analyze logs in BigQuery, create a linked dataset for direct querying, avoiding BigQuery ingestion and storage costs (BigQuery query costs still apply).
-
Learn more about log storage customization here.
4. Manage log storage access control
Controlling access to log data is crucial for safeguarding sensitive information and ensuring compliance. Restricting permissions based on roles and responsibilities helps maintain data security and prevent unauthorized access.
-
Grant users access to the observability project. You can also allow them to view their logs stored in the centralized project from the source project.
-
Refine access control further at the log-view level (you can create multiple log views within a bucket) for more granular permissions management.
5. Monitor log volume
Actively monitoring log volume helps identify potential spikes or anomalies, allowing you to proactively manage storage costs and investigate any unexpected increases in log data.
-
Regularly monitor log volume with the built-in UIs in the Log Router and Log Storage page.
-
Set up dashboards and alerts using free system metrics such as:
-
logging.googleapis.com/exports/byte_count - Number of bytes in log entries that were exported by log sinks. You can filter by useful labels like ‘Destination’ to group by destination or destination type (using REGEX), or ‘Name’ to breakdown project volume by individual log sinks.
-
logging.googleapis.com/billing/log_bucket_bytes_ingested - Number of bytes streamed into log buckets. This is your billable volume. You can filter by useful labels like ‘Log_source’ to group by source project, ‘Resource_type’ to breakdown by monitored resource types, or ‘Log_bucket_id’ to breakdown by specific log buckets.
-
Find the list of free system metrics for logging here.
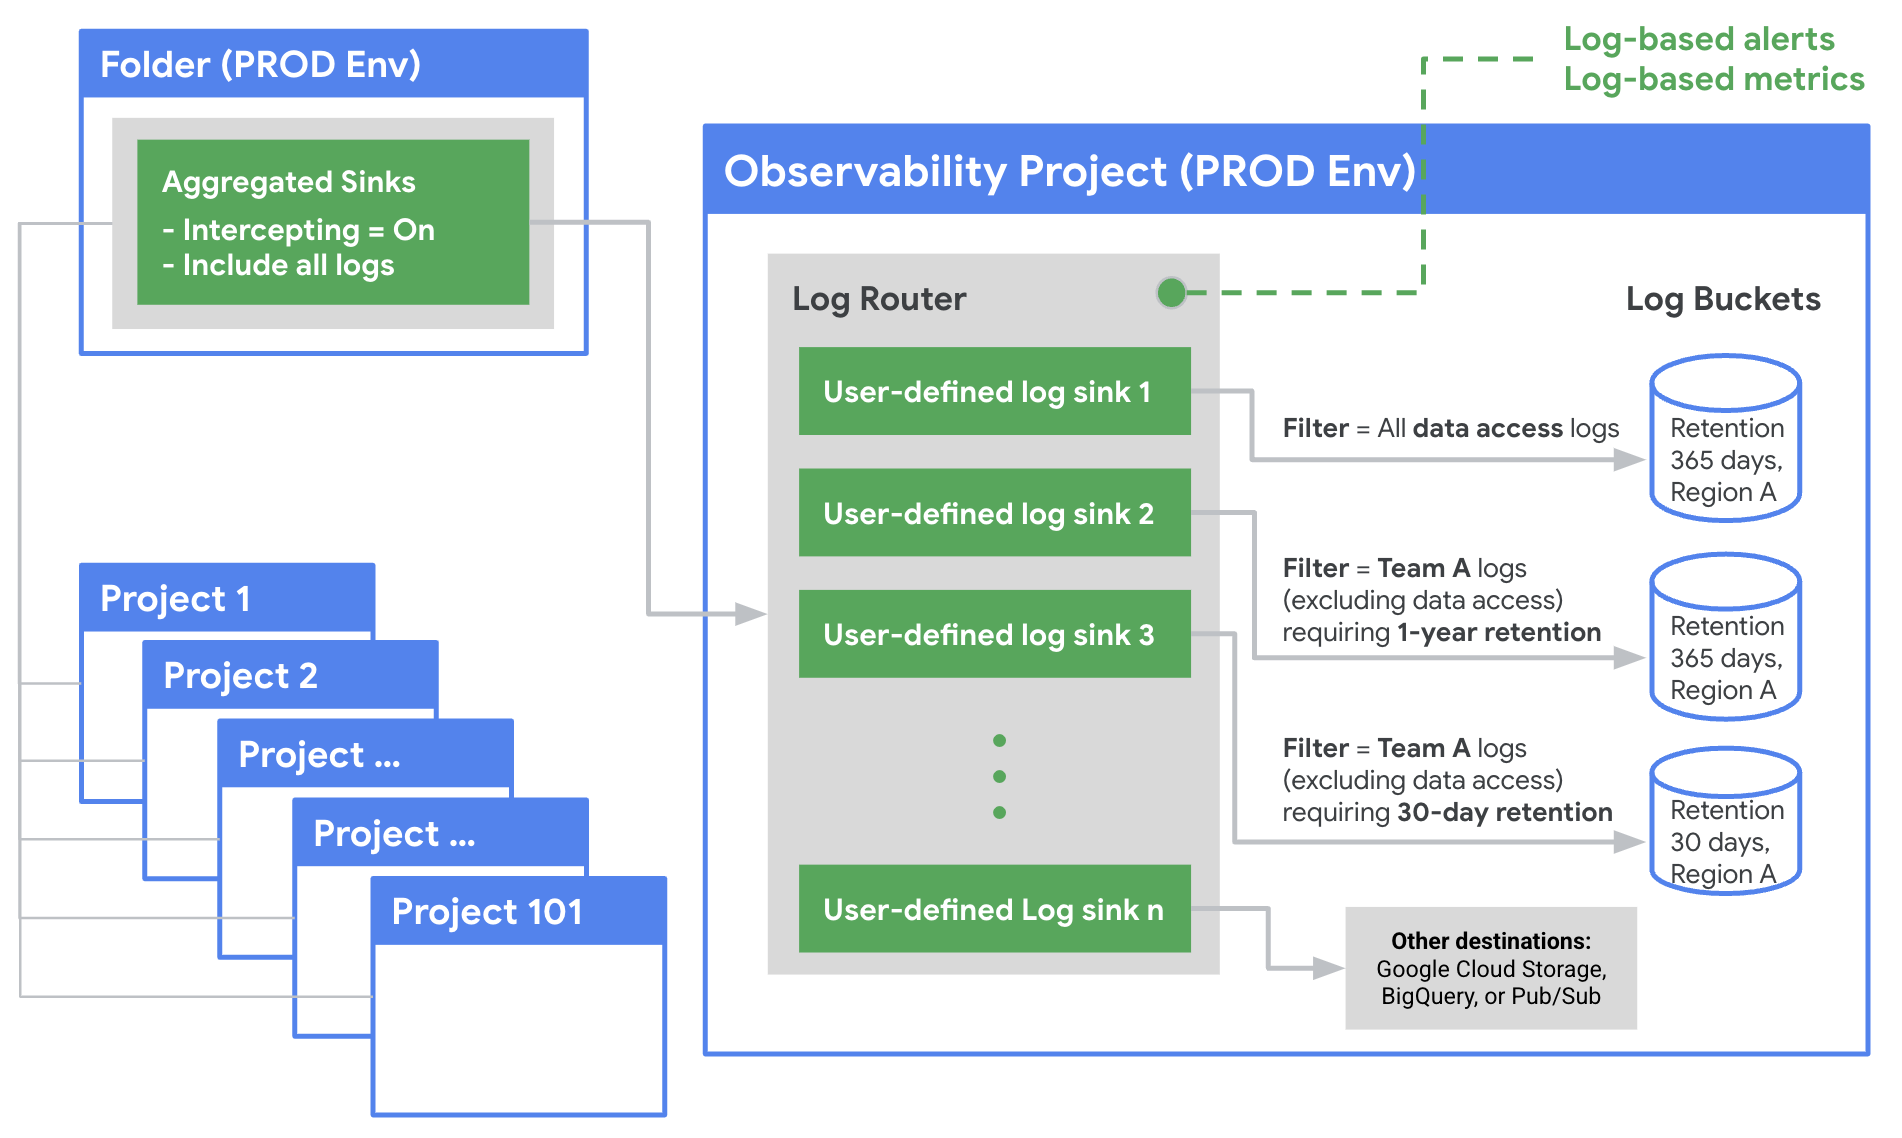
Visualizing the solution
The diagram below provides a visual overview of how to configure Cloud Logging for centralized log management. By consolidating logs from multiple projects into a central hub, you gain a unified view of your entire environment, enabling efficient monitoring and troubleshooting.
Additional recommendations and resources
In short, Cloud Logging makes it easier to centralize your log management practices, and by implementing the best practices outlined in this guide, you'll gain visibility into your cloud environment, streamline operations, and fortify your security posture.
Hungry for more log centralization tips and tricks? Here are a few additional recommendations:
-
Pilot your log routing strategy: Start with a small group of projects to test your Cloud Logging Router setup. This helps fine-tune your configuration before applying it to a larger scale.
-
Leverage log-based metrics: Set up log-based metrics in your central observability project to gain custom insights from your logs across your entire environment.
-
Using proactive monitoring with Cloud Monitoring: By integrating Cloud Logging Router with Cloud Monitoring, you can create alerts and dashboards, giving you real-time insights into your central observability project for quick issue detection and resolution.
-
Manage your costs with Cloud Billing: Monitor your logging costs in real time by setting up budgets and alerts within Cloud Billing. This way, you can compare your actual spending with your projected costs and make necessary adjustments.
-
Expand your log ingestion: Don't limit Cloud Logging to just your Google Cloud workloads. It can serve as your central logging hub for any environment. Explore these options to ingest logs from sources outside of GCP:
- The OpenTelemetry Collector may be used in Windows and Linux VMs, and also as a Docker container or in Kubernetes clusters.
- You can deploy the BindPlane Observability Pipeline to configure and install the BindPlane agent at scale.
- If using the OpenTelemetry agent isn't an option, you can consider working with one of many Google Cloud partners to read logs from external sources and send them to Google Cloud Logging.