Where is your Cloud Bigtable cluster spending its CPU?
Vikram Khemka
Engineering Manager, Cloud Bigtable
Mark Duffett
Software Engineer, Cloud Bigtable
CPU utilization is a key performance indicator for Cloud Bigtable. Understanding CPU spend is essential for optimizing Bigtable performance and cost. We have significantly improved Bigtable’s observability by allowing you to visualize your Bigtable cluster’s CPU utilization in more detail. We now provide you with the ability to break the utilization down by various dimensions like app profile, method and table. This finer grained reporting can help you make more informed application design choices and help with diagnosing performance related incidents.
In this post, we present how this visibility may be used in the real world, through example persona-based user journeys.
User Journey: Investigate an incident with high latency
Target Persona: Site Reliability Engineer (SRE)
ABC Corp runs Cloud Bigtable in a multi-tenant environment. Multiple teams at ABC Corp use the same Bigtable instance.
Alice is an SRE at ABC Corp. Alice gets paged because the tail latency of a cluster exceeded the acceptable performance threshold. Alice looks at the cluster level CPU utilization chart and sees that the CPU usage spiked during the incident window.


Alice wants to drill down further to get more details about this spike. The primary question she wants to answer is “Which team should I be reaching out to?”
Fortunately, teams at ABC Corp follow the best practice of tagging the usage of each team with an app profile in the following format: <teamname>-<workload-type>
The bigtable instance has the following app profiles:
revenue-updaterinfo-updaterpersonalization-readerpersonalization-batch-updater
The instance's data is stored in the following tables:
revenueclient-infopersonalization
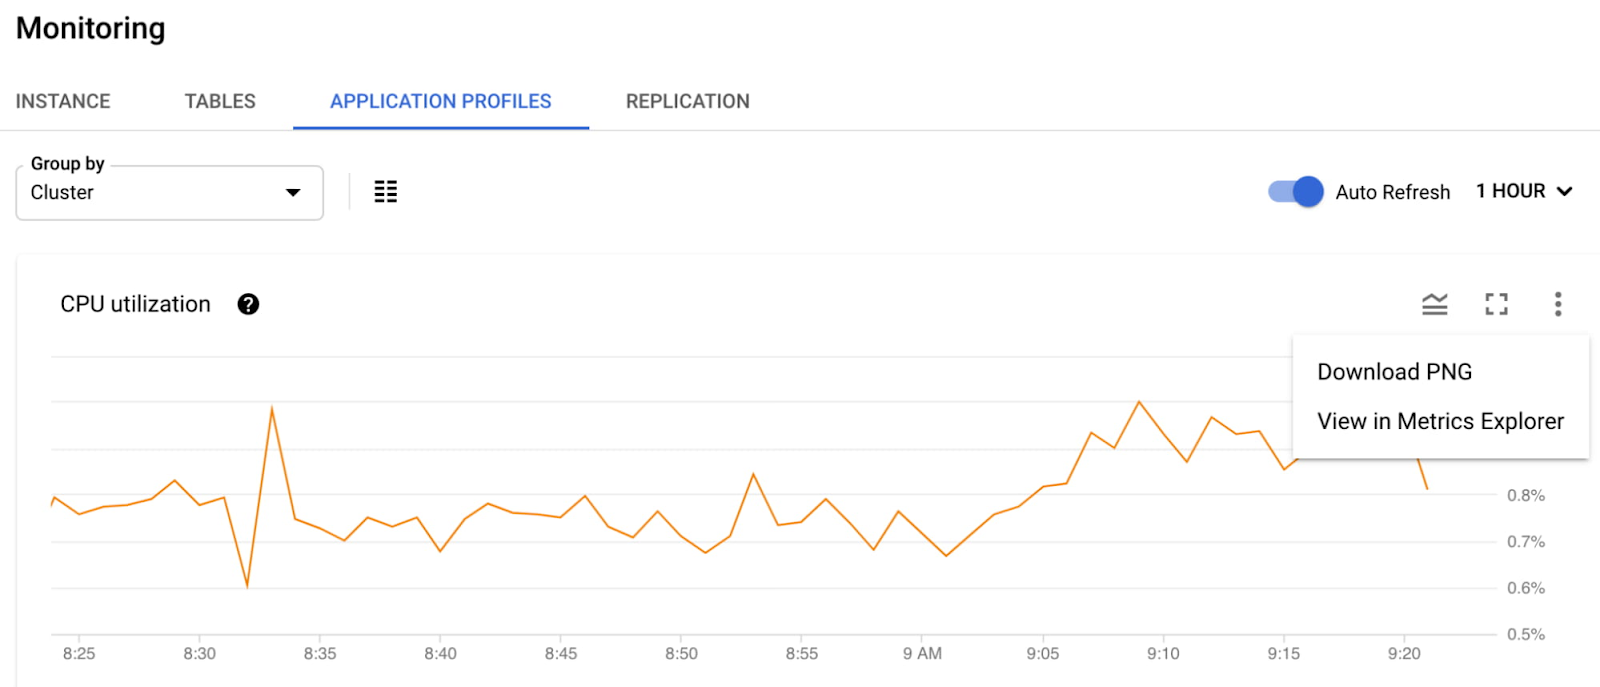
She uses the CPU per app profile chart to determine that the personalization-batch-updater app profile utilized the most CPU during the time of the incident and also saw a spike that corresponded with the spike in latency of the serving path traffic under the personalization-reader app profile.
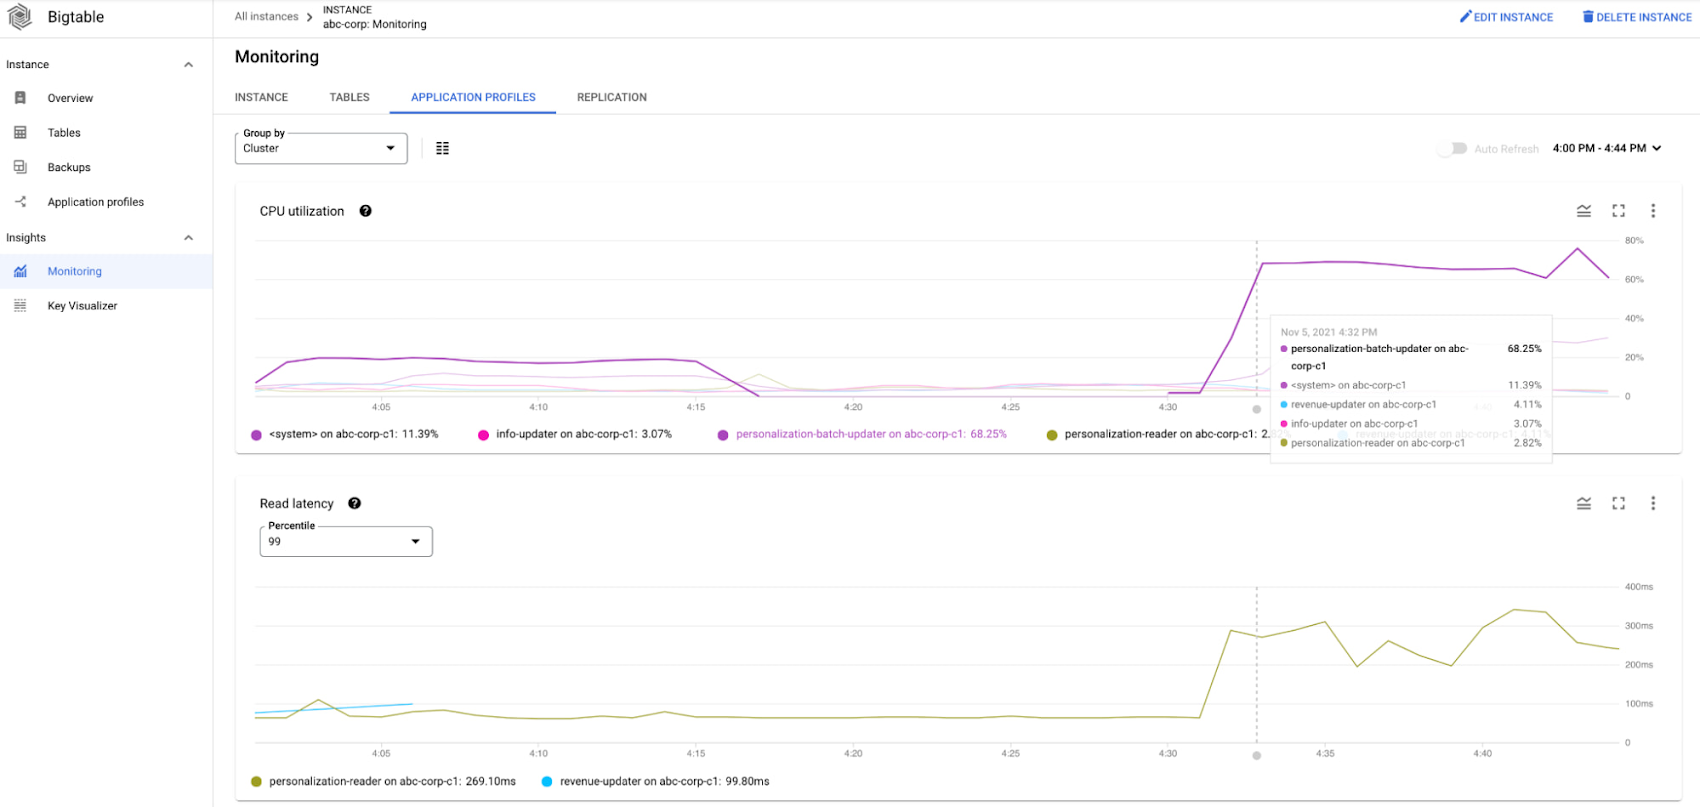

At this point, Alice knows that the personalization-batch-updater traffic is adversely impacting the personalization-reader traffic. She further digs into the dashboards in Metrics Explorer to figure out the problematic method and table.
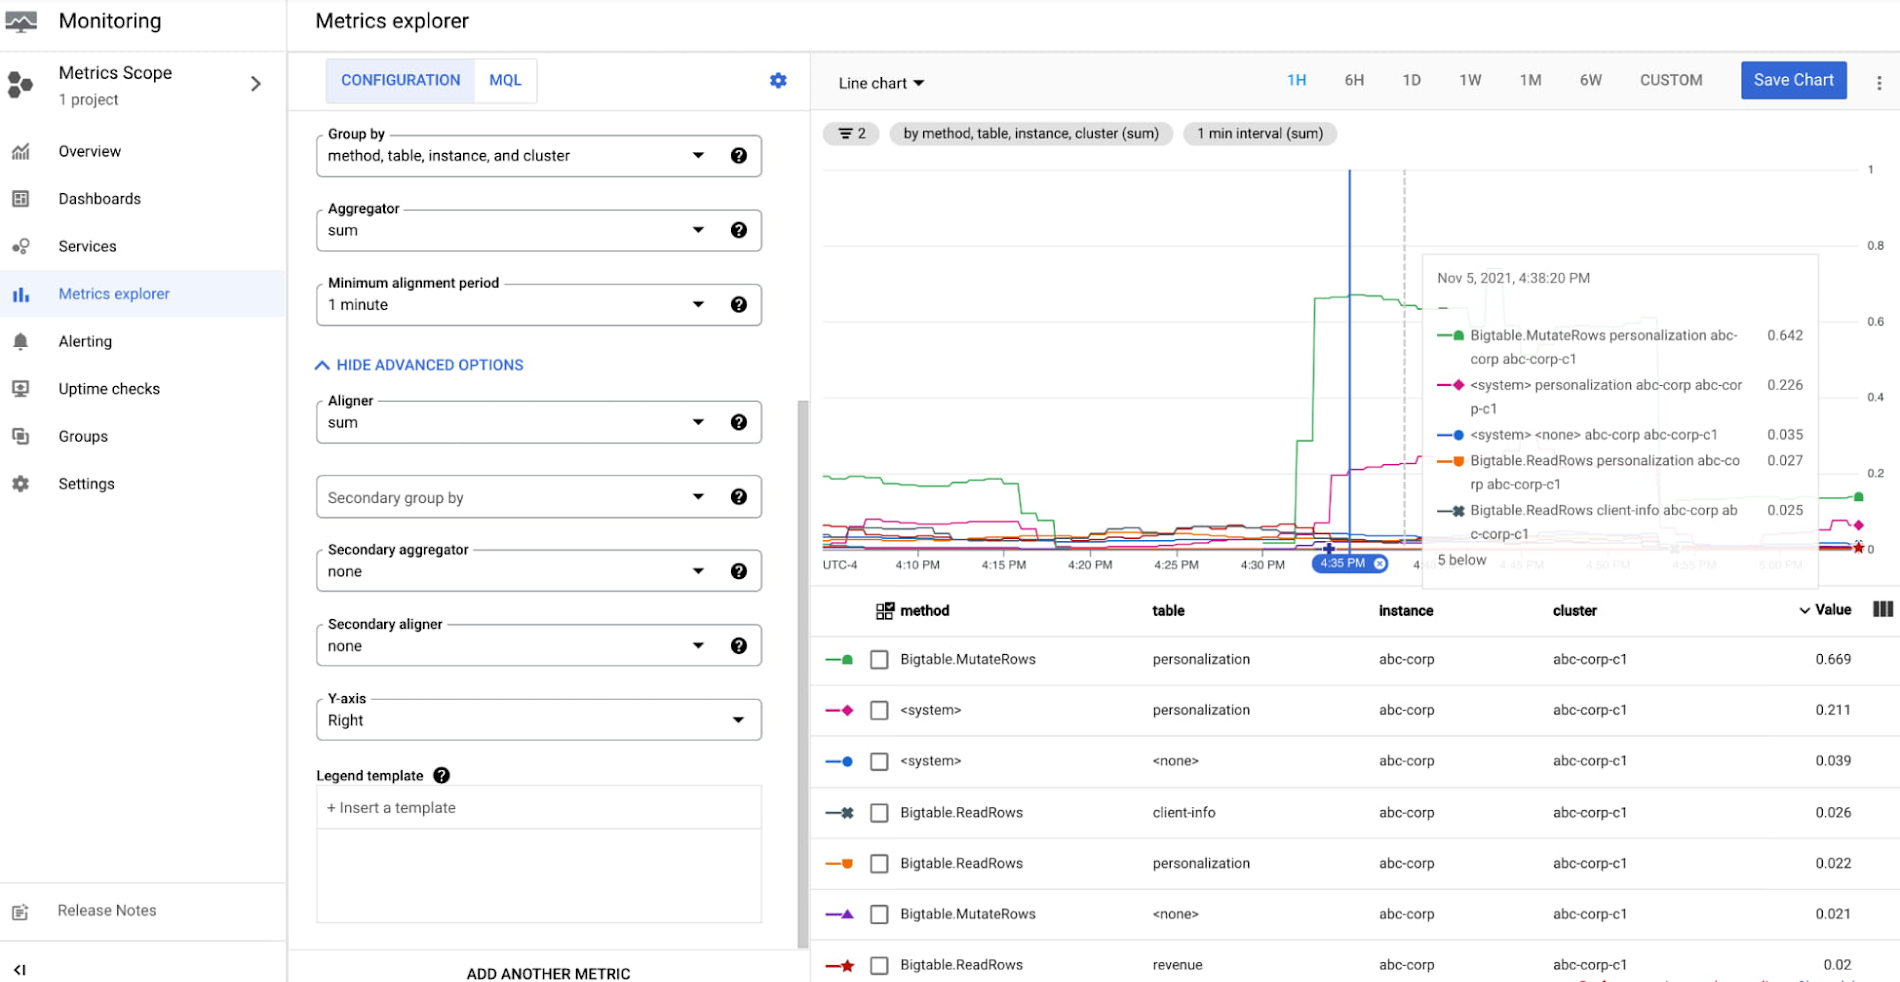

Alice has now identified the personalization-batch-updater app profile, the personalization table and the MutateRows method as the reason for the increase in CPU utilization that is causing high tail latency of the serving path traffic.
With this information, she reaches out to the personalization team to provision the cluster correctly before the batch job starts so that the performance of other tenants is not affected.
The following options can be considered in this scenario:
Run the batch job on a replicated instance with multiple clusters. Provision a dedicated cluster for the batch job and use single cluster routing to completely isolate the serving path traffic from the batch updates
Provision more nodes for the cluster before the batch job starts and for the duration of the batch job. This option is less preferred than option 1, since serving path traffic may still be impacted. However, this option is more cost effective.
User Journey: Schema and cost optimization
Target Persona: Developer
Bob is a developer who is onboarding a new workload on Bigtable. He completes the development of his feature and moves on to the performance benchmarking phase before releasing to production. He notices that both the throughput and latency of his queries are lower than what he expected and begins debugging the issue.
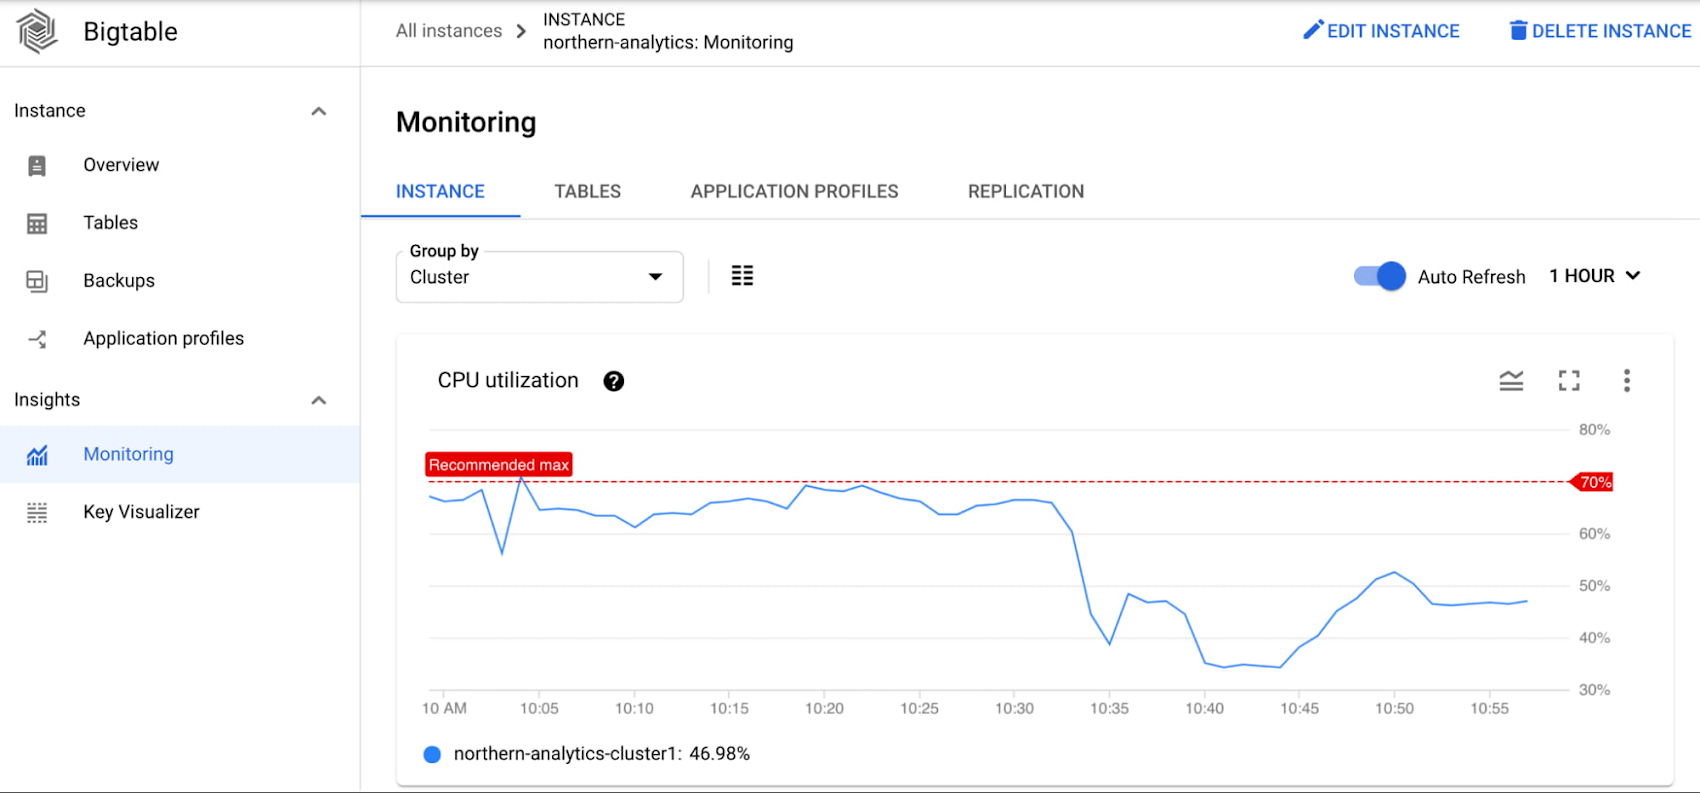
His first step is to look at the CPU utilization of the cluster, which is higher than expected and is hovering around the recommended max.
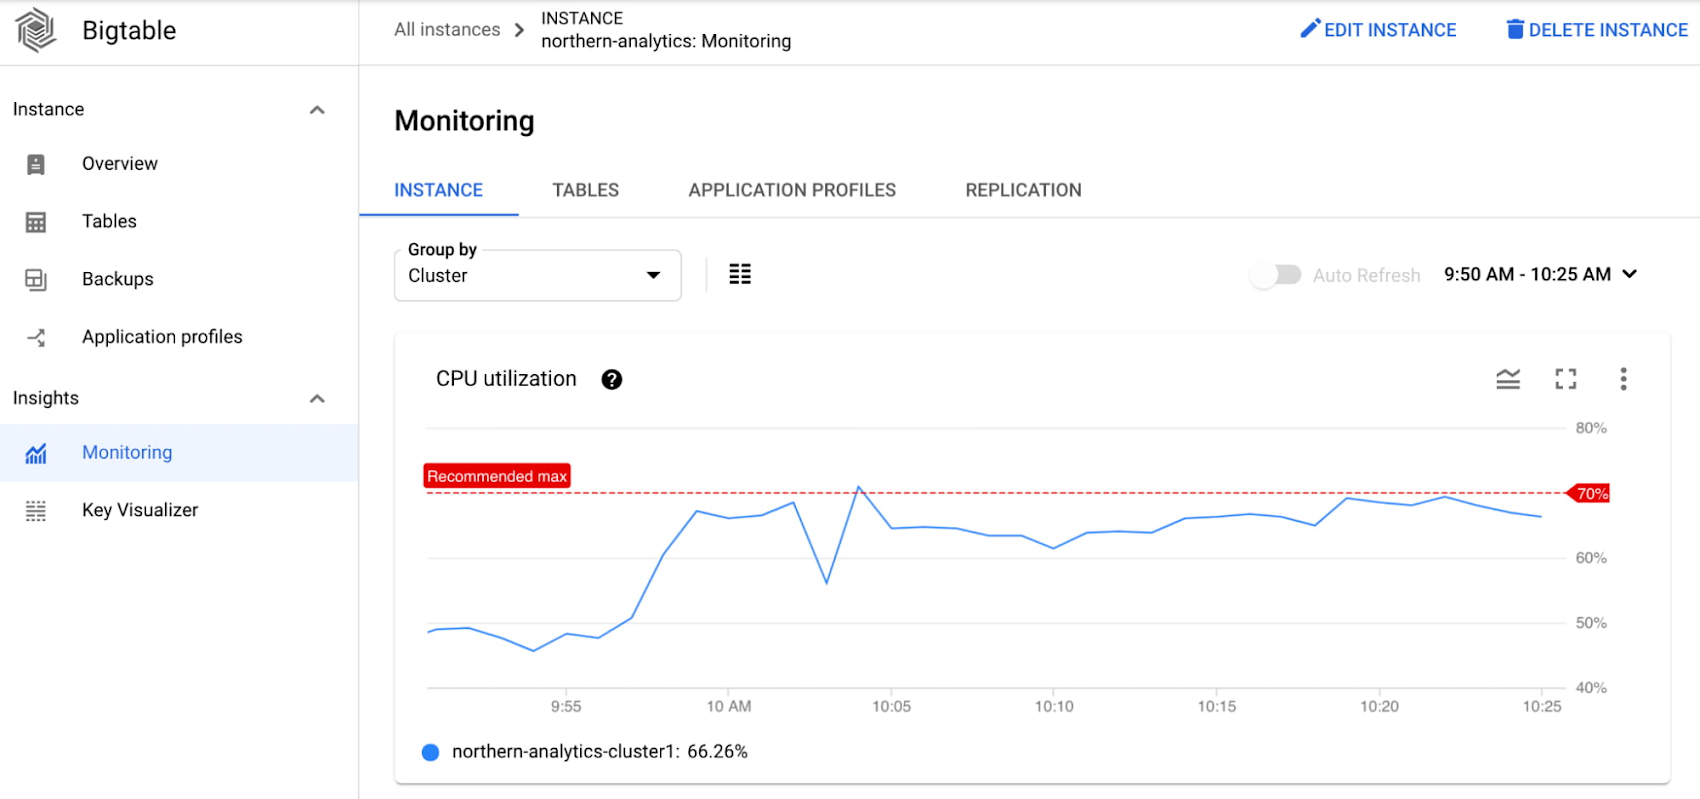

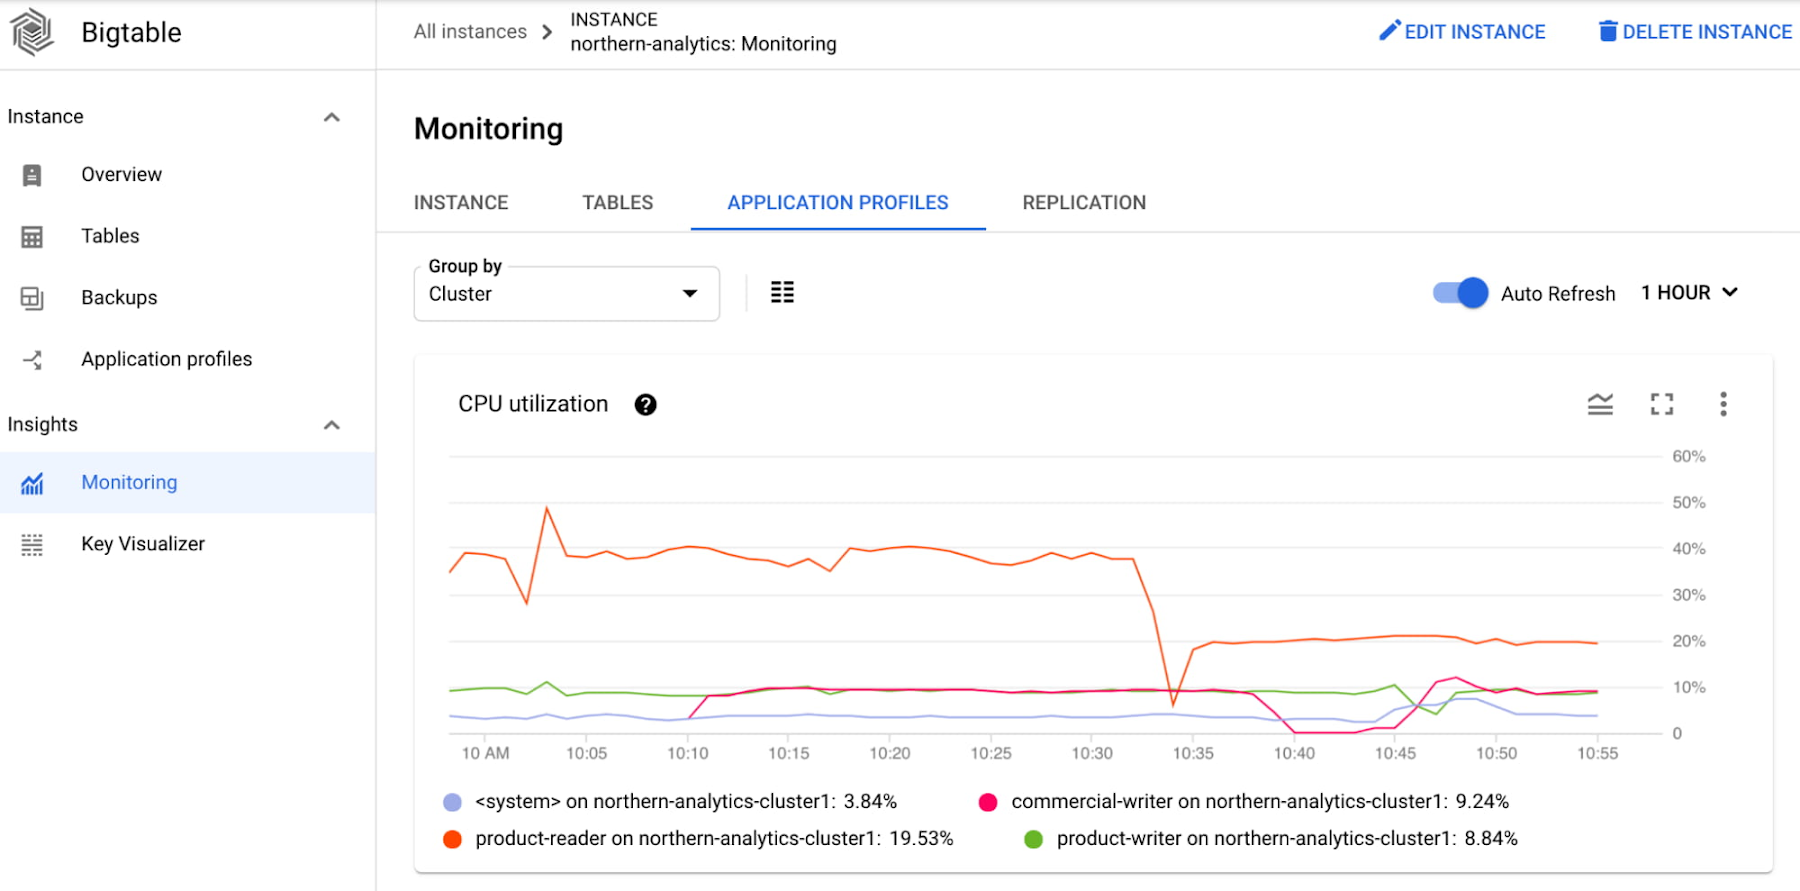
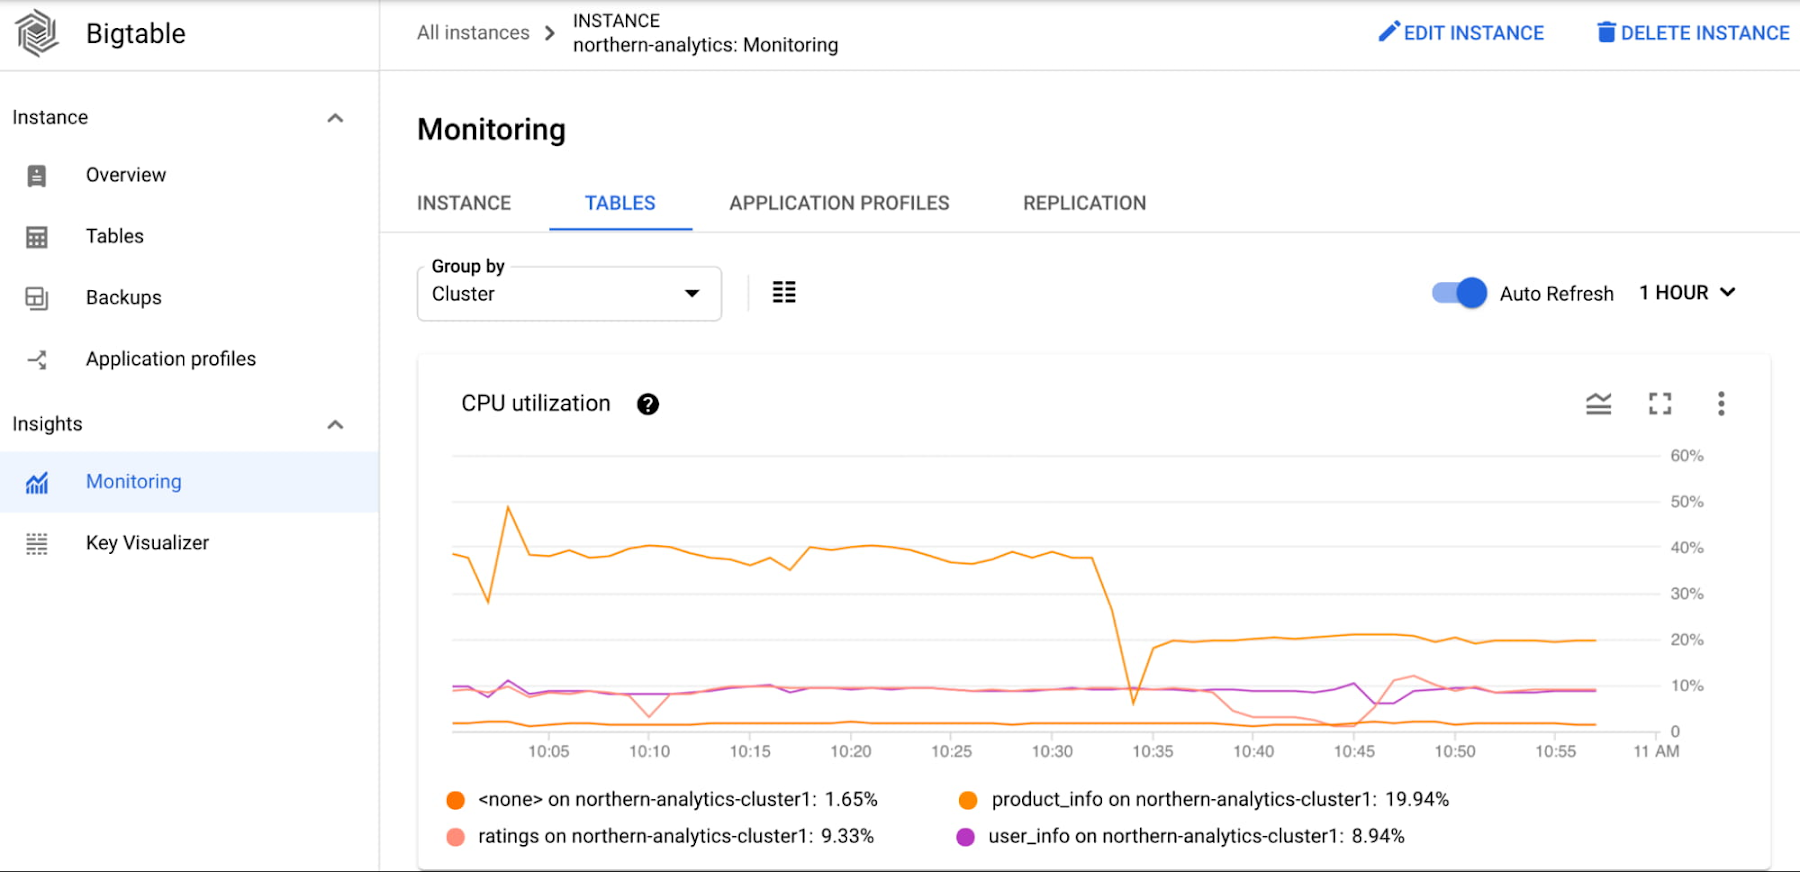
To debug further, he looks at the CPU utilization by app profile and the CPU utilization by table charts. He determines that the majority of the CPU is consumed by the product-reader app profile and the product_info table.
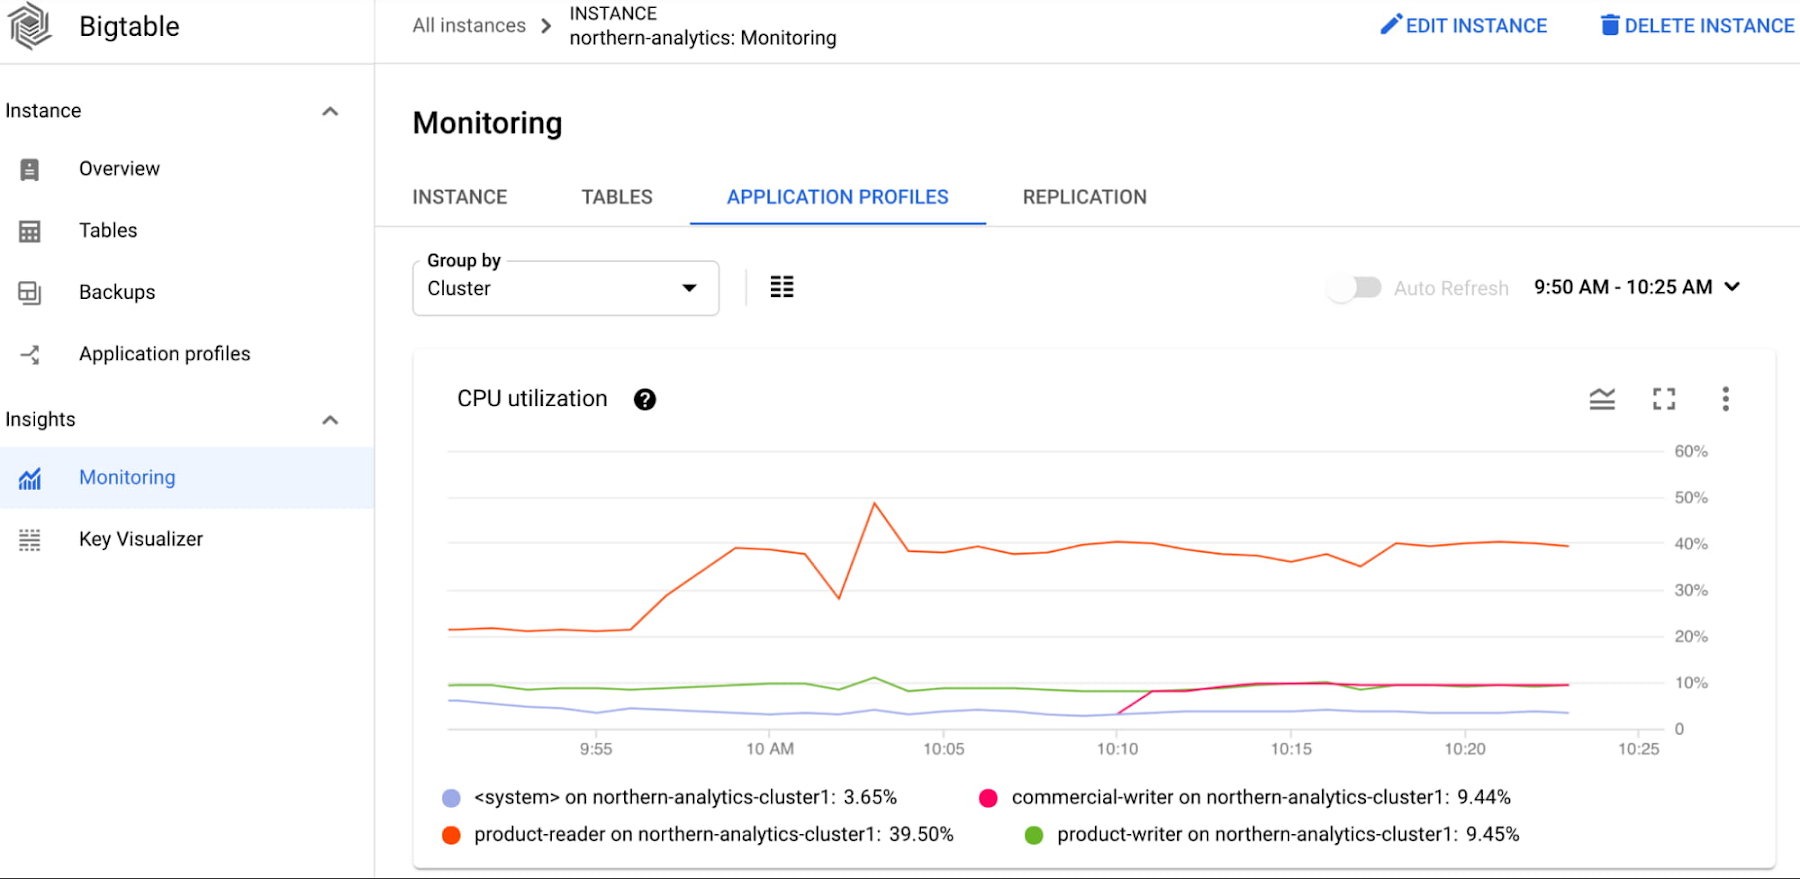

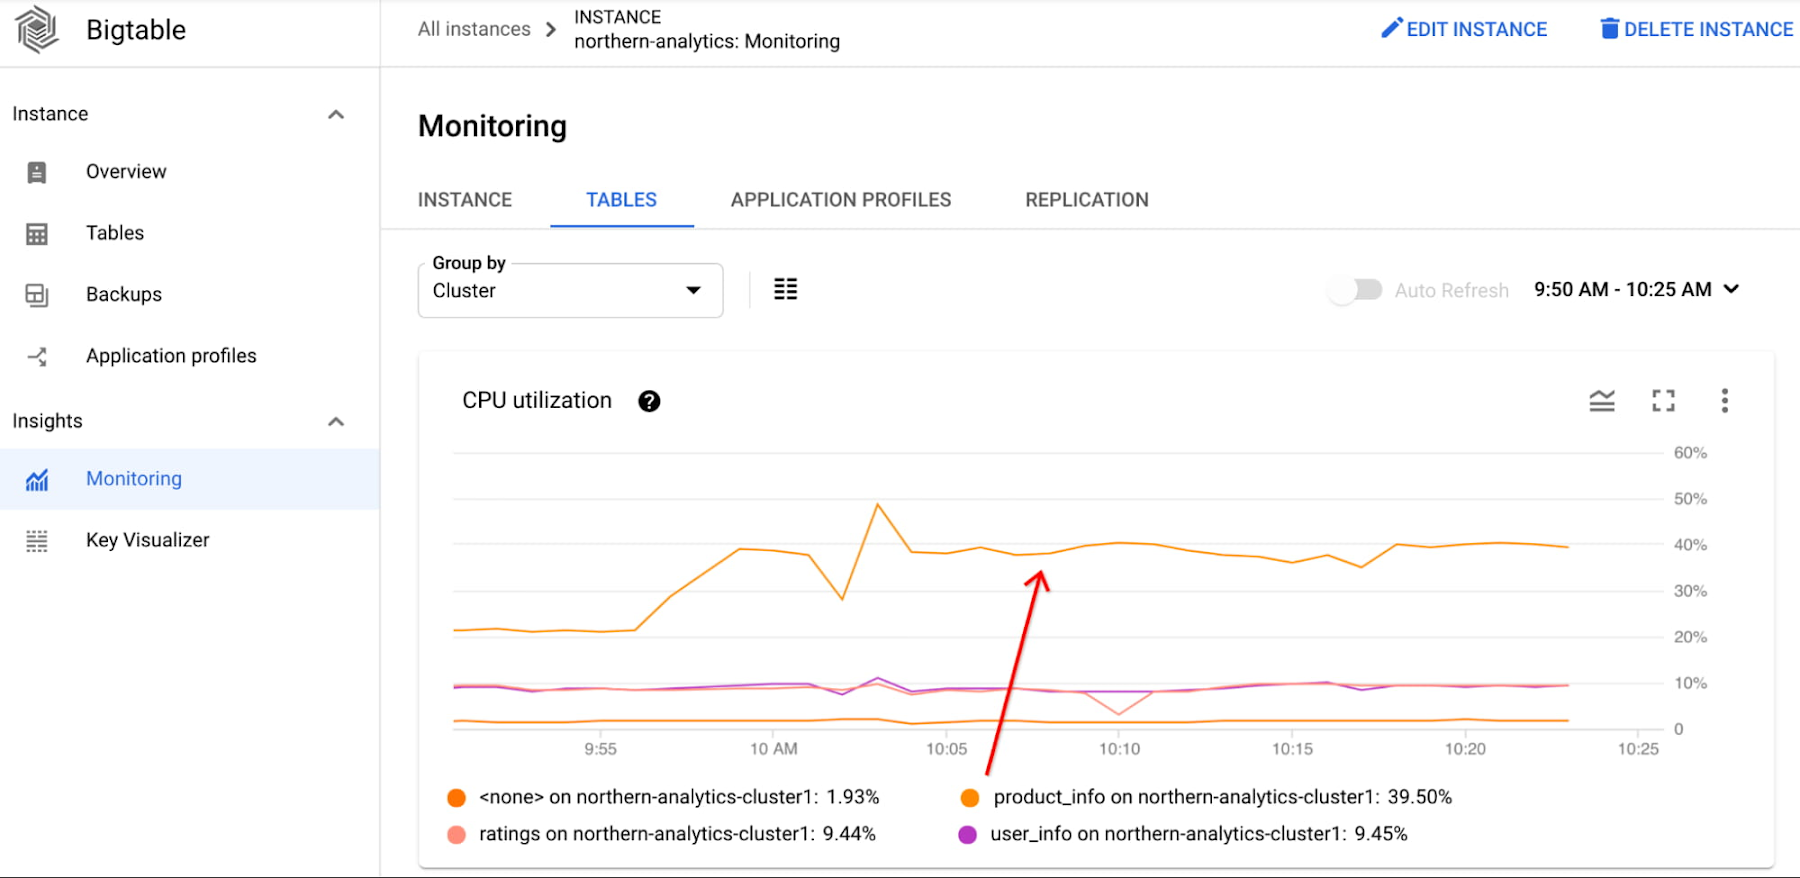

He inspects the application code and notices that the query includes a value range filter. He realizes that value filters are expensive, so he moves the filtering to the application. This leads to substantial decrease in Bigtable cluster CPU utilization. Consequently, not only does he improve performance, but he can also lower costs for the Bigtable cluster.



We hope that this blog helps you to understand why and when you might want to use our new observability metric - CPU per app profile, method and table.
Accessing the metrics
These metrics can be accessed on the Bigtable Monitoring UI under the Tables and Application Profiles tabs. To see the method breakdown, view the metric in Metrics Explorer, which you can also navigate to from Cloud Monitoring UI.
