Learn how to create alerts based on your database logs in Cloud SQL
Urszula Krukar
Software Engineer
Try Google Cloud
Start building on Google Cloud with $300 in free credits and 20+ always free products.
Free trialImagine if you could remember everything you've ever done with perfect recall. Humans may not be able to, but databases don't forget -- every single alteration to your data can be recorded and logged, from an automated backup to a query. As such, logs are extremely useful when troubleshooting database behaviour. Cloud SQL uses Cloud Logging to store various kinds of logs so you can better understand what your database is doing and when those events happen, from engine logs to Cloud SQL Auth proxy logs to audit logs.
In this blog, I will show you how to view logs for your Cloud SQL instances, create a metric based on those logs to see how many deadlocks happen in your database, and create an alert based on that metric. I’ll use Logs Explorer, a visual tool in the Cloud Console that allows for easy filtering and provides handy histograms for ease of navigation. Keep in mind that logs can also be explored using the gcloud command line tool.
Navigate to logs
The easiest way to find logs for a specific Cloud SQL instance is to:
Navigate to an instance overview page in Cloud Console
Scroll down to the "Operations and logs" card, and click "View [database engine] error logs"
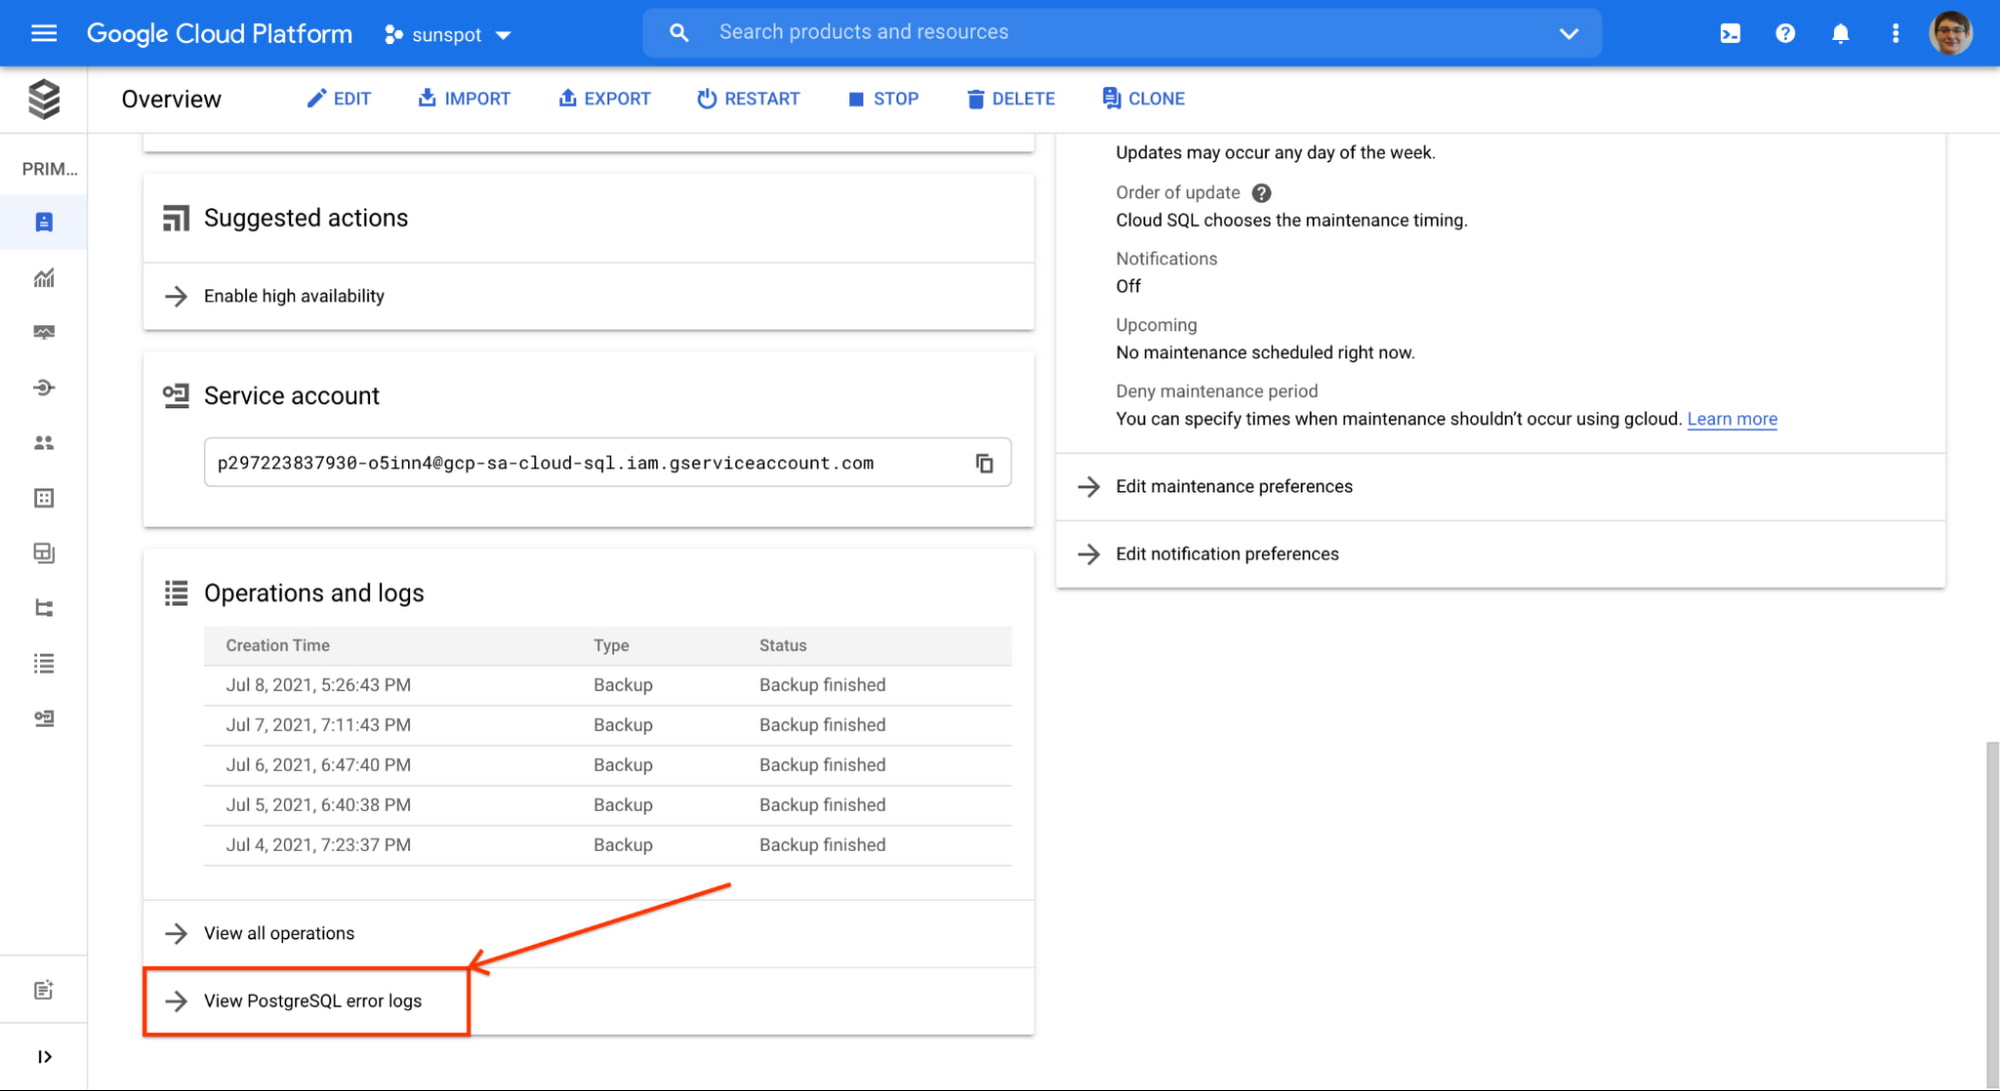

You will be redirected to Logs Explorer, pre-filtered to show logs for that specific instance.
You can filter the logs further to show only errors by using the "Log fields" filter on the left.
Once you apply the filter, you might be in the situation I found myself in: the same error (in my case "deadlock detected") showing up many times in my instance’s log list:
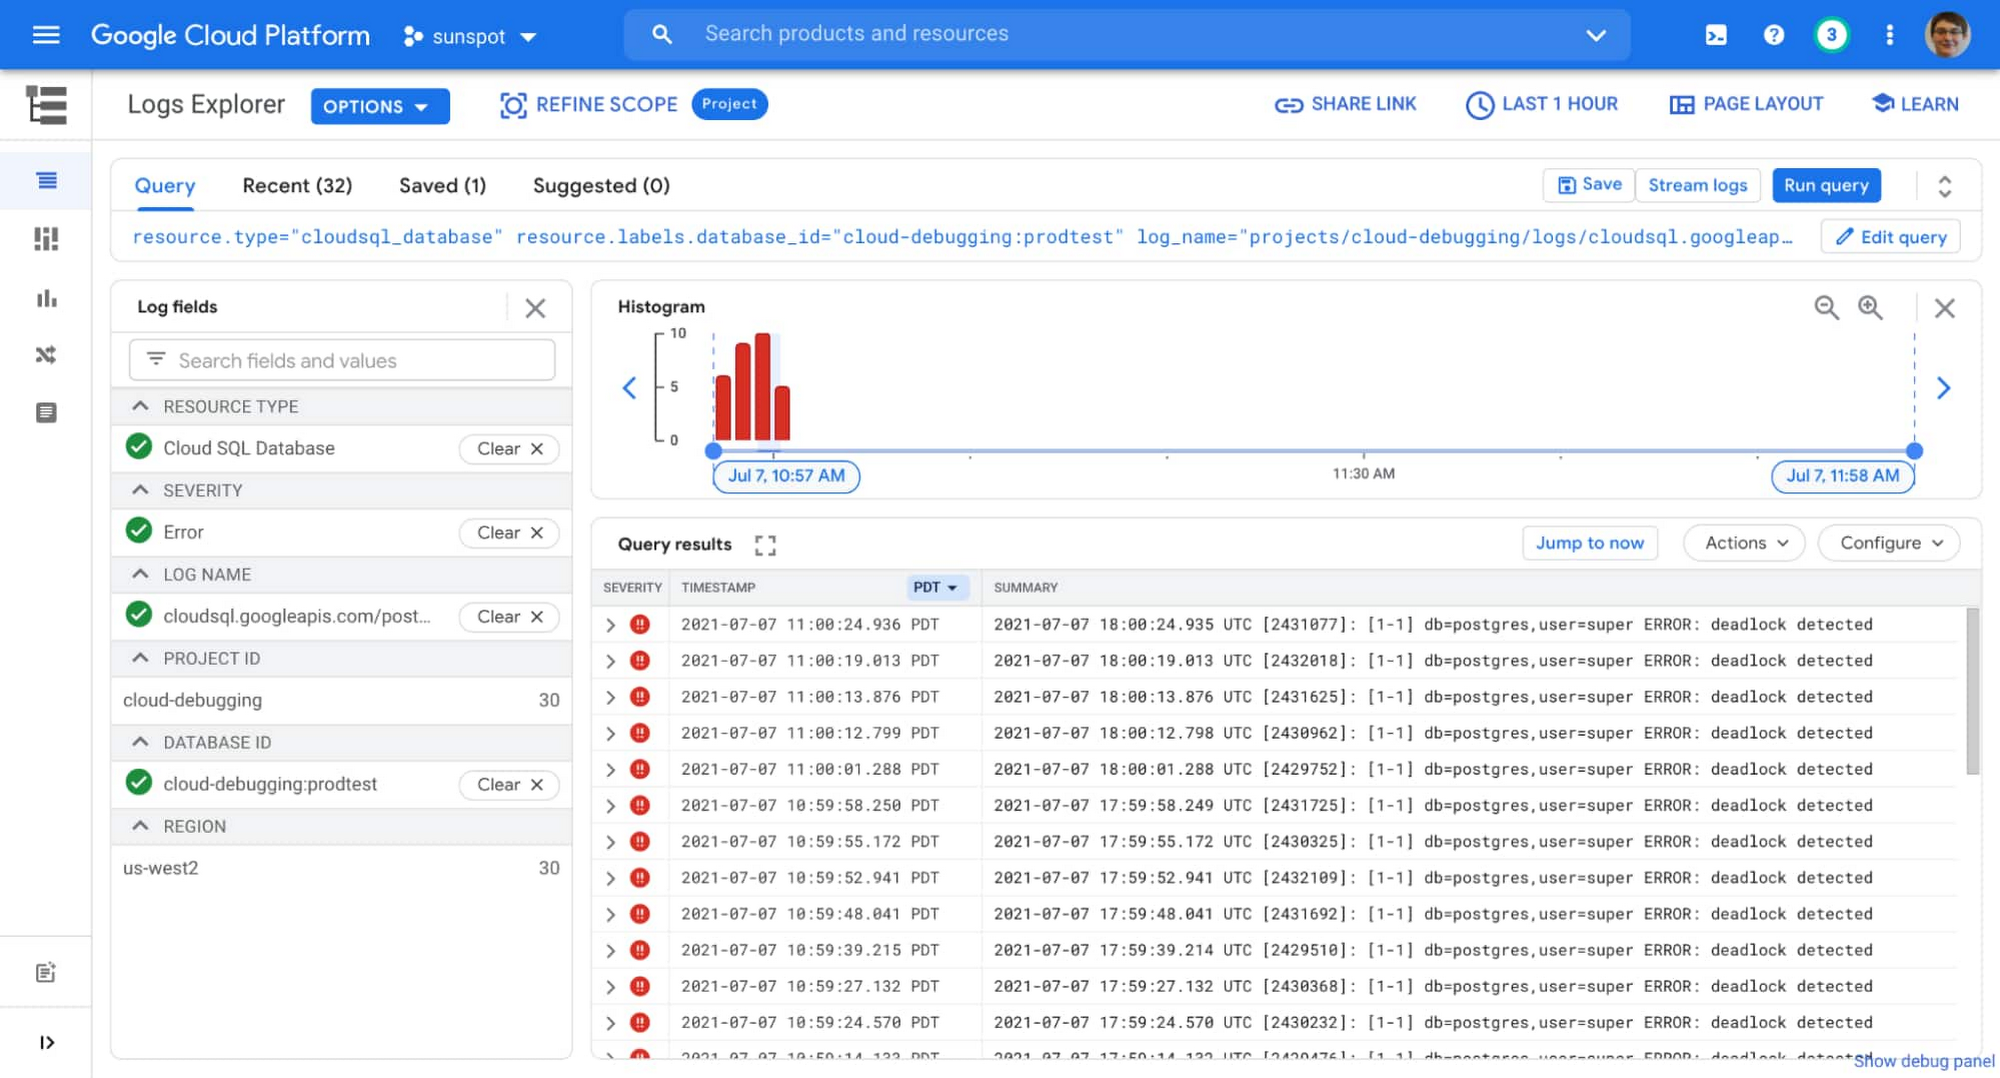

I can use the UI to investigate further, looking at how often this happens and which database it happens to (is it always the same one?). But I don’t always have to return to this list to monitor the situation. I can create a chart on my dashboard that will show me how often this is happening, and build an alert based on that chart to notify me if the situation escalates.
There is an existing metric logging.googleapis.com/log_entry_count that shows how many entries of a given severity are ingested into the logs. But I am not interested in all errors, I specifically want to know how many errors with message "deadlock detected" were logged, and which databases in my instance are affected.
Here’s where logs-based metrics enter the picture, a way to create time series metrics based on the content of your logs.
Creating logs-based metric
The log entry I am interested in has a very specific format (you can see it if you expand any of query results shown in the image above):
This means I can parse database and user information from the log, and add that info as labels to my logs-based metric.
Following these instructions I create a following logs-based metric:
name: pg_deadlocks
metric type: counter
filter selection (notice how it matches values from sample log entry above):
"database" label:
field name: textPayload
regular expression: db=(\w+)
"user" label:
field name: textPayload
regular expression: user=(\w+)
Cloud Console is really helpful when creating labels, it provides a preview UI for the regular expression (see the words highlighted in green on this screenshot):
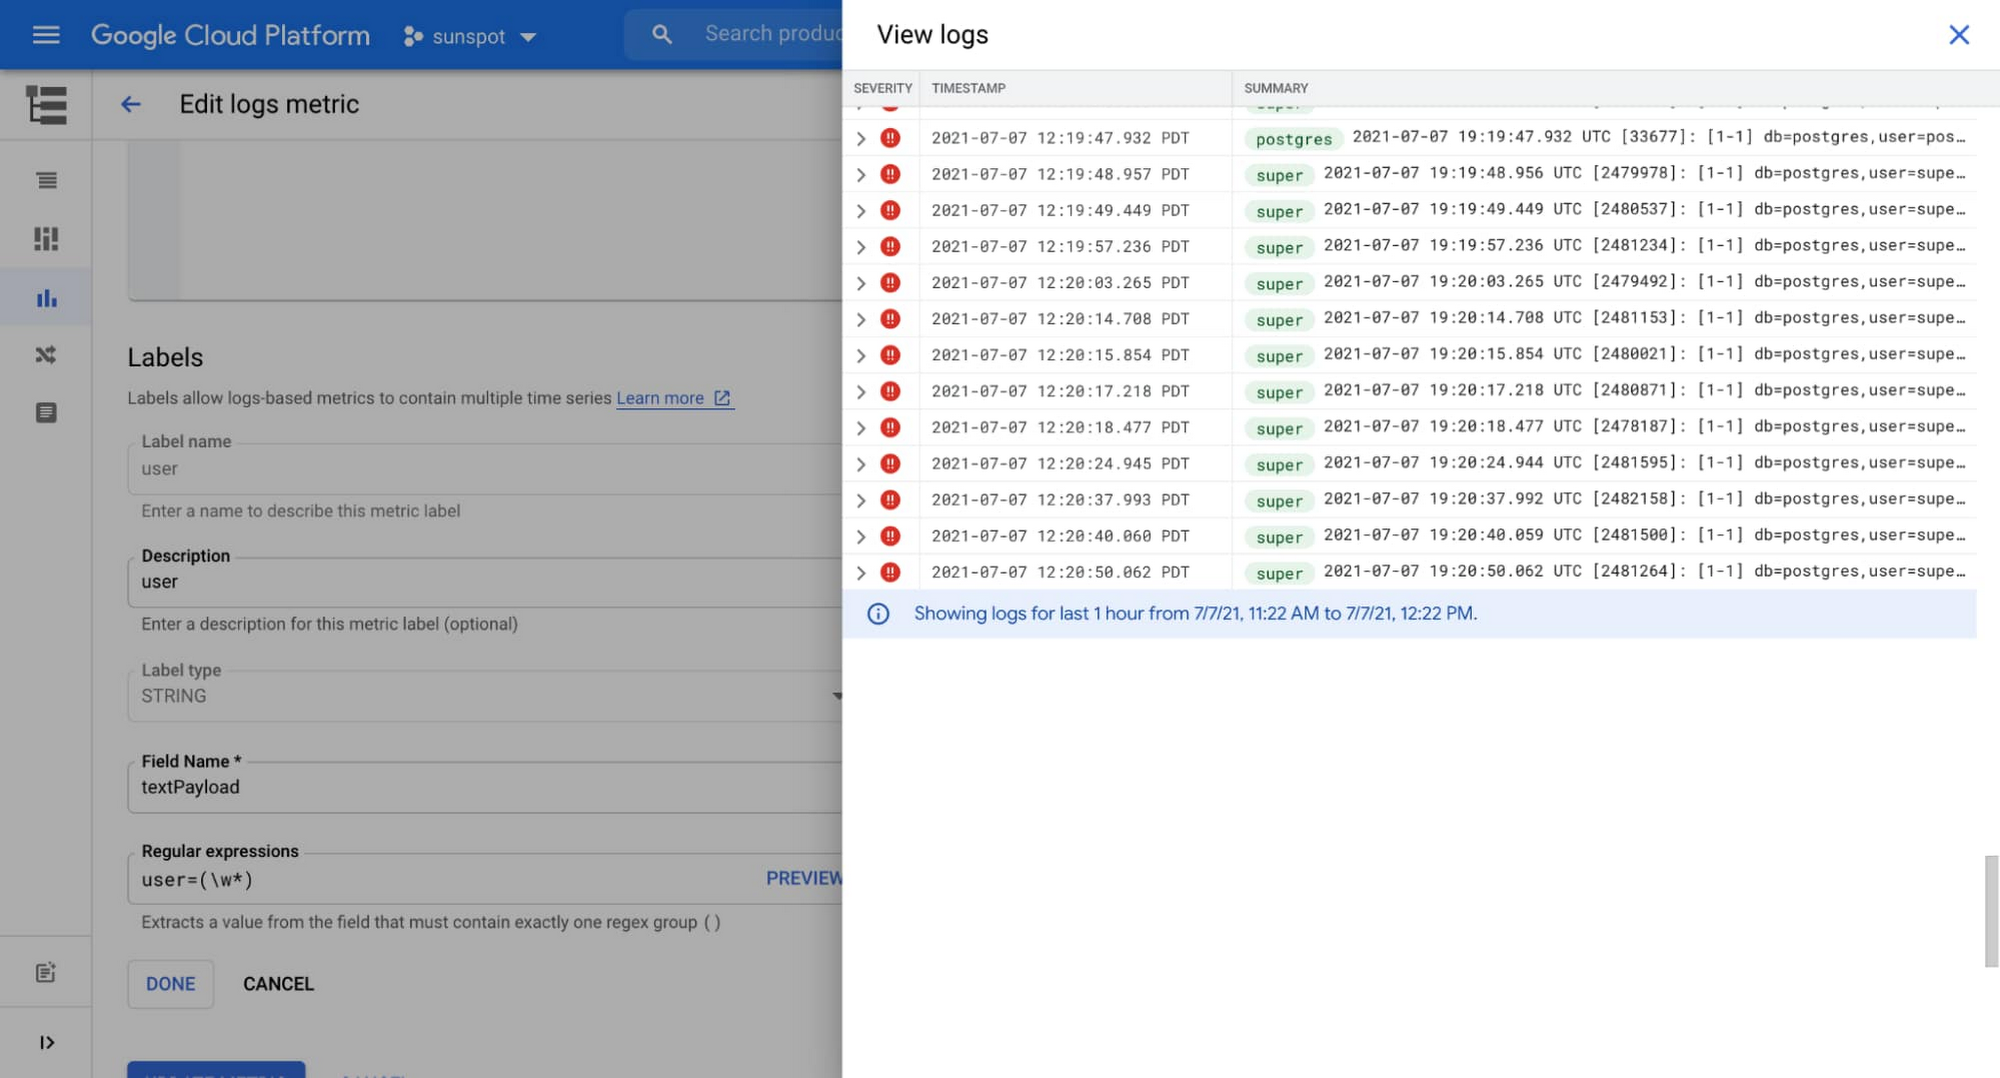

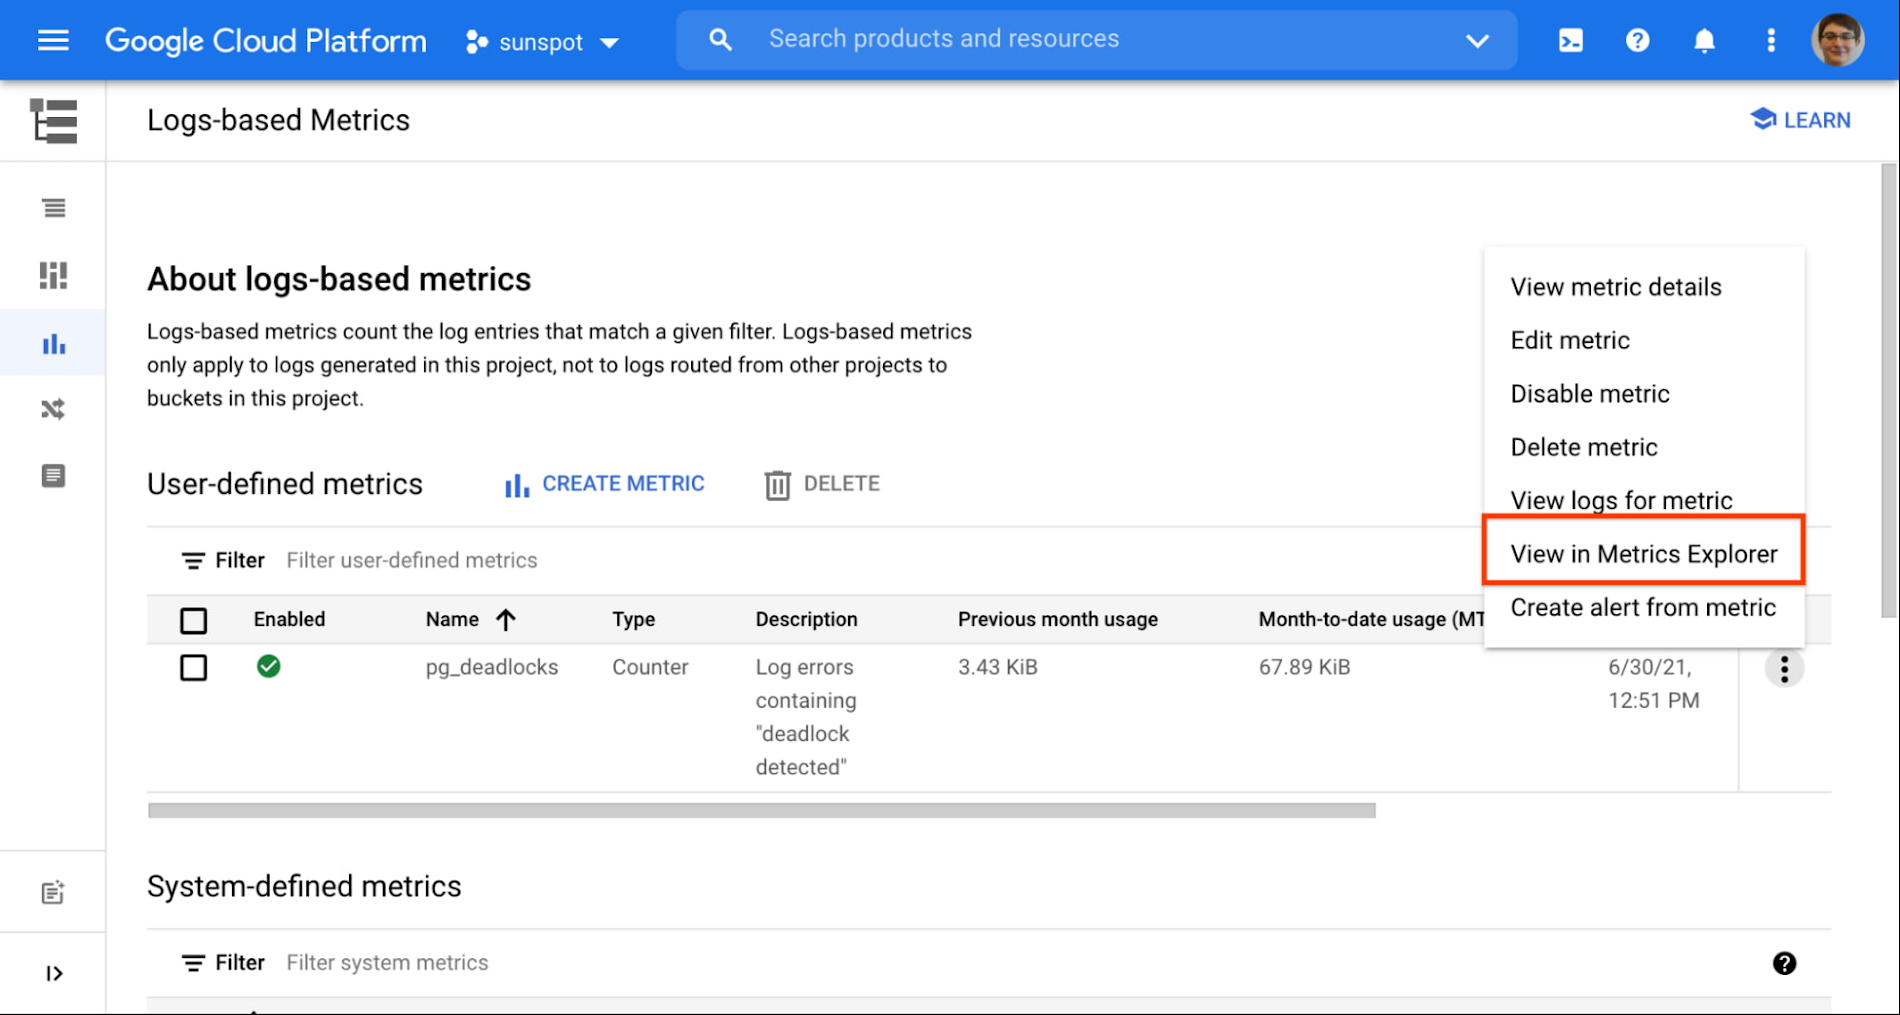
After a couple of minutes my newly created metric starts showing some data. I use the handy link to see the metric in Metrics Explorer:

I confirm that data is gathered correctly, and both user and database information is extracted:
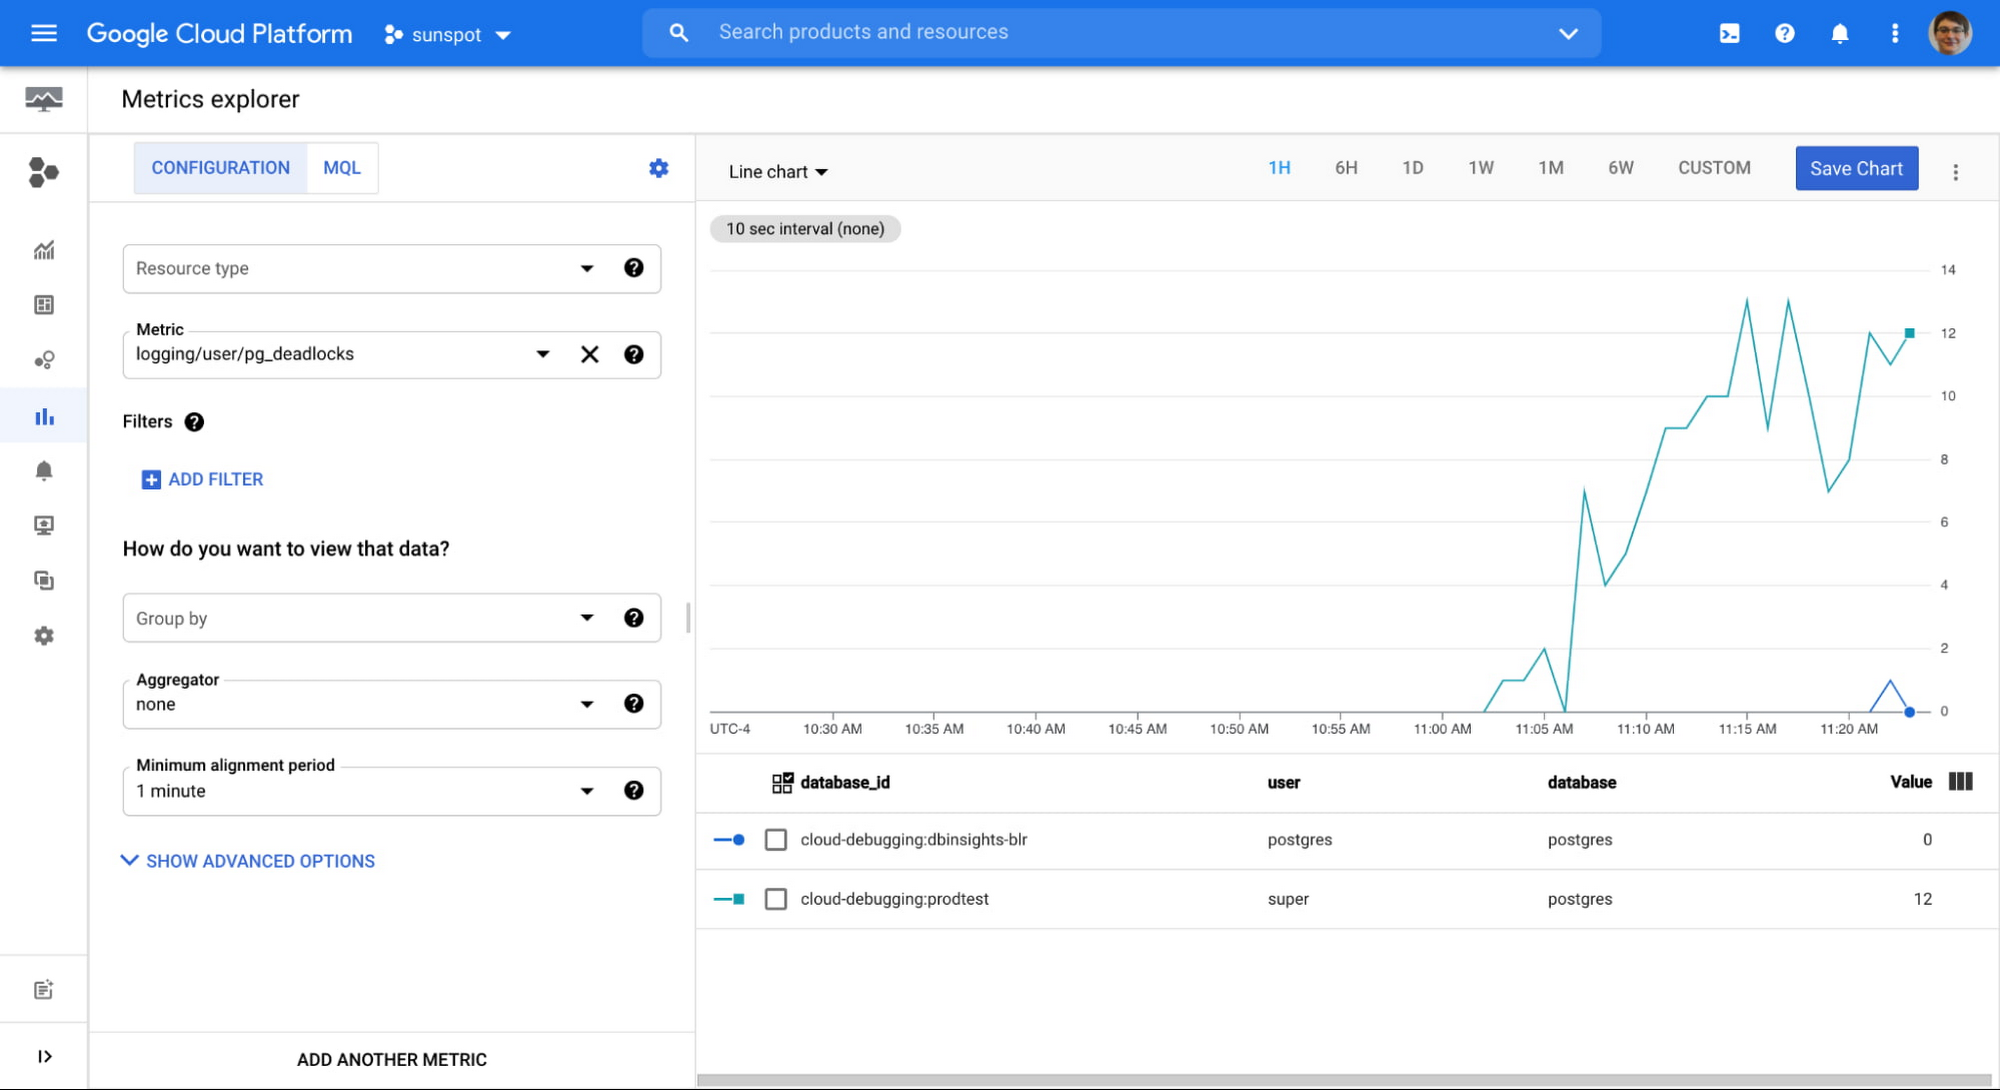

From this point on, this metric behaves as any other system metric: you can add it to dashboards, or create alerts based on the value. You can even export them to your Application Performance Monitoring (APM) tool of choice.
Important notes about logs-based metrics:
They start gathering data from the moment the metric is created, there is no backfill,
They need to be defined in each GCP project separately,
They are chargeable metrics, consult pricing documentation.
This is just one example of additional value you can get from your logs. You can use the same steps to create more metrics, creating Insights specific to your particular situation.
Try this on your Cloud SQL instance today!

