Sqlcommenter now extending the vision of OpenTelemetry to databases
Nimesh Bhagat
Product Management, Google Cloud
Try Google Cloud
Start building on Google Cloud with $300 in free credits and 20+ always free products.
Free trialDatabase observability is important to every DevOps team. In order to troubleshoot a slow running application, developers, DBAs, data engineers or SREs use a variety of tools for Application Performance Monitoring (APM) that need access to database activity. This makes it imperative for database telemetry to be easily accessible and integrated seamlessly with your choice of tooling to get end-to-end observability. And that’s why today, we’re announcing that we are merging Sqlcommenter, an open source object-relational mapping (ORM) auto-instrumentation library, with OpenTelemetry, an open source observability framework. This merge will enable application-focused database observability with open standards.
To easily correlate application and database telemetry, we open-sourced Sqlcommenter earlier this year, which was followed by great adoption from the developer community. Sqlcommenter enables object–relational mappings (ORMs) to augment SQL statements before execution, with comments containing information about the application code that caused its execution. This simplifies the process of correlating slow queries with source code, and provides insights into backend database performance. Sqlcommenter also allows OpenTelemetry trace context information to be propagated to the database, enabling correlation between application traces and database query plans.
The following example shows a query log with SQL comments added by Sqlcommenter for the Sequelize ORM.
Application developers can use observability information from Sqlcommenter to analyze slow query logs; or that observability information can be integrated into other products such as Cloud SQL Insights or APM tools from Datadog, Dynatrace, and Splunk to provide application-centric monitoring.
Extending the vision of OpenTelemetry to Databases
OpenTelemetry, which is now the second most active Cloud Native Computing Foundation (CNCF) open-source project behind Kubernetes, makes it easy to create and collect telemetry data from your services and software, then forward that data to a variety of Application Performance Monitoring tools. But before today, OpenTelemetry lacked a common standard by which application tags and traces can be sent to databases and correlated with an application stack. To extend the vision of OpenTelemetry to databases, we merged Sqlcommenter with OpenTelemetry to unlock a rich choice of tools for database observability for developers. Bogdan Drutu, Co-founder of OpenCensus & OpenTelemetry and Senior Principal Software Engineer, Splunk, offered his perspective;
“With Google Cloud’s Sqlcommenter contribution to OpenTelemetry, a vendor-neutral open standard and library will enable a rich ecosystem of Application Performance Monitoring tools to easily integrate with databases, unlocking a rich choice of tools for database observability for the developers."
OpenTelemetry, Google Cloud and our partners
We believe that a healthy observability ecosystem is necessary for end-to-end application stack visibility and this is reflected in our continued commitment to open-source initiatives. This belief is shared by other key contributors to the ecosystem including Datadog, Dynatrace and Splunk:
Datadog
"Visibility into database performance and its impact on applications is critical to engineering. A poorly performing query can impact every other layer of the stack making troubleshooting difficult. Sqlcommenter bridges the gap between application requests and database queries, allowing APM users to troubleshoot requests in their entirety at all levels, from frontend to data tiers. As early contributors to OpenTelemetry, we are extremely pleased to see this contribution from Google Cloud as it brings us closer to the vision of open standards based observability." - Ilan Rabinovitch, SVP Product, Datadog
Dynatrace
“Observing datasets across thousands of companies, we’ve identified database access patterns and performance as among the top reasons for poor performing applications. Dynatrace, a core contributor to OpenTelemetry, natively supports telemetry data generated by Sqlcommenter in problem analysis, change detection, and real-time optimization analytics. We see the combination of Sqlcommenter and OpenTelemetry helping developers understand the impact of their database queries and make it easier to collaborate to optimize application performance.”—Alois Reitbauer, VP, Chief Technology Strategist, Dynatrace
Splunk
"Splunk and Google have been behind OpenTelemetry since day one, and the merging of Sqlcommenter to OpenTelemetry means Splunk Observability Cloud customers can further empower developers with application centric database monitoring, accelerating their DevOps journeys for databases.”—Morgan McLean, Co-founder of OpenCensus & OpenTelemetry and Director of Product Management, Splunk
An example of how Cloud SQL Insights uses Sqlcommenter to simplify observability for developers
Troubleshooting databases is hard in modern application architectures
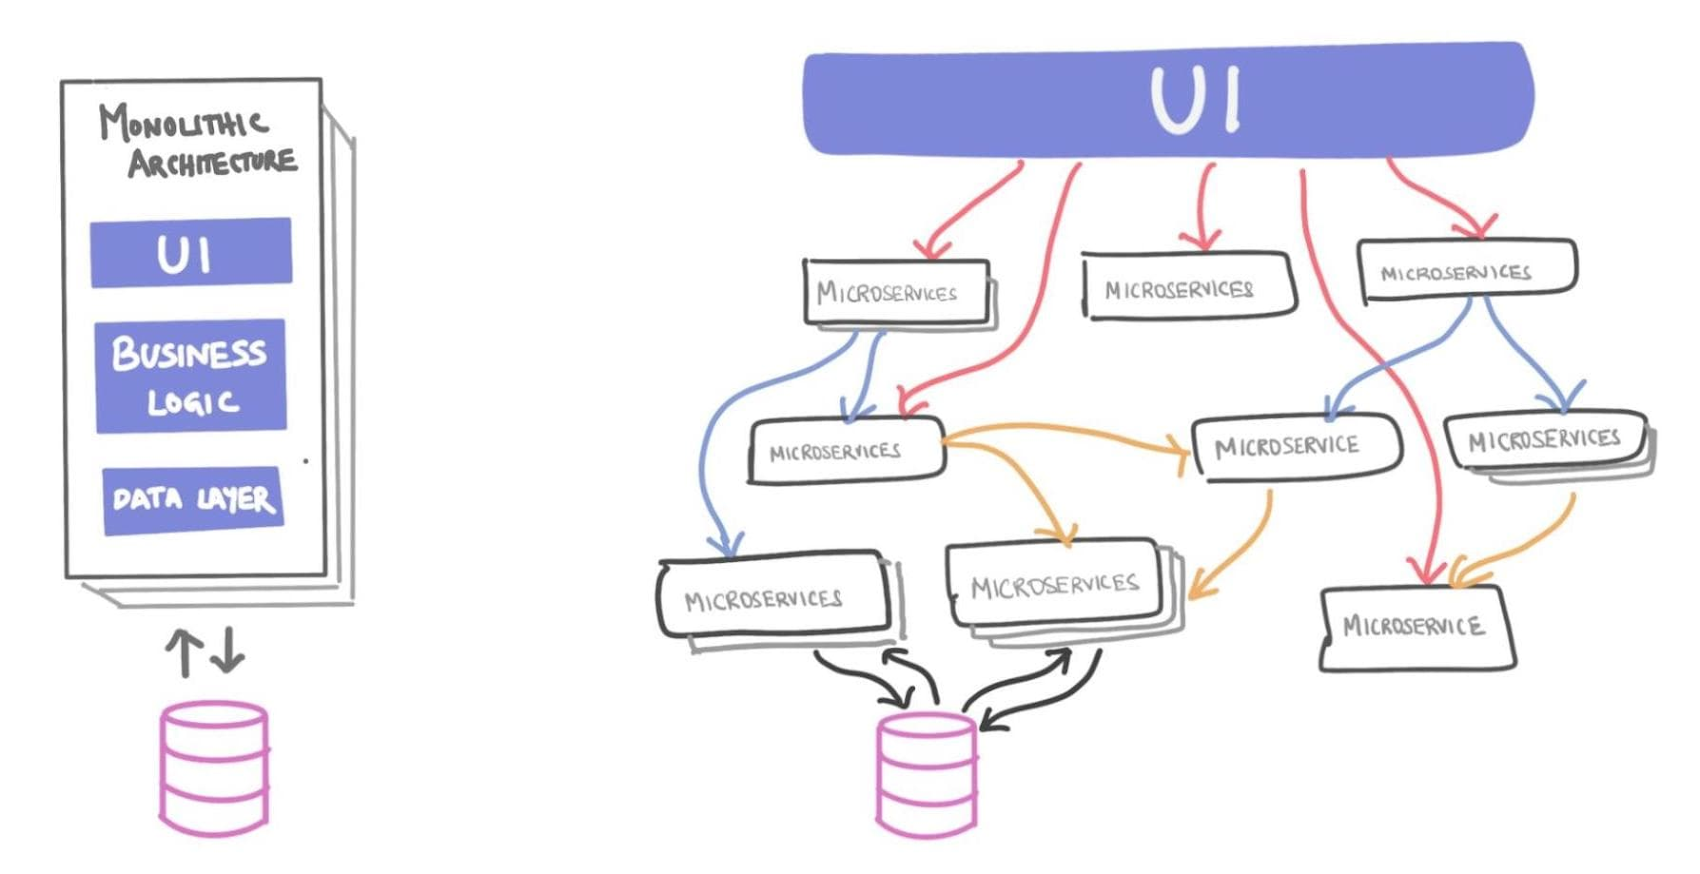
Today’s microservice-based architectures redefine an application as an interconnected mesh of services as seen in the picture below, many of which are third-party and/or open-source. This can make it challenging to understand the source of system performance issues. When a database is involved, it becomes even harder to correlate application code with database performance. Cloud SQL Insights leverages Sqlcommenter to simplify database troubleshooting in distributed architectures.

Application-centric database monitoring
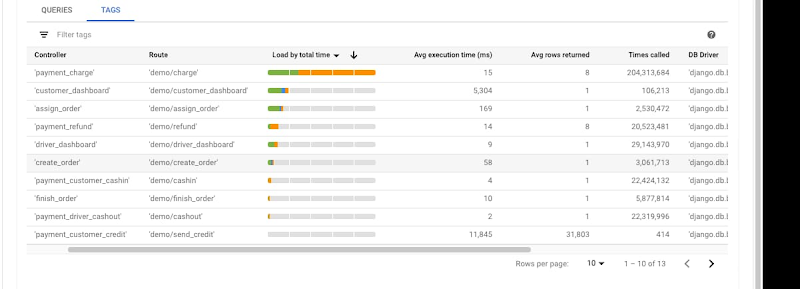
If you are an on-call engineer and an alert goes off indicating a database problem, it can be hard to identify which microservices may be impacting your databases. Existing database monitoring tools only provide a query-centric view, leaving a disconnect between application and queries. To empower developers to monitor their databases through the lens of an application, Cloud SQL Insights uses the information sent by Sqlcommenter to identify the top application tags (model, view, controller, route, user, host etc.) that are sent by the application. As seen in the following Insights dashboard example, users can get a holistic view of performance organized by business function rather than by query, making it easy to identify which service is causing the database to be slow.

End-to-end tracing
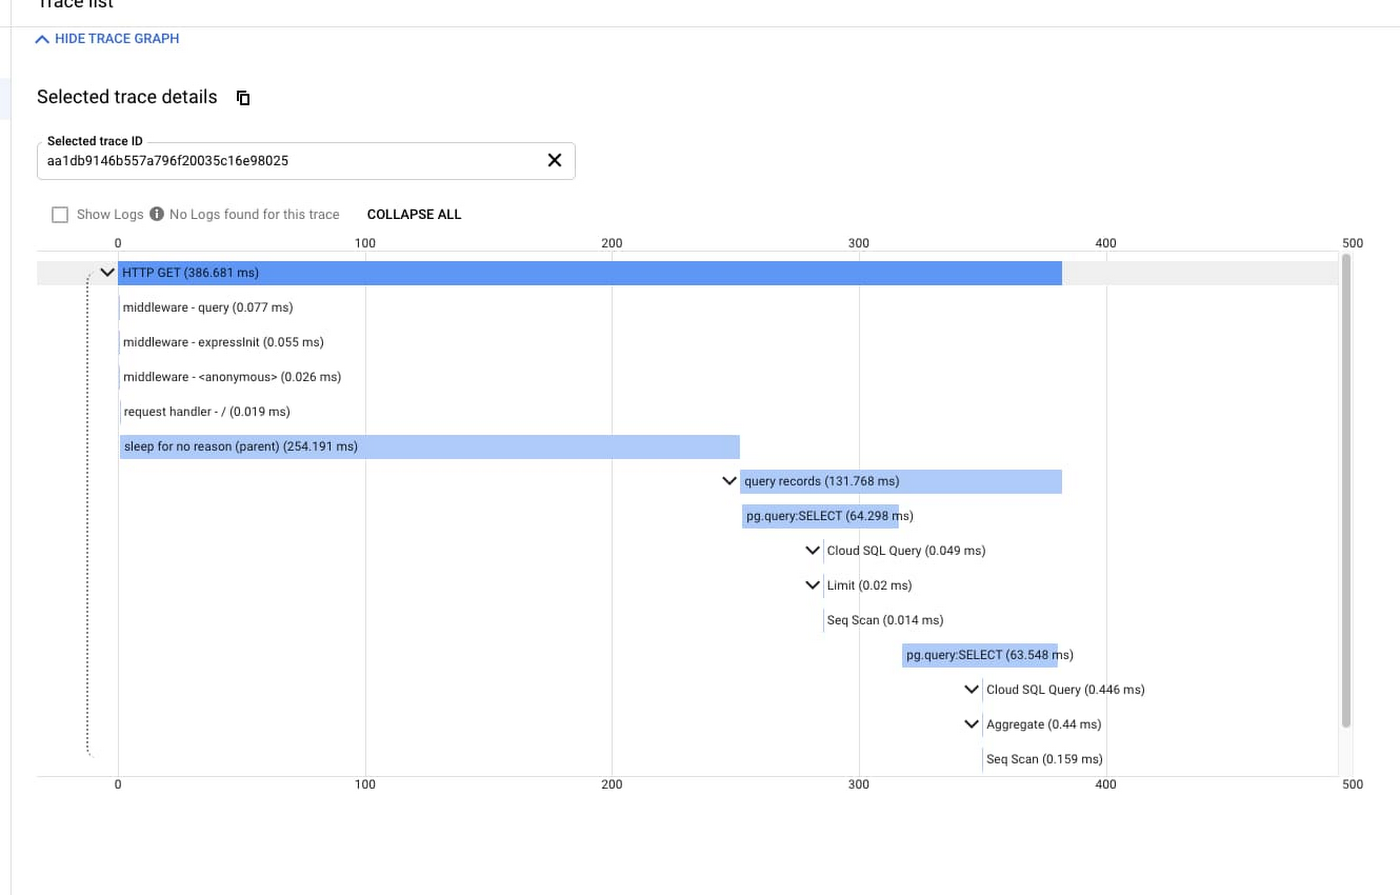
Knowing which microservice and query is causing the problem is not enough; you also need to quickly detect which part of the application code is causing the problem. To get an end-to-end application trace, Sqlcommenter allows OpenTelemetry trace context information to be propagated to the database. With Cloud SQL Insights, query plans are generated as traces with the traceparent context information from the SQL comments. Since the trace id is created by the application, and the parent span id and trace id is sent to the database as SQL comments, end-to-end tracing from application to database is now possible. The example below shows application trace spans from OpenTelemetry along with query plan trace spans from the NodeJS Express Sqlcommenter library.
