From petabytes to predictions: Easy BigQuery insights in Google Sheets
Tarak Parekh
Sr. Product Manager, BigQuery
Laura Gagliano
Sr. Product Manager, Workspace
Many organizations’ single source of truth is data that resides in BigQuery, Google’s governed, secure and petabyte-scale data platform. However, the "last mile" of ad-hoc analysis, modeling, and reporting often happens where business users are most comfortable: Google Sheets.
Bridging this gap usually involves exporting data as CSVs. But this is inefficient, creating data silos, version control problems, and security and governance risks. Connected Sheets helps to eliminate this trade-off, turning the familiar Google Sheets interface into a direct, live window into your BigQuery data platform, letting you analyze petabytes of data quickly, securely, and easily.
In this post, we’ll do a quick overview of Connected Sheets, walk through real-world use cases, and show you how to perform enterprise-grade data analysis using BigQuery directly in Google Sheets.
A live window into the single source of truth
Business users often wait days or weeks for simple reports. Connected Sheets solves this by letting you analyze your critical data via a secure, direct connection to billions of rows of live data, with no SQL required.
For data admins, this architecture is appealing because it maintains a strong security and governance posture. They can provision access to specific tables or views, confident that the underlying data cannot be altered from a Connected Sheet. Admins can also take advantage of Google Workspace’s enterprise data protections to control reading, sharing, and copying data throughout its lifecycle.
For end users, the benefit is immediate agility and ease of use. They can use familiar tools like pivot tables, charts, calculated columns, and formulas to analyze billions of rows of live data as if it were a local file, balancing centralized control with the business's demand for speed. End users don’t have to learn technical concepts like databases, schemas, tables, and query languages like SQL to access, analyze, and visualize the data.

Key use cases and core journeys
We consistently hear about three primary use cases for Connected Sheets from customers across industries.
1. Self-service exploratory analysis: Data teams provide access to curated tables and datasets in BigQuery. Business Analysts in sales, operations, finance, or marketing can then build their own pivot tables or charts that run over the entire live data source directly from Sheets, then filter data to answer day-to-day questions, freeing the data team from a constant backlog of ad-hoc requests.
Example: Deep-dive investigation
-
Scenario: A sales manager analyzes millions of global transactions to review quarterly performance.
-
Action: Using a Connected Sheets pivot table, they quickly create a pivot table to summarize revenue by region and product line. When they spot an anomaly — an unexpected revenue spike in EMEA, for example — they simply double-click the summarized value to drill down and learn more about exactly what led to that value.
- Outcome: Connected Sheets instantly queries and retrieves the precise, granular transaction rows behind that summary value, making it easy and fast to find the root cause.
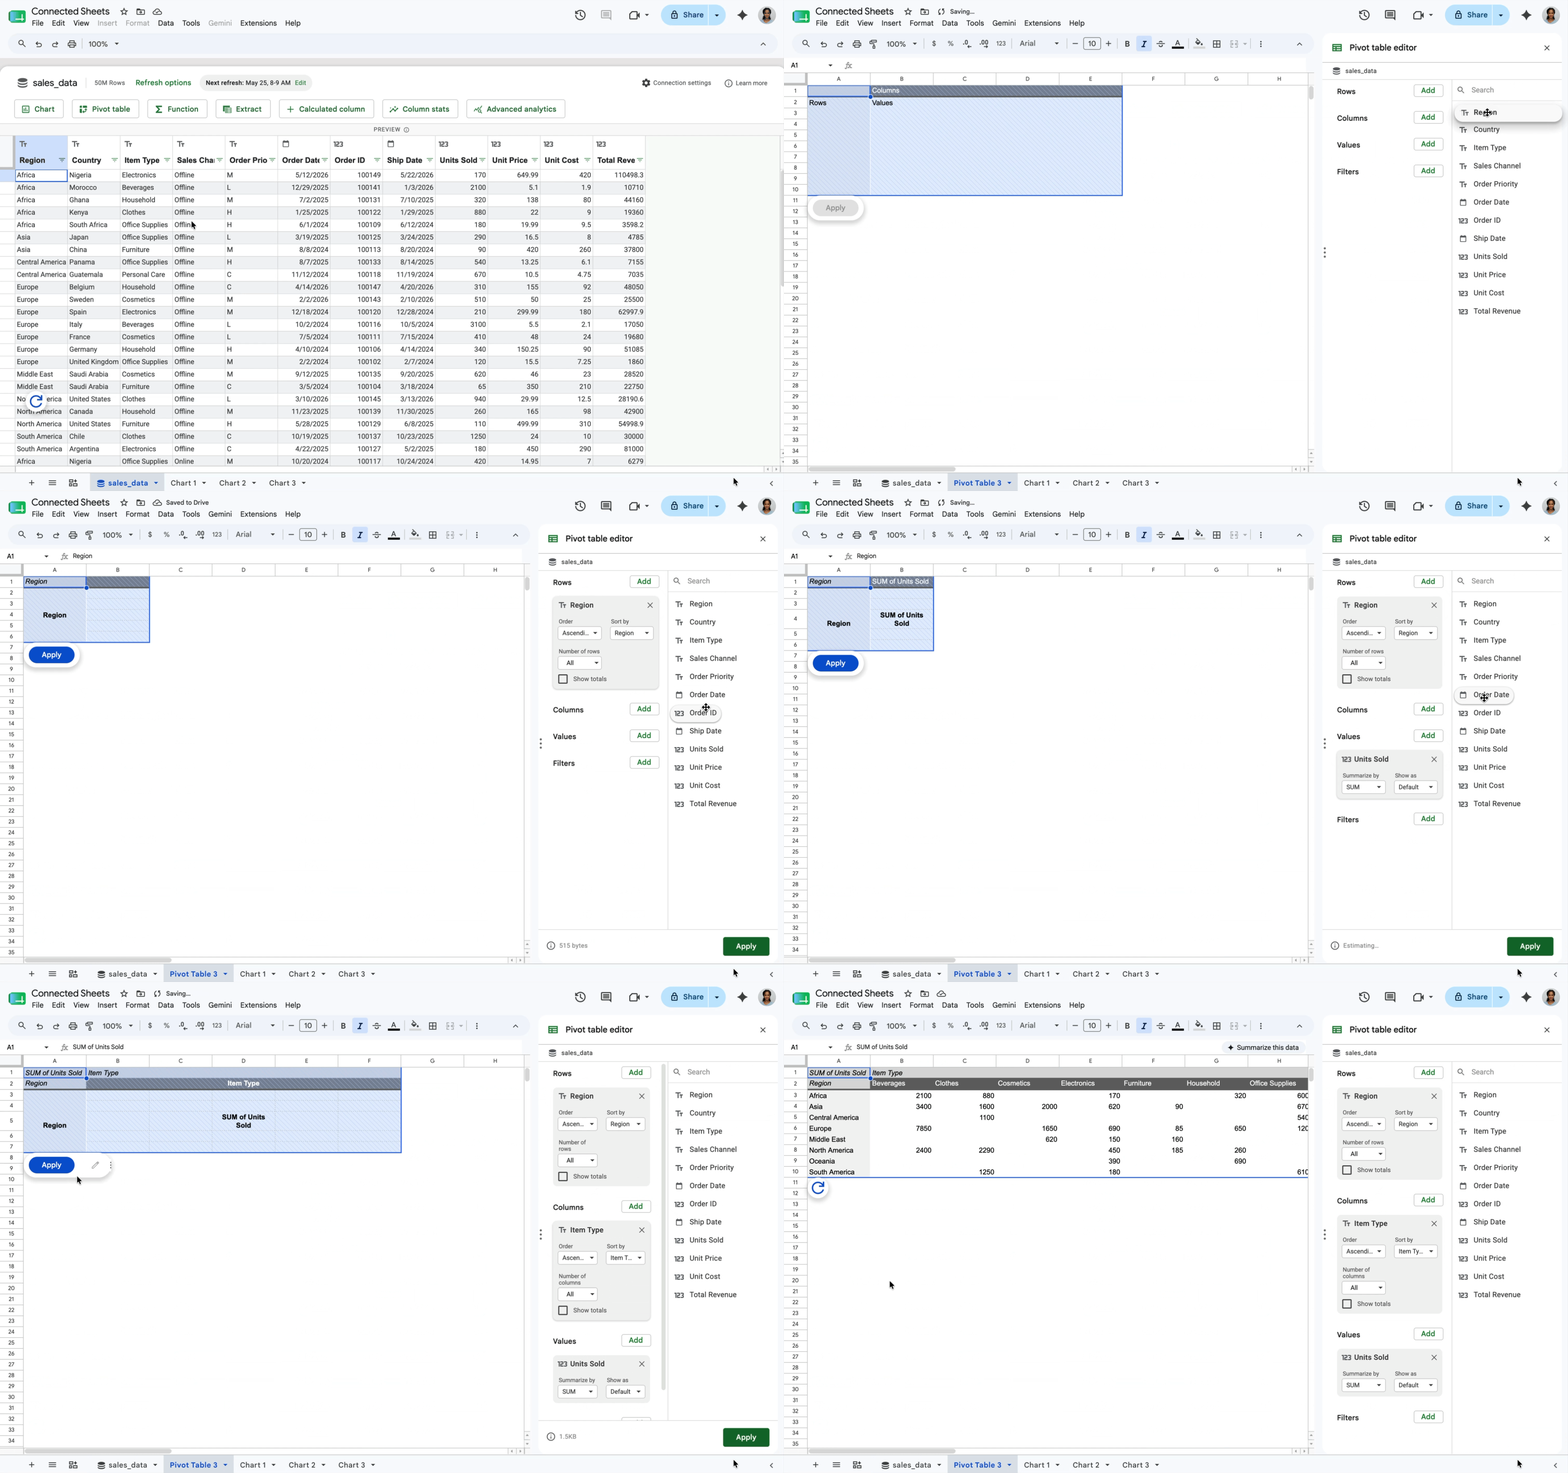
2. Operational reporting: Business users can create live, refreshable, and easy-to-understand dashboard-like views of their data that their partner teams can rely on and share with executives and leads.
Example: Automated executive summary
-
Scenario: An operations lead provides weekly updates on sales invoices to their leadership, based on a BigQuery dataset with millions of rows.
-
Action: The operations lead creates their Connected Sheet and builds a series of charts to visualize invoice trends over time. They then configure the sheet to automatically refresh on a schedule every Monday morning, so it’s always ready ahead of their executive review.
- Outcome: The manual routine of exporting data and pasting it into workbooks is completely eliminated. Leadership gets a reliable report and analysis powered by the latest warehouse data.
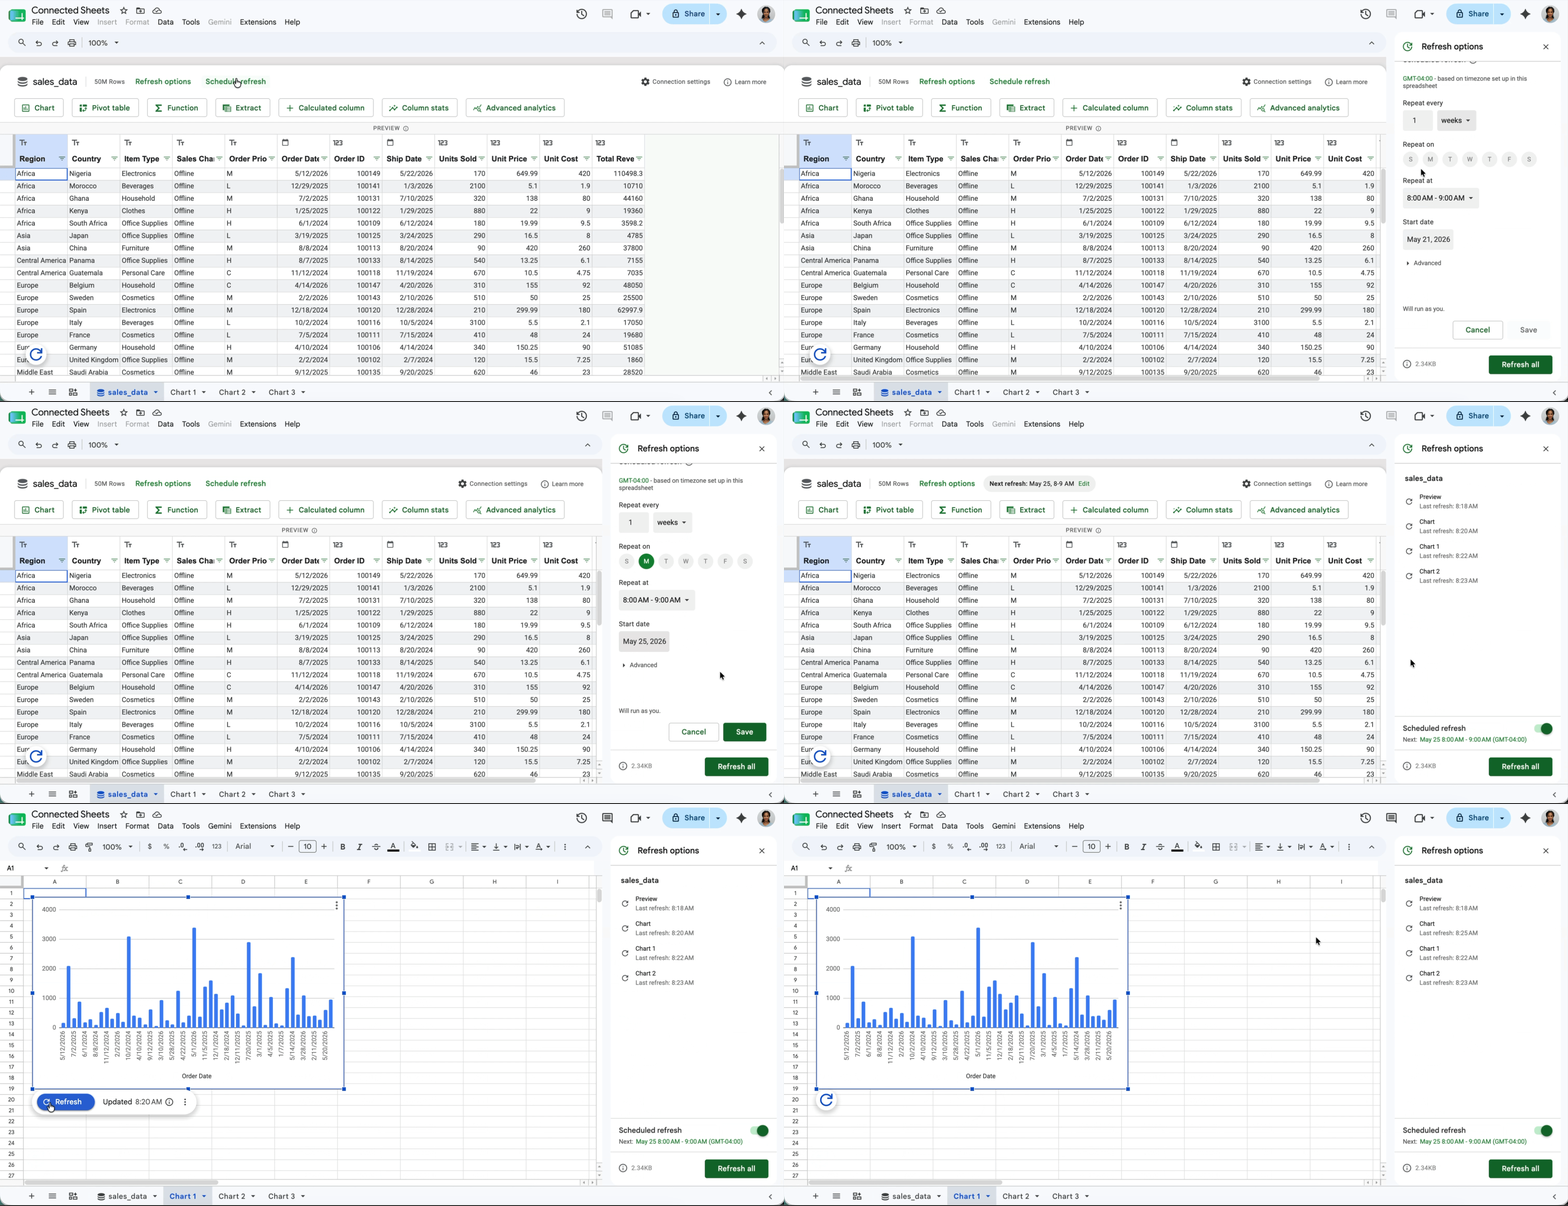
3. Hybrid data modeling: Data practitioners often need to blend governed warehouse data with real-time manual inputs and annotations. For example, a finance team might pull revenue data from BigQuery and combine it with manual procurement entries from your ERP system in a separate tab, using VLOOKUP to create a consolidated view for month-end reporting.
Example: Custom business metrics
-
Scenario: A financial analyst calculates custom commission payouts based on live sales data from your CRM system. The commission tier logic changes frequently and isn't modeled in the central data warehouse.
-
Action: Instead of requesting a new data pipeline from their data team, the analyst can add a calculated column directly within the Connected Sheet. They use standard spreadsheet formulas (like IF or IFS) to apply custom business logic directly against the BigQuery data.
-
Outcome: The analyst retains the flexibility to model scenarios and calculate metrics quickly, while maintaining governed BigQuery data as their single source of truth.
Getting started
Connecting Google Sheets to BigQuery is straightforward and requires only a Google Workspace account and a billing-enabled Google Cloud project. There are two primary ways to establish a connection and create a Connected Sheet.
Path 1: Starting from Sheets
This is the typical workflow for users who work primarily within spreadsheets.
-
Open a new Google Sheet.
-
Navigate to Data > Data Connectors > Connect to BigQuery.
-
Select your billing-enabled Google Cloud project.
-
Browse available datasets, select a Saved Query to connect right away, or input a custom SQL query.
-
Click Connect.
Path 2: Starting from BigQuery
This workflow is common for data analysts starting from the Google Cloud console.
-
Navigate to the BigQuery UI in the console.
-
In the Explorer pane, locate the table or query result you wish to analyze.
-
Click the Export menu (or the three-dot action menu) next to the asset.
-
Select Open in > Connected Sheets.
From petabytes to predictions with Connected Sheets
We designed Connected Sheets to help you bridge the gap between the scalability of the cloud and the flexibility of the spreadsheet. With Connected Sheets, we’re making it easier than ever for organizations to put data into the hands of the people who need it.
To explore these features, connect your BigQuery data to Google Sheets today. For more technical details, visit the Connected Sheets documentation.