Use GKE usage metering to combat over-provisioning
Madhu Yennamani
Product Manager
As Kubernetes has surged in popularity, its users are no longer just early adopters. A growing number of enterprises and SaaS providers also rely on large, multi-tenant Kubernetes clusters to run their workloads, benefitting from increased resource utilization and reduced management overhead.
In many large and medium-sized enterprises, a centralized infrastructure team is responsible for creating, maintaining, and monitoring Kubernetes clusters for the entire firm, and these teams provision resources for individual teams and applications. Consequently, there is a strong need to have accountability for resource usage of the shared environment.
Earlier this year, we announced GKE usage metering, which brings fine-grained visibility to your Kubernetes clusters. With it, you can see your GKE clusters' resource usage broken down by namespaces and labels, and attribute it to meaningful entities (for example, department, customer, application, or environment). We’re excited to announce that GKE usage metering is now generally available. In addition, through conversations with early adopters, we’ve added new functionality to help reduce waste from over-provisioning, with the addition of consumption-based metrics that allow you to compare and contrast the resource requests with actual utilization.
To overprovision is human
Among developers, there’s a tendency to err on the conservative side and request more resources than an application needs. One GKE administrator told us internal customers sometimes requested as much as 20X their actual usage! But it can be hard for administrators to identify which applications and teams are being the most wasteful and how much they are wasting, as this information comes from multiple sources.
Fixing under- and over-provisioning: what happens under the hood
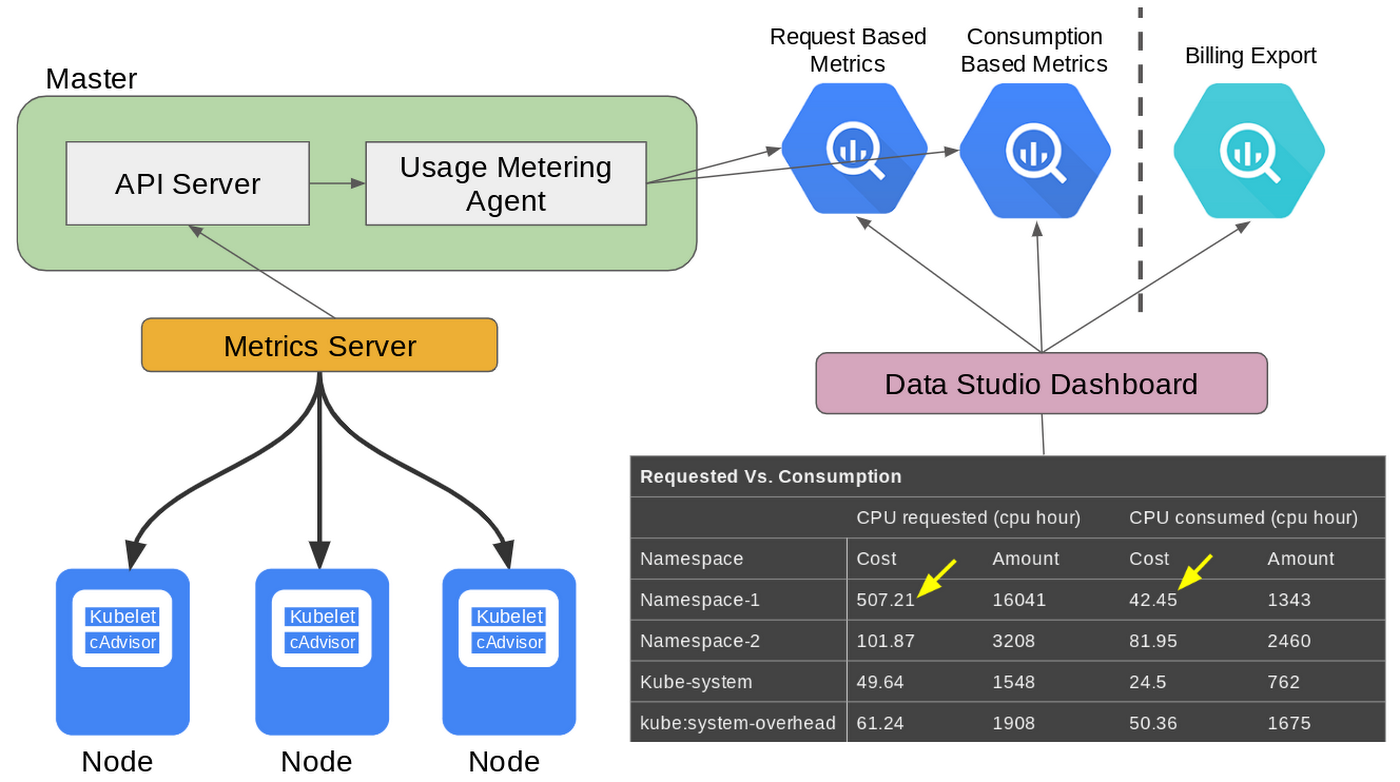
There are three kinds of resource metrics in Kubernetes—resource requests, resource limits, and resource consumption. A resource request is in essence a lower bound on the amount of resources a container will receive; a resource limit is an upper bound; and resource consumption is the actual amount used by a container at runtime.
A resource request is the primary driver of cost, because the Kubernetes scheduler uses the resource request of a new pod, compared to the capacity of a node and the resource requests of the pods running on the node, to know whether a new pod will fit on a node. And if the pod doesn’t fit on any of the available nodes, the cluster autoscaler (if enabled) adds nodes to the cluster. If a pod uses less resources than it requests, then the system is needlessly reserving resources. To reduce waste and keep costs down, it is beneficial to set resource requests to be in line with actual consumption. The opposite may also happen: for example, a common way to increase utilization in fixed-size clusters is to use burstable or best-effort pods, which can use resources in excess of the request if unconsumed resources are available on the machine. In such a scenario, the reserved resources may be a small fraction of used resources, and consumed resources can present a more accurate view of the cluster resource usage.
When you enable the GKE usage metering feature, the agent collects consumption metrics in addition to the resource requests, by polling PodMetrics objects from the metrics-server. The resource request records and resource consumption records are exported to two separate tables in a BigQuery dataset that you specify. Comparing requested with consumed resources makes it easy for you to spot waste, and take corrective measures. In addition, new and improved Data Studio templates are now available to make this analysis even easier for you.
What else is new GKE usage metering
In addition to the new consumption-based metrics, GKE usage metering also includes a simplified Data Studio dashboard setup experience. Now with Data Studio connectors, setup only takes a few clicks, and you no longer have to copy or edit queries manually.
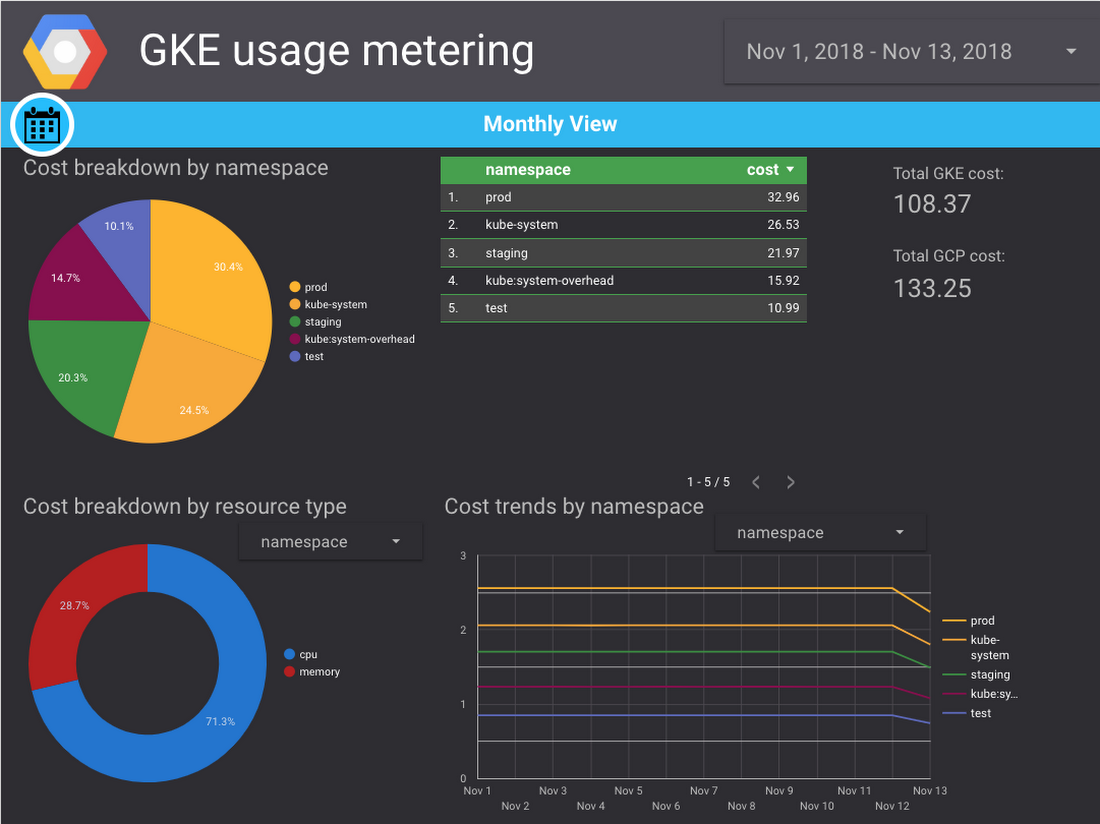
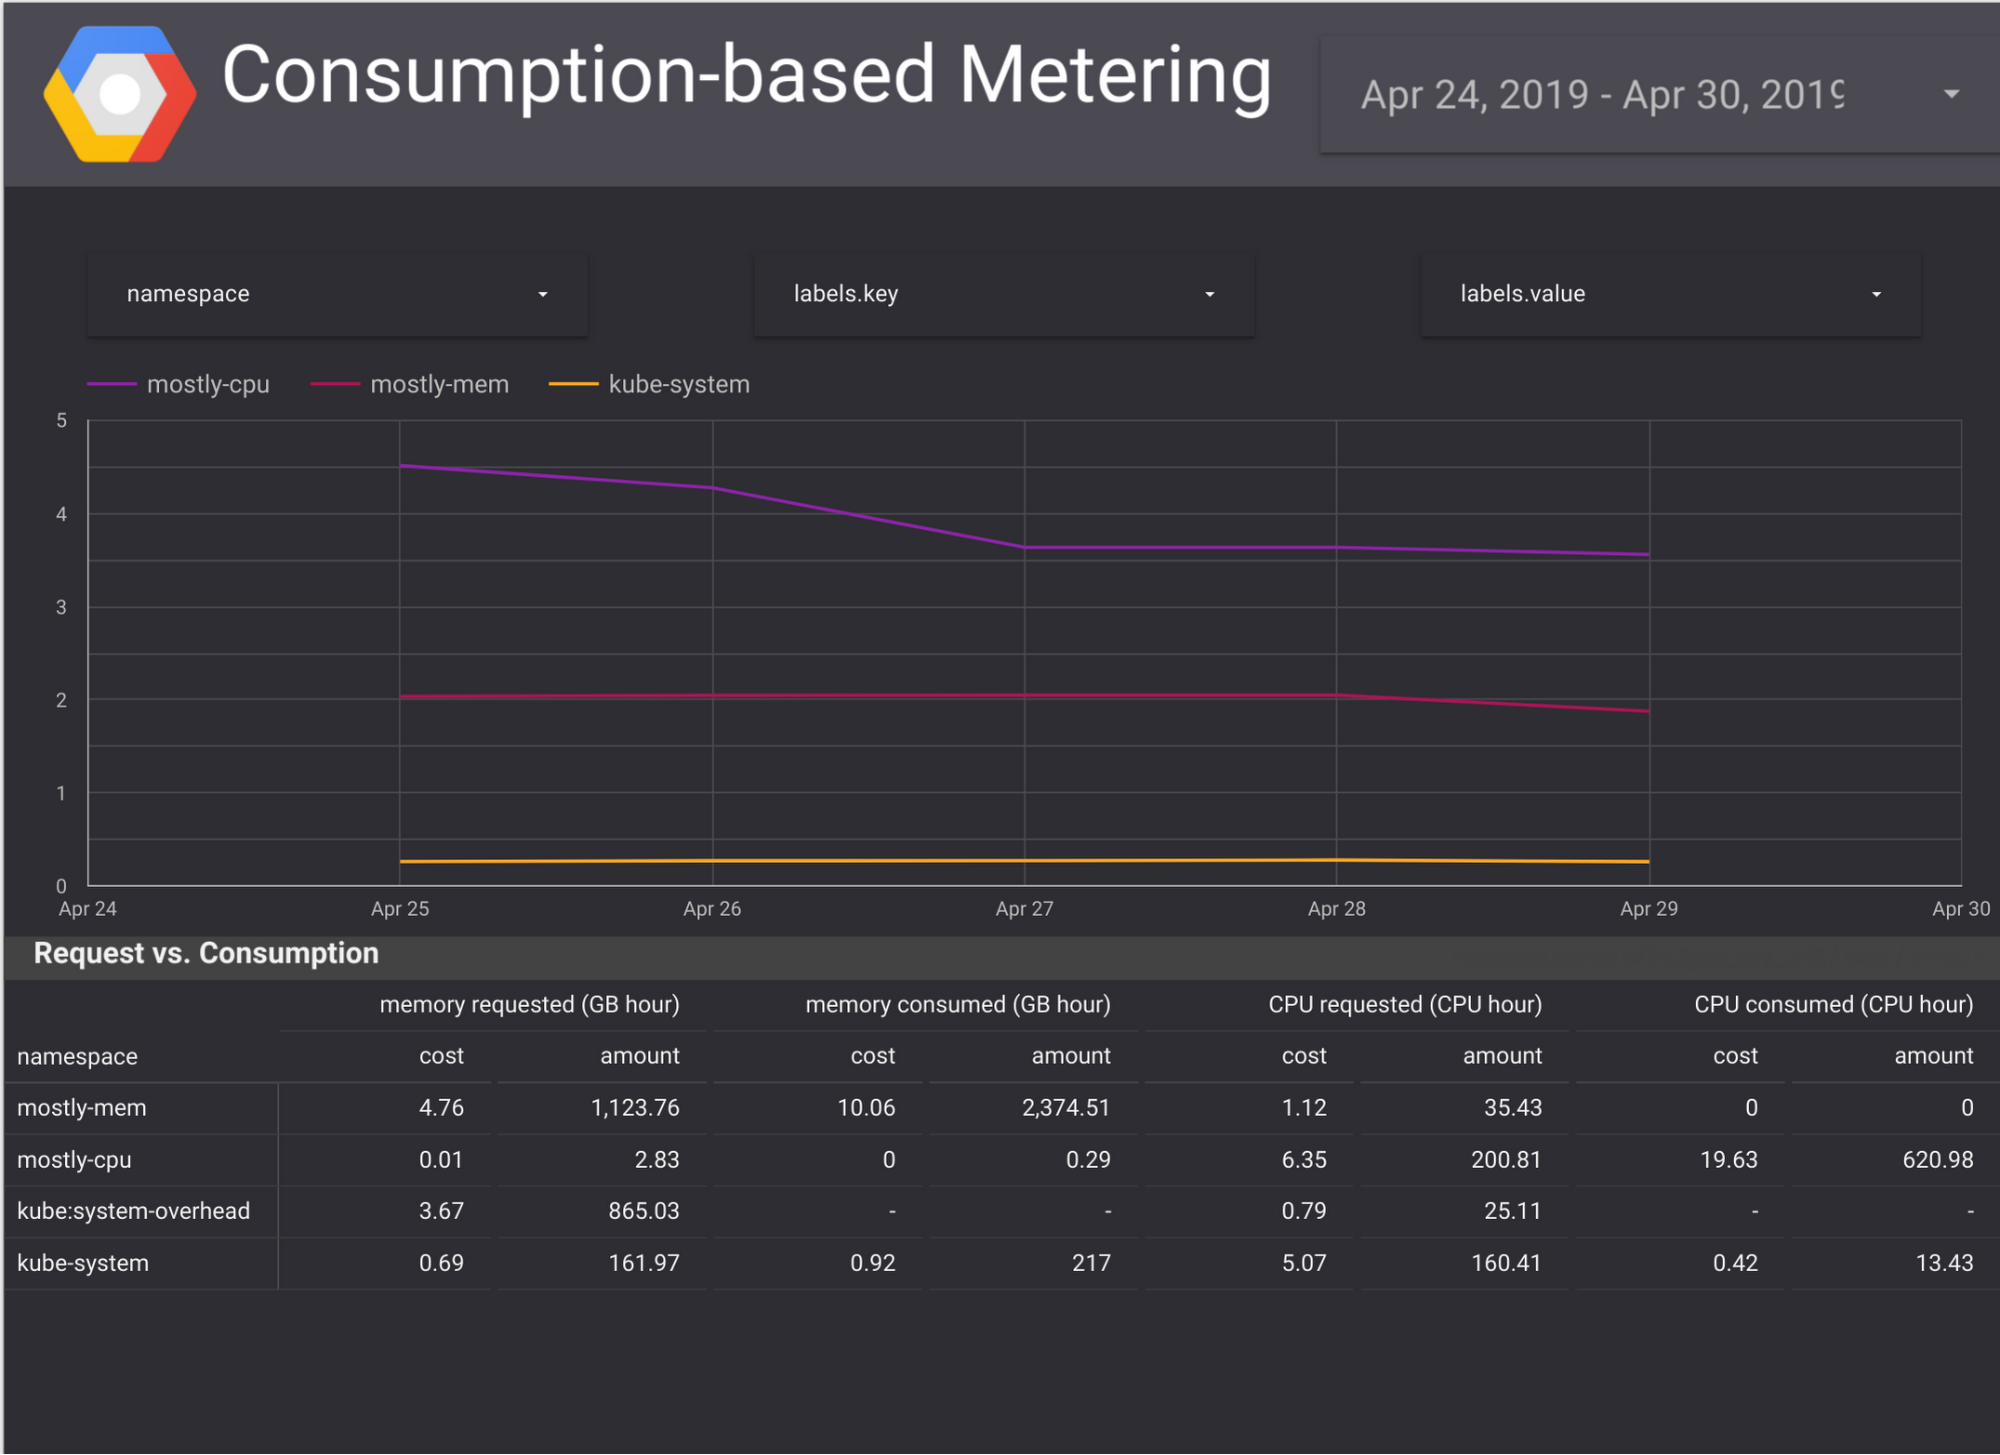
In the documentation, you’ll find plug-and-play Google Data Studio templates and sample BigQuery queries that join GKE usage metering and GCP billing export data to estimate a cost breakdown by namespace and labels. They allow you to create dashboards such as these:
Further, GKE usage metering can now also monitor Cloud TPUs and custom machine types. For other changes and improvements, please see the documentation.
Get started with GKE usage metering today
GKE usage metering makes it easy to attribute cluster usage by \Kubernetes namespaces and labels, map usage to cost, and detect resource overprovisioning. Getting started is a three-step process: 1) Creating a BigQuery dataset in which to store the data; 2) Enabling GKE usage metering; and 3) Setting up a Data Studio templates in which to visualize the data. Usage metering can be enabled on a per-cluster basis. For more detailed instructions and information, read the relevant documentation.