This document describes how you can give different teams access to different sets of projects. You can establish this kind of multi-tenant monitoring by using metrics scopes in combination with multiple instances of Grafana and multiple data source syncers.
You need to set up only one Grafana instance and one data source syncer for each metrics scope, regardless of how many projects are in the metrics scope or how many Google Cloud regions you use:
Queries to Monarch automatically expand to all projects within a metrics scope, unless a
project_idfilter is included.Queries execute across all Google Marketing Platform regions unless a
locationfilter is included.
You don't need to change anything on the ingestion side to achieve multi-tenant monitoring.
The following diagram illustrates a configuration for multi-tenant monitoring:
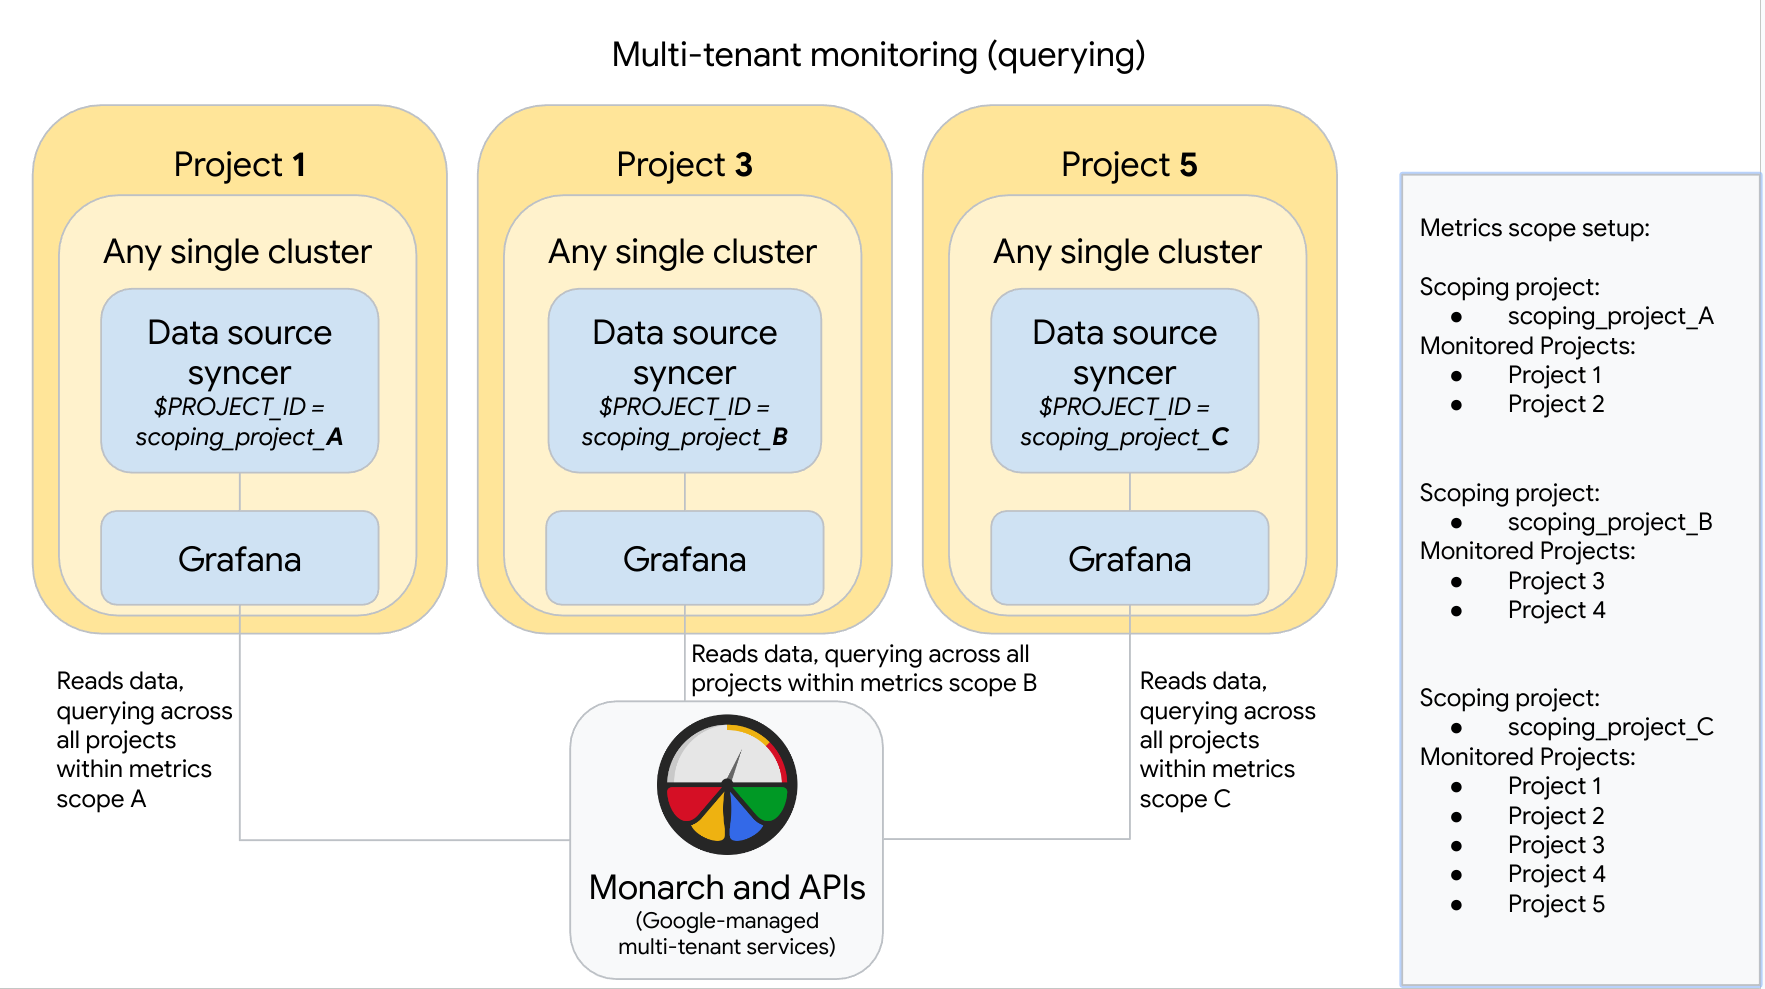
To set up and use a configuration like the one in the diagram, set up your metrics scopes, Grafana instances, and data source syncers as follows:
You want Dev team A to be able to read from and access Projects 1 and 2. To set up this access, you do the following:
Put Project 1 and Project 2 into the metrics scope of scoping_project_A.
Put a data source syncer in Project 1, and configure it to use scoping_project_A. Give the syncer's service account Monitoring Viewer permissions for scoping_project_A.
When a user issues queries from the Grafana instance associated with this data source syncer, Monarch expands scoping_project_A into its constituent monitored projects and returns results for both Project 1 and Project 2, across all Google Cloud regions. Because the Grafana instance and data source syncer live within Project 1, only users with access to Project 1 can query scoping_project_A.
You want Dev team B to be able to read from and access Projects 3 and 4. To set up this access, you do the following:
Put Project 3 and Project 4 into the metrics scope of scoping_project_B.
Put a data source syncer in Project 3, and configure it to use scoping_project_B. Give the syncer's service account Monitoring Viewer permissions for scoping_project_B.
When a user issues queries from the Grafana instance associated with this data source syncer, Monarch expands scoping_project_B into its constituent monitored projects and returns results for both Project 3 and Project 4, across all Google Cloud regions. Because the Grafana instance and data source syncer live within Project 3, only users with access to Project 3 can query scoping_project_B.
You want the SRE team to be able to read from and access Projects 1, 2, 3, 4, and 5. To set up this access, you do the following:
Put all the projects into the metrics scope of scoping_project_C.
Put a data source syncer in Project 5, and configure it to use scoping_project_C. Give the syncer's service account Monitoring Viewer permissions for scoping_project_C.
When a user issues queries from the Grafana instance associated with this data source syncer, Monarch expands scoping_project_C into its constituent monitored projects and returns results for Projects 1, 2, 3, 4, and 5, across all Google Cloud regions. Because the Grafana instance and data source syncer live within Project 5, only users with access to Project 5 can query scoping_project_C.