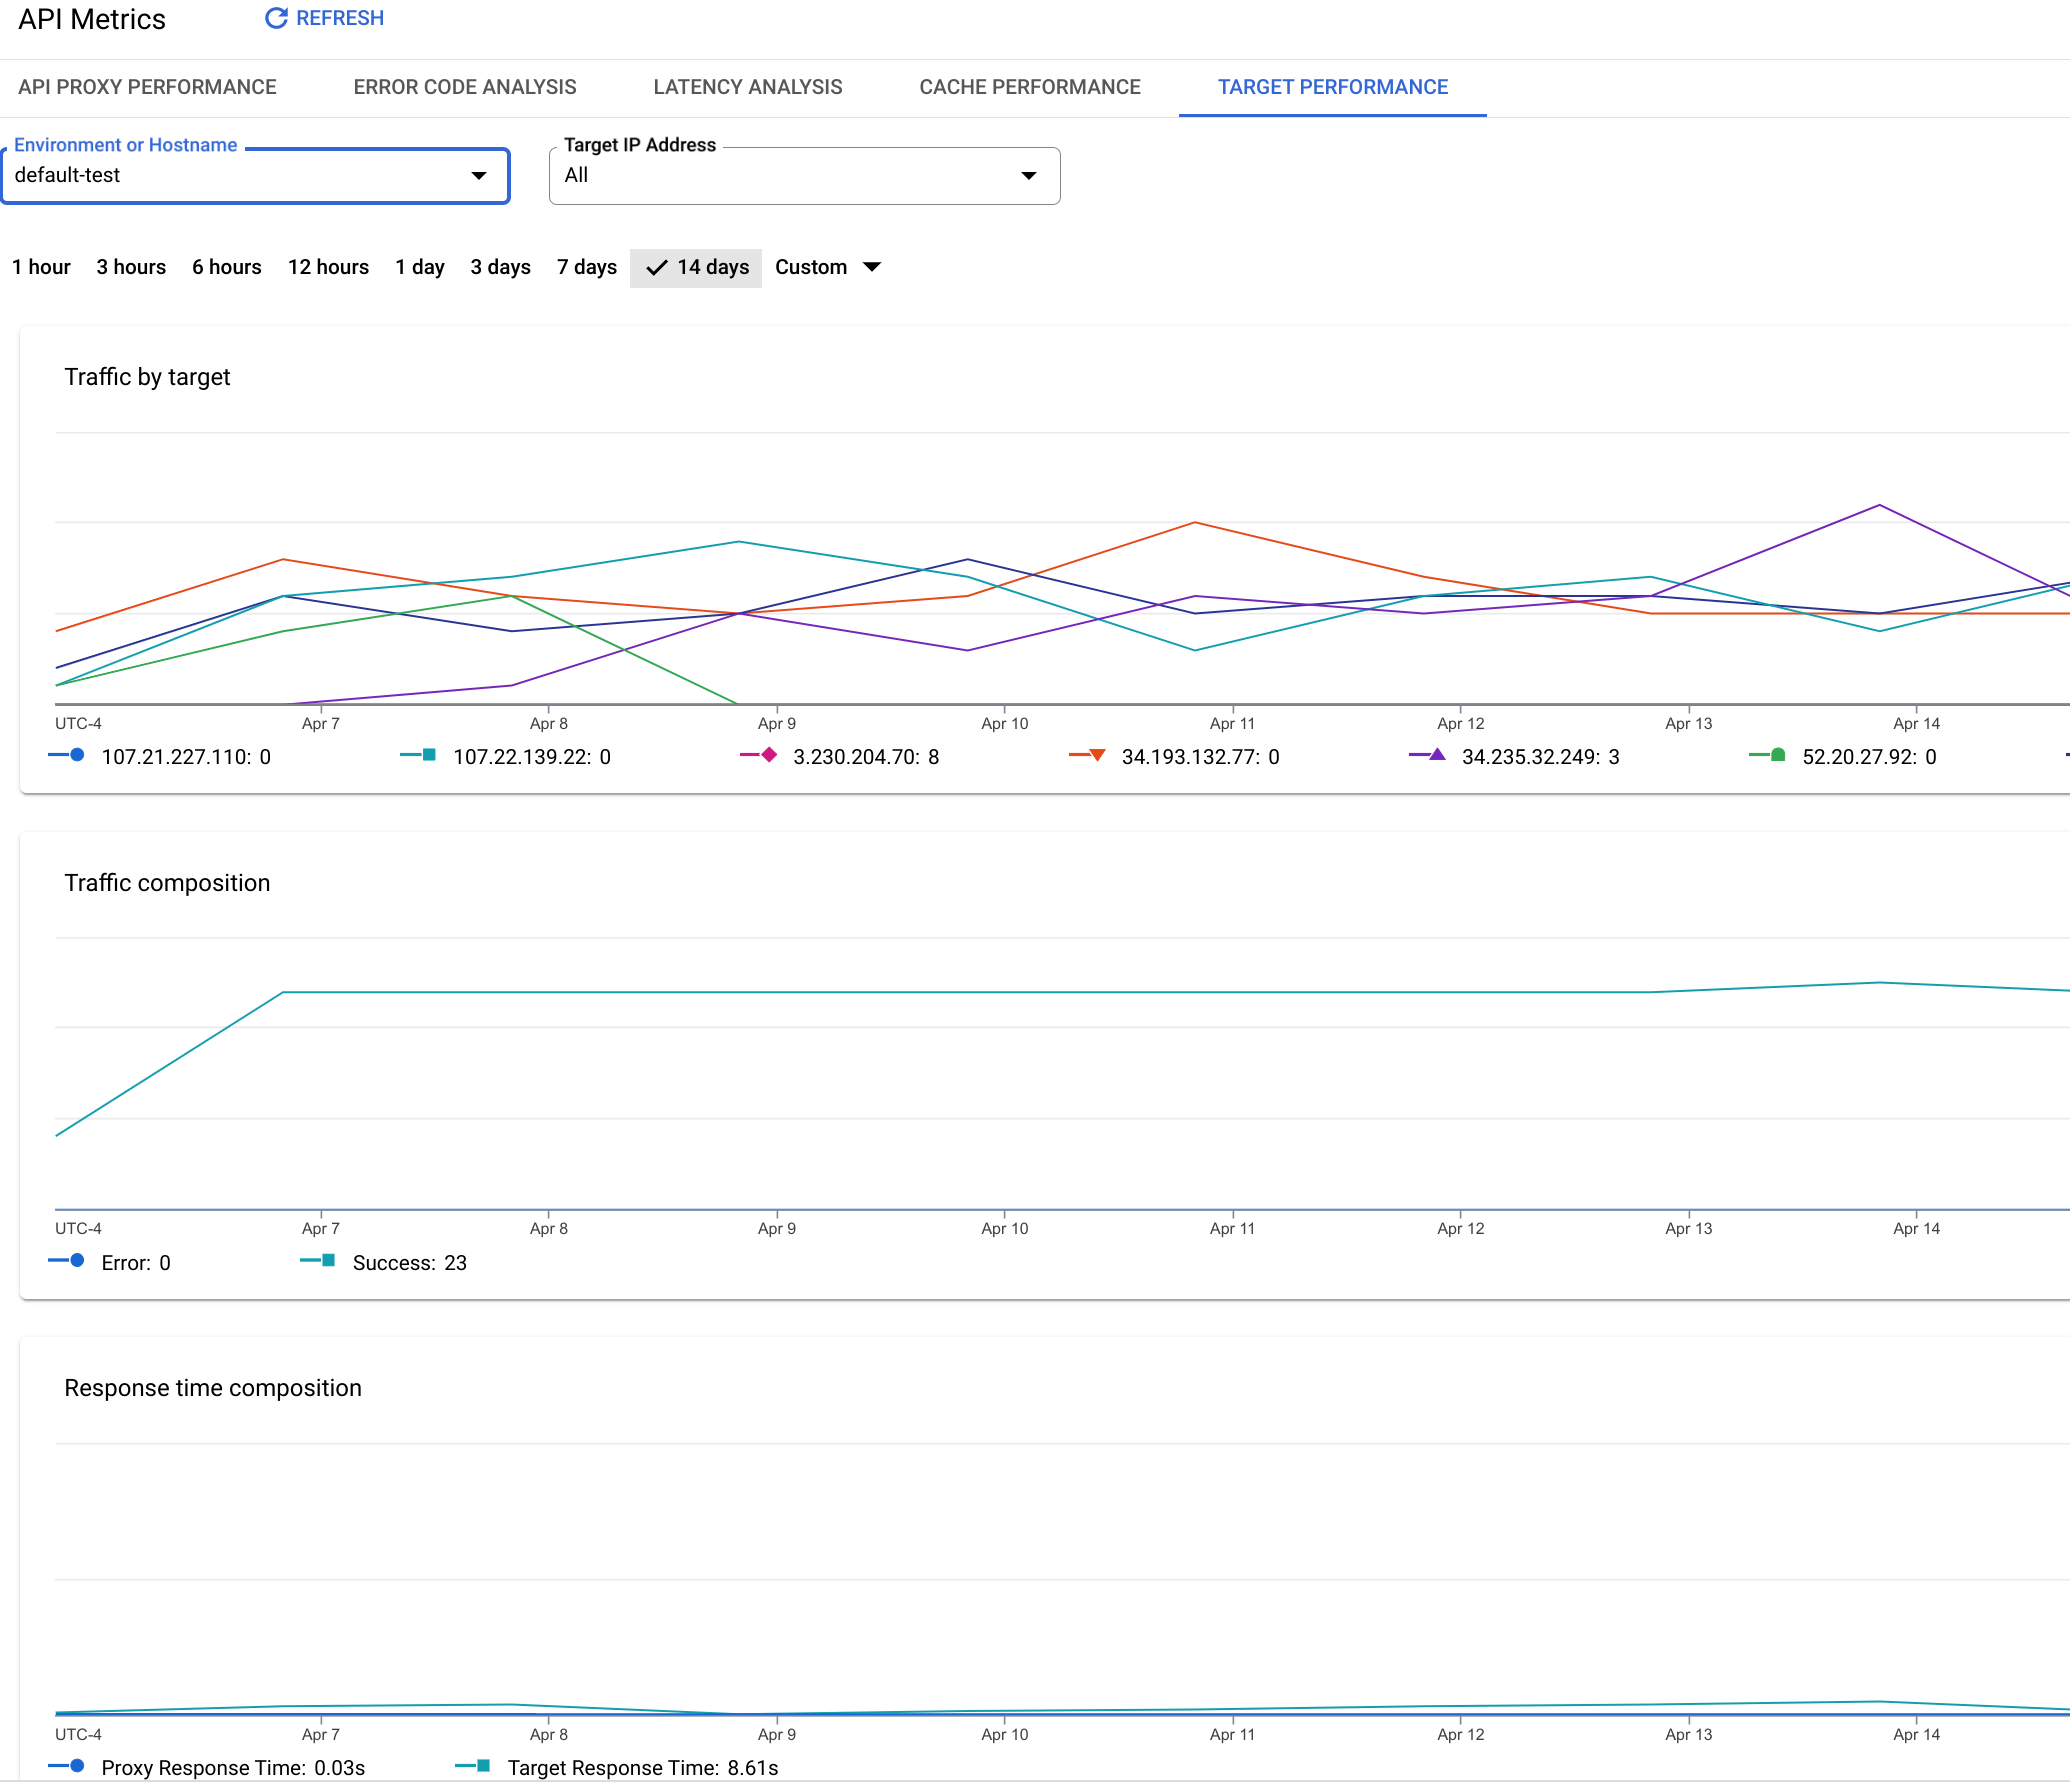
A média do tempo total de resposta medido para todas as chamadas de API feitas para um ambiente de
organização da Apigee. O tempo total de resposta é o tempo necessário para
uma chamada de API ser retornada à Apigee (em milissegundos).
Ou, de outra forma, o tempo total de resposta é o tempo medido desde o momento em que uma chamada
de API inteira é recebida na Apigee até o momento em que a Apigee começa a enviar uma resposta de volta para o
aplicativo cliente.
Tempo médio desejado
O número médio de milissegundos que leva do ponto em que o último byte de uma
solicitação é enviado da Apigee para um destino de back-end até o momento em que a Apigee recebe o último
byte da resposta.
Ela basicamente mede quanto tempo a chamada de API gasta no sistema de
destino.
Tempo médio de proxy
Esse valor é calculado como o Tempo de resposta total menos o Tempo de resposta
desejado.
É basicamente uma medida do tempo que as chamadas de API passam fluindo pela Apigee
(em milissegundos).
Erros de destino
Métrica
Descrição
Total de erros
Mede o número total de erros enviados de destinos de back-end para a Apigee.
Erros 3XX
Mede o número total de HTTP 3XX enviado de destinos de back-end para a Apigee.
Erros 4XX
Mede o número total de erros HTTP 4XX enviados de destinos de back-end para a Apigee.
Erros 5XX
Mede o número total de HTTP 5XX enviado de destinos de back-end para a Apigee.
Tamanho de payload
Métrica
Descrição
Tamanho do payload total
O tamanho total do payload para todas as solicitações e respostas entre as metas da Apigee e do
back-end.
Tamanho do payload da solicitação
Tamanho total do payload de todas as solicitações enviadas da Apigee para metas de back-end
Tamanho do payload da resposta
Tamanho total do payload de todas as respostas enviadas de destinos de back-end para a Apigee.
[[["Fácil de entender","easyToUnderstand","thumb-up"],["Meu problema foi resolvido","solvedMyProblem","thumb-up"],["Outro","otherUp","thumb-up"]],[["Difícil de entender","hardToUnderstand","thumb-down"],["Informações incorretas ou exemplo de código","incorrectInformationOrSampleCode","thumb-down"],["Não contém as informações/amostras de que eu preciso","missingTheInformationSamplesINeed","thumb-down"],["Problema na tradução","translationIssue","thumb-down"],["Outro","otherDown","thumb-down"]],["Última atualização 2025-09-04 UTC."],[[["\u003cp\u003eThis page details the Target Performance dashboard, which is available in both Apigee and Apigee hybrid environments, and provides insights into traffic and performance metrics related to API proxy backend targets.\u003c/p\u003e\n"],["\u003cp\u003eThe Target Performance dashboard, accessible via the Apigee UI in Cloud console or the classic Apigee UI, measures key performance metrics including traffic by target, traffic volume, response times, target errors, and payload sizes.\u003c/p\u003e\n"],["\u003cp\u003eData displayed in the dashboard might experience a delay of up to 10 minutes after API calls are made to proxies, therefore not showcasing real time information.\u003c/p\u003e\n"],["\u003cp\u003eThe dashboard tracks various error types, such as 3XX, 4XX, and 5XX errors, originating from backend targets and relayed to Apigee.\u003c/p\u003e\n"],["\u003cp\u003eResponse Time metrics include Average Time (total response time), Average Target Time (time on the target system), and Average Proxy Time (time within Apigee).\u003c/p\u003e\n"]]],[],null,["*This page\napplies to **Apigee** and **Apigee hybrid**.*\n\n\n*View [Apigee Edge](https://docs.apigee.com/api-platform/get-started/what-apigee-edge) documentation.*\n\nWhat does this dashboard tell me?\n\nThe **Target Performance** dashboard helps you visualize traffic patterns and performance metrics\nfor API proxy backend targets.\n\n\n| **Note:** **Data delay interval** \n| After API calls are made to proxies, it may take up to **10 minutes** for the data to appear in dashboards, custom reports, and management API calls.\n\n\u003cbr /\u003e\n\nThe Target Performance dashboard\n\nTo access the Target Performance dashboard:\n\n\nIn the Google Cloud console, go to the **Analytics \\\u003e API metrics \\\u003e Target Performance** page.\n\n[Go to Target Performance](https://console.cloud.google.com/apigee/analytics/target-performance)\n\nThe **Target Performance** view is shown:\n\nWhat does this dashboard measure?\n\n- [Traffic by Target](#trafficbytarget)\n- [Traffic](#traffic)\n- [Response Time](#responsetime)\n- [Target Errors](#targeterrors)\n- [Payload Size](#payloadsize)\n\nTraffic by Target\n\n| Metric | Description |\n|-------------------------|-----------------------------------------------------------------------------------------------|\n| **All Targets Traffic** | Measures the total amount of traffic that passes from Apigee to all backend targets. |\n| **\\\u003c*Target name*\\\u003e** | Measures the total amount of traffic that passes from Apigee to the specified backend target. |\n\nTraffic\n\n| Metric | Description |\n|-------------------|--------------------------------------------------------------------------------------------------------------------------|\n| **Total Traffic** | Measures the total amount of traffic that passes from Apigee to all backend targets. Same as All Targets Traffic. |\n| **Errors** | The total number of requests to backend targets that resulted in an unsuccessful response. Error responses do not count. |\n| **Success** | The total number of all requests to backend targets that are successful (that do not return an error). |\n\nResponse Time\n\nSee also this interesting article on the Apigee Community site:\n[When can the Average Total Response Time be less than the Average Target Response Time?](https://community.apigee.com/articles/2695/when-can-the-average-total-response-time-be-less-t.html)\n\n| Metric | Description |\n|-------------------------|-------------------------------------------------------------------------------------------------------------------------------------------------------------------------------------------------------------------------------------------------------------------------------------------------------------------------------------------------------------------------------------------------------------------|\n| **Average Time** | The average of the Total Response Time measured for all API calls made to an Apigee organization environment. The Total Response Time is the amount of time it takes for an API call to Apigee to return (in milliseconds). Or, put another way, total response time is the time measured from when an entire API call is received on Apigee to the time Apigee begins sending a response back to the client app. |\n| **Average Target Time** | The average number of milliseconds that it takes from the point the last byte of a request is sent from Apigee to a backend target to the time Apigee receives the last byte of the response. It's basically measuring how much time the API call spends on the target system. |\n| **Average Proxy Time** | This value is calculated as the Total Response Time minus the Target Response Time. It's basically a measure of how much time the API call spends flowing through Apigee itself (in milliseconds). |\n\nTarget Errors\n\n| Metric | Description |\n|------------------|-----------------------------------------------------------------------------------|\n| **Total Errors** | Measures the total number of errors sent from backend targets to Apigee. |\n| **3XX Errors** | Measures the total number of HTTP 3XX sent from backend targets to Apigee. |\n| **4XX Errors** | Measures the total number of HTTP 4XX errors sent from backend targets to Apigee. |\n| **5XX Errors** | Measures the total number of HTTP 5XX sent from backend targets to Apigee. |\n\nPayload Size\n\n| Metric | Description |\n|---------------------------|-------------------------------------------------------------------------------------------|\n| **Total Payload Size** | The total payload size for all requests and responses between Apigee and backend targets. |\n| **Request Payload Size** | The total payload size for all requests sent from Apigee to backend targets. |\n| **Response Payload Size** | The total payload size for all responses sent from backend targets to Apigee. |"]]