Unraveling Time: A Deep Dive into TTD Instruction Emulation Bugs
Mandiant
Written by: Dhanesh Kizhakkinan, Nino Isakovic
Executive Summary
This blog post presents an in-depth exploration of Microsoft's Time Travel Debugging (TTD) framework, a powerful record-and-replay debugging framework for Windows user-mode applications. TTD relies heavily on accurate CPU instruction emulation to faithfully replay program executions. However, subtle inaccuracies within this emulation process can lead to significant security and reliability issues, potentially masking vulnerabilities or misleading critical investigations—particularly incident response and malware analysis. This could cause analysts to overlook threats or draw incorrect conclusions. Furthermore, attackers can exploit these inaccuracies to intentionally evade detection or disrupt forensic analyses, severely compromising investigative outcomes.
The blog post examines specific challenges, provides historical context, and analyzes real-world emulation bugs, highlighting the critical importance of accuracy and ongoing improvement to ensure the effectiveness and reliability of investigative tooling. Ultimately, addressing these emulation issues directly benefits users by enhancing security analyses, improving reliability, and ensuring greater confidence in their debugging and investigative processes.
Overview
We begin with an introduction to TTD, detailing its use of a sophisticated CPU emulation layer powered by the Nirvana runtime engine. Nirvana translates guest instructions into host-level micro-operations, enabling detailed capture and precise replay of a program's execution history.
The discussion transitions into exploring historical challenges in CPU emulation, particularly for the complex x86 architecture. Key challenges include issues with floating-point and SIMD operations, memory model intricacies, peripheral and device emulation, handling of self-modifying code, and the constant trade-offs between performance and accuracy. These foundational insights lay the groundwork for our deeper examination of specific instruction emulation bugs discovered within TTD.
These include:
-
A bug involving the emulation of the
pop r16, resulting in critical discrepancies between native execution and TTD instrumentation. -
An issue with the
push segmentinstruction that demonstrates differences between Intel and AMD CPU implementations, highlighting the importance of accurate emulation aligned with hardware behavior -
Errors in the implementation of the
lodsbandlodswinstructions, where TTD incorrectly clears upper bits that should remain unchanged. -
An issue within the WinDbg TTDAnalyze debugging extension, where a fixed output buffer resulted in truncated data during symbol queries, compromising debugging accuracy.
Each case is supported by detailed analyses, assembly code proof-of-concept samples, and debugging traces, clearly illustrating the subtle but significant pitfalls in modern CPU emulation as it pertains to TTD.
Additional bugs discovered beyond those detailed here are pending disclosure until addressed by Microsoft. All bugs discussed in this post have been resolved as of TTD version 1.11.410.
Intro to TTD
Time Travel Debugging (TTD) is a powerful usermode record-and-replay framework developed by Microsoft, originally introduced in a 2006 whitepaper under a different name. It is a staple for our workflows as it pertains to Windows environments.
TTD allows a user to capture a comprehensive recording of a process (and potential child processes) during the lifetime of the process's execution. This is done by injecting a dynamic-link library (DLL) into the intended target process and capturing each state of the execution. This comprehensive historical view of the program's runtime behavior is stored in a database-like trace file (.trace), which, much like a database, can be further indexed to produce a corresponding .idx file for efficient querying and analysis.
Once recorded, trace files can be consumed by a compatible client that supports replaying the entire execution history. In other words, TTD effectively functions as a record/replay debugger, enabling analysts to move backward and forward through execution states as if navigating a temporal snapshot of the program's lifecycle.
TTD relies on a CPU emulation layer to accurately record and replay program executions. This layer is implemented by the Nirvana runtime engine, which simulates guest instructions by translating them into a sequence of simpler, host-level micro-operations. By doing so, Nirvana provides fine-grained control at the instruction and sub-instruction level, allowing instrumentation to be inserted at each stage of instruction processing (e.g., fetching, memory reads, writes). This approach not only ensures that TTD can capture the complete dynamic behavior of the original binary but also makes it possible to accurately re-simulate executions later.
Nirvana's dynamic binary translation and code caching techniques improve performance by reusing translated sequences when possible. In cases where code behaves unpredictably—such as self-modifying code scenarios—Nirvana can switch to a pure interpretation mode or re-translate instructions as needed. These adaptive strategies ensure that TTD maintains fidelity and efficiency during the record and replay process, enabling it to store execution traces that can be fully re-simulated to reveal intricate details of the code's behavior under analysis.
The TTD framework is composed of several core components:
-
TTD: The main TTD client executable that takes as input a wide array of input arguments that dictate how the trace will be conducted.
-
TTDRecord: The main DLL responsible for the recording that runs within the TTD client executable. It initiates the injection sequence into the target binary by injecting TTDLoader.dll.
-
TTDLoader: DLL that gets injected into the guest process and initiates the recorder within the guest through the TTDRecordCPU DLL. It also establishes a process instrumentation callback within the guest process that allows Nirvana to monitor the egress of any system calls the guest makes.
-
TTDRecordCPU: The recorder responsible for capturing the execution states into the
.tracefile. This is injected as a DLL into the guest process and communicates the status of the trace with TTDRecord. The core logic works by emulating the respective CPU. -
TTDReplay and TTDReplayClient: The replay components that read the captured state from the trace file and allow users to step through the recorded execution.
-
Windbg uses these to provide support for replacing trace files.
-
TTDAnalyze: A WinDbg extension that integrates with the replay client, providing exclusive TTD capacities to WinDbg. Most notable of these are the
CallsandMemorydata model methods.
CPU Emulation
Historically, CPU emulation—particularly for architectures as intricate as x86—has been a persistent source of engineering challenges. Early attempts struggled with instruction coverage and correctness, as documentation gaps and hardware errata made it difficult to replicate every nuanced corner case. Over time, a number of recurring problem areas and bug classes emerged:
-
Floating-Point and SIMD Operations: Floating-point instructions, with their varying precision modes and extensive register states, have often been a source of subtle bugs. Miscalculating floating-point rounding, mishandling denormalized numbers, or incorrectly implementing special instructions like
FSINorFCOScan lead to silent data corruption or outright crashes. Similarly, SSE, AVX, and other vectorized instructions introduce complex states that must be tracked accurately. -
Memory Model and Addressing Issues: The x86 architecture's memory model, which includes segmentation, paging, alignment constraints, and potential misalignments in legacy code, can introduce complex bugs. Incorrectly emulating memory accesses, not enforcing proper page boundaries, or failing to handle "lazy" page faults and cache coherency can result in subtle errors that only appear under very specific conditions.
-
Peripheral and Device Emulation: Emulating the behavior of x86-specific peripherals—such as serial I/O ports, PCI devices, PS/2 keyboards, and legacy controllers—can be particularly troublesome. These components often rely on undocumented behavior or timing quirks. Misinterpreting device-specific registers or neglecting to reproduce timing-sensitive interactions can lead to erratic emulator behavior or device malfunctions.
-
Compatibility with Older or Unusual Processors: Emulating older generations of x86 processors, each with their own peculiarities and less standardized features, poses its own set of difficulties. Differences in default mode settings, instruction variants, and protected-mode versus real-mode semantics can cause unexpected breakages. A once-working emulator may fail after it encounters code written for a slightly different microarchitecture or an instruction that was deprecated or implemented differently in an older CPU.
-
Self-Modifying Code and Dynamic Translation: Code that modifies itself at runtime demands adaptive strategies, such as invalidating cached translations or re-checking original code bytes on the fly. Handling these scenarios incorrectly can lead to stale translations, misapplied optimizations, and difficult-to-trace logic errors.
-
Performance vs. Accuracy Trade-Offs: Historically, implementing CPU emulators often meant juggling accuracy with performance. Naïve instruction-by-instruction interpretation provided correctness but was slow. Introducing caching or just-in-time (JIT)-based optimizations risked subtle synchronization issues and bugs if not properly synchronized with memory updates or if instruction boundaries were not well preserved.
Collectively, these historical challenges underscore that CPU emulation is not just about instruction decoding. It requires faithfully recreating intricate details of processor states, memory hierarchies, peripheral interactions, and timing characteristics. Even as documentation and tooling have improved, achieving both correctness and efficiency remains a delicate balancing act, and emulation projects continue to evolve to address these enduring complexities.
The Initial TTD Bug
Executing a heavily obfuscated 32-bit Windows Portable Executable (PE) file under TTD instrumentation resulted in a crash. The same sample file did not cause a crash while executing in a real computer or in a virtual machine. We suspected either the sample is detecting TTD execution and or TTD itself has a bug in emulating an instruction. A good thing about debugging TTD issues is that the TTD trace file itself can be used to pinpoint the cause of the issue most of the time. Figure 1 points to the crash while in TTD emulation.
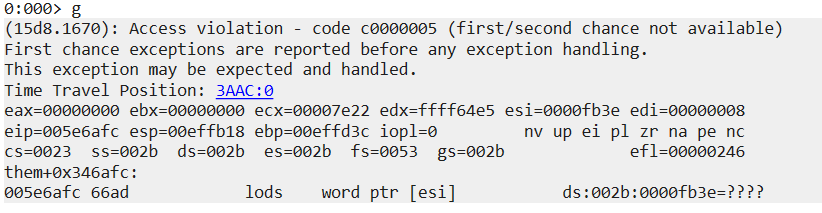
Figure 1: Crash while accessing an address pointed by register ESI
Back tracing the ESI register value to 0xfb3e took stepping back hundreds of instructions and ended up in the following sequence of instructions, as shown in Figure 2.
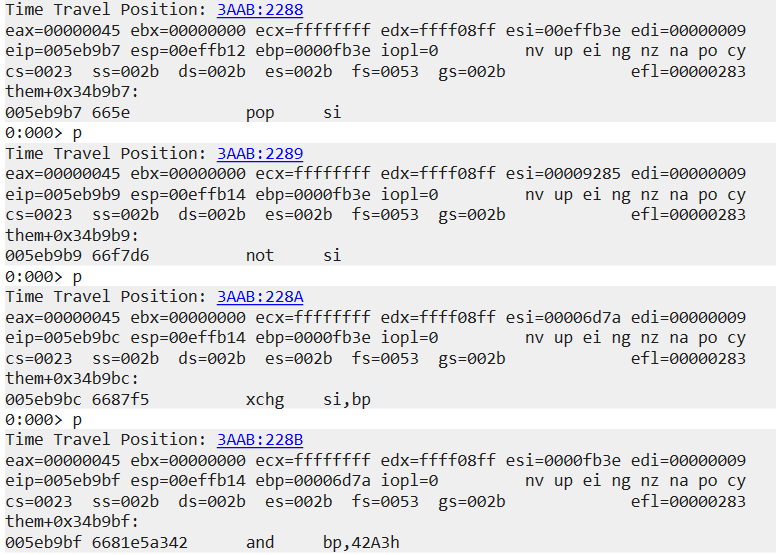
Figure 2: Register ESI getting populated by pop si and xchg si,bp
There are two instructions populating the ESI register, both working with the 16-bit sub register of SI while completely ignoring the other 16-bit part of the ESI register. If we look closely at the results after pop si instruction in Figure 2, the upper 16-bit of the ESI register seems to be nulled out. This looked like a bug in emulating pop r16 instructions, and we quickly wrote a proof-of-concept code for verification (Figure 3).
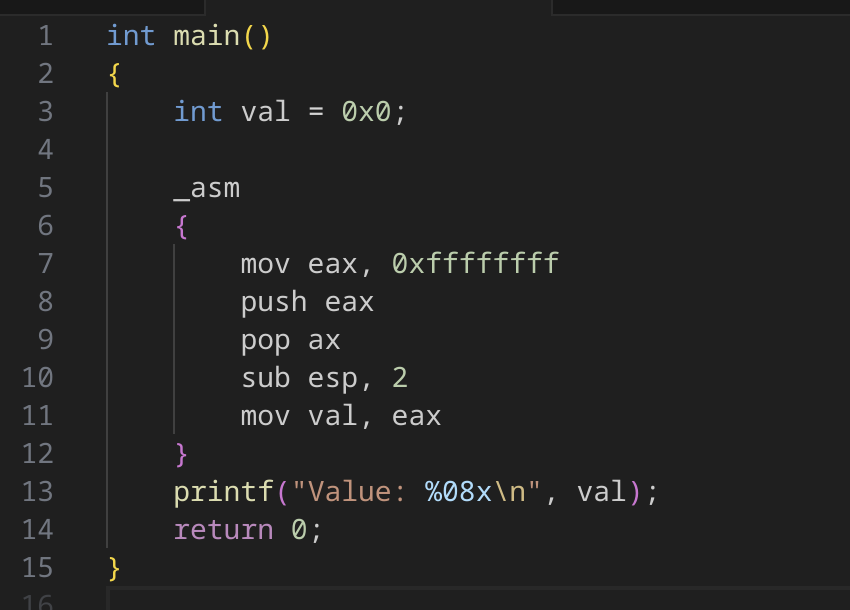
Figure 3: Proof-of-concept for pop r16
Running the resulting binary natively and with TTD instrumentation as shown in Figure 4 confirmed our suspicion that the pop r16 instructions are emulated differently in TTD than on a real CPU.
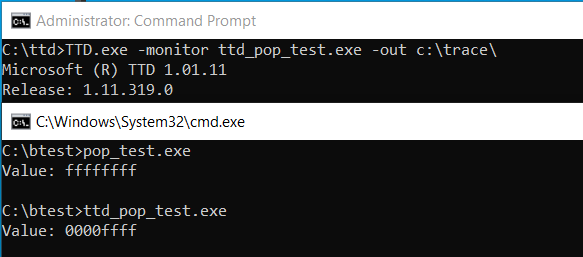
Figure 4: Running the code natively and with TTD instrumentation
We reported this issue and the fuzzing results to the TTD team at Microsoft.
Fuzzing TTD
Given there is one instruction emulation bug (instruction sequence that produces different results in real vs TTD execution), we decided to fuzz TTD to find similar bugs. A rudimentary harness was created to execute a random sequence of instructions and record the resulting values. This harness was executed on a real CPU and under TTD instrumentation, providing us with two sets of results. Any changes in results or partial lack of results points us to a likely instruction emulation bug.
Results
Bug 1: PUSH segment Instruction Emulation Discrepancy
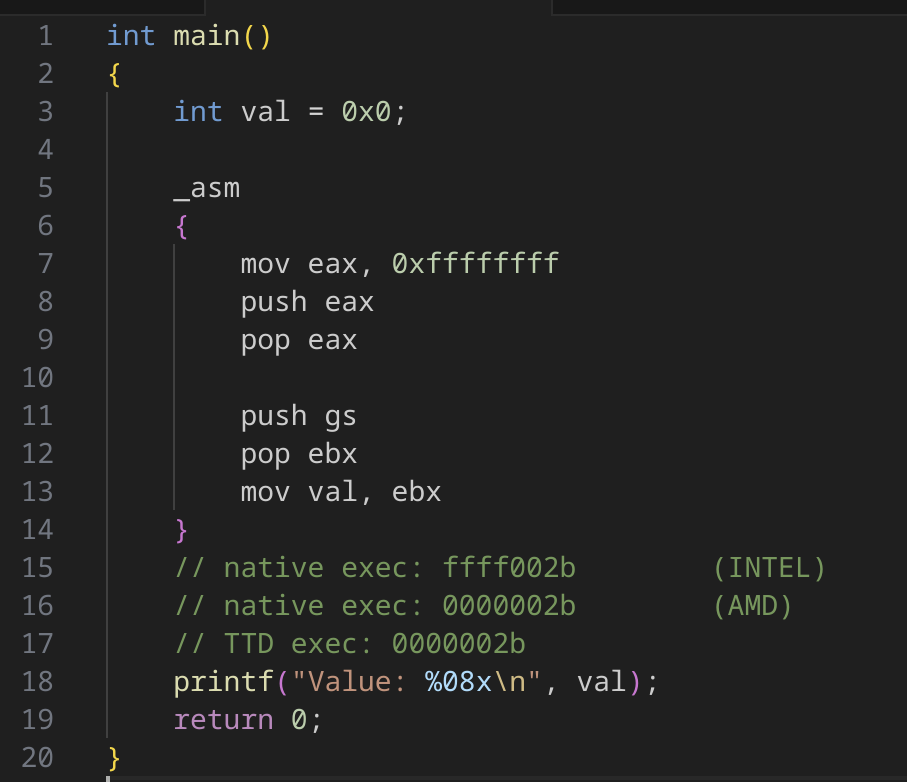
Figure 5: Proof-of-concept for push segment
This new bug was fairly similar to the original pop r16 bug, but with a push segment instruction. This bug also comes with a little bit of twist. While our fuzzer was running on an Intel CPU-based machine and one of us verified the bug locally, the other person was not able to verify the bug. Interestingly, the failure happened on an AMD-based CPU, tipping us to the possibility that the push segment instruction implementation varies between INTEL and AMD CPUs.
Looking at both INTEL and AMD CPU specifications, INTEL specification goes into details about how recent processors implement push segment register instruction:
If the source operand is a segment register (16 bits) and the operand size is 64-bits, a zero-extended value is pushed on the stack; if the operand size is 32-bits, either a zero-extended value is pushed on the stack or the segment selector is written on the stack using a 16-bit move. For the last case, all recent Intel Core and Intel Atom processors perform a 16-bit move, leaving the upper portion of the stack location unmodified. (INTEL spec Vol.2B 4-517)
We reported the discrepancy to AMD PSIRT, who concluded that this is not a security vulnerability. It seems sometime circa 2007 INTEL and AMD CPU started implementing the push segment instruction differently, and TTD emulation followed the old way.
Bug 2: lodsb/lodsw Instruction Emulation Discrepancy
The lodsb and lodsw are not correctly implemented for both 32-bit and 64-bit instructions. Both clear the upper bits of the register (rax/eax) whereas the original instructions only modify their respective granularities (i.e., lodsb will only overwrite 1-byte, lodsw only 2-bytes).
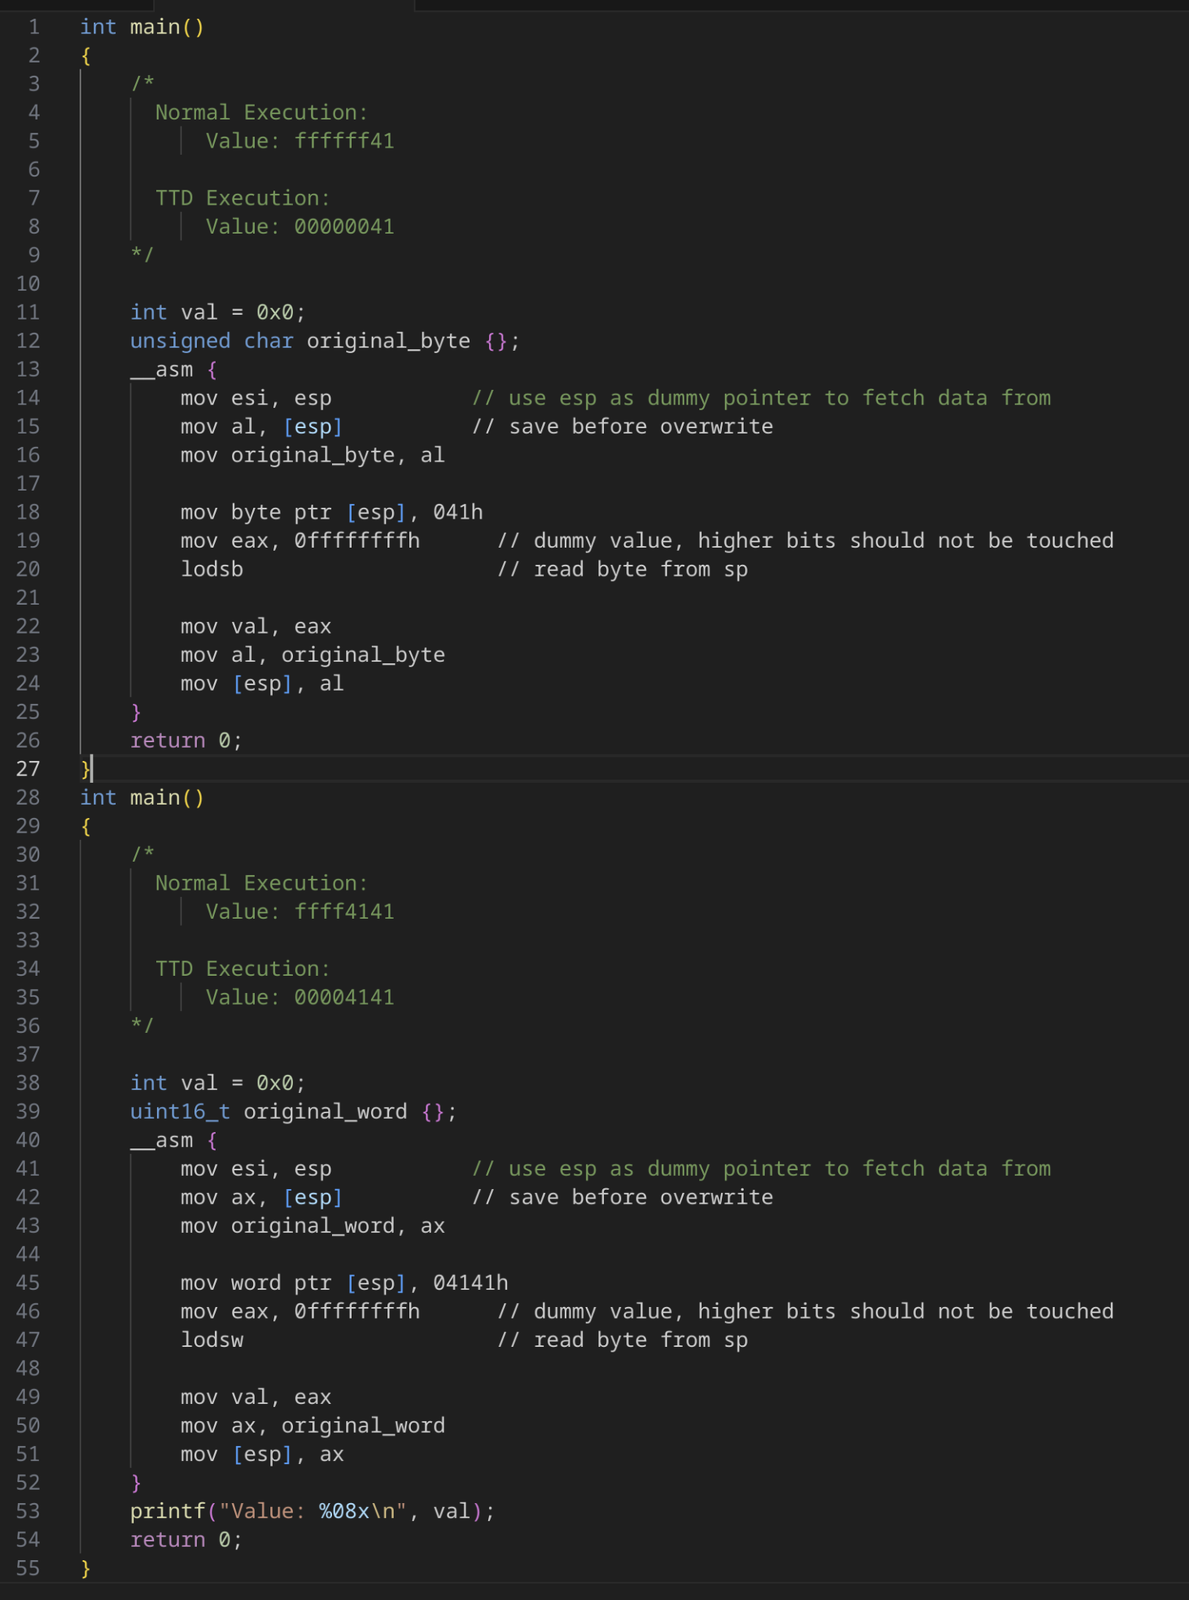
Figure 6: Proof-of-concept for lodsb/lodsw
There are additional instruction emulation bugs pending fixes from Microsoft.
Bug 3: Windbg TTDAnalyze Output Capture Truncation
As we were pursuing our efforts in the CPU emulator, we accidentally stumbled on another bug, this time not in the emulator but inside the Windbg extension exposed by TTD: TTDAnalyze.dll.
This extension leverages the debugger's data model to allow a user to interact with the trace file in an interactive manner. This is done via exposing a TTD data model namespace under certain parts of the data model, such as the current process (@$curproces), the current thread (@$curthread), and current debugging session (@$cursession).
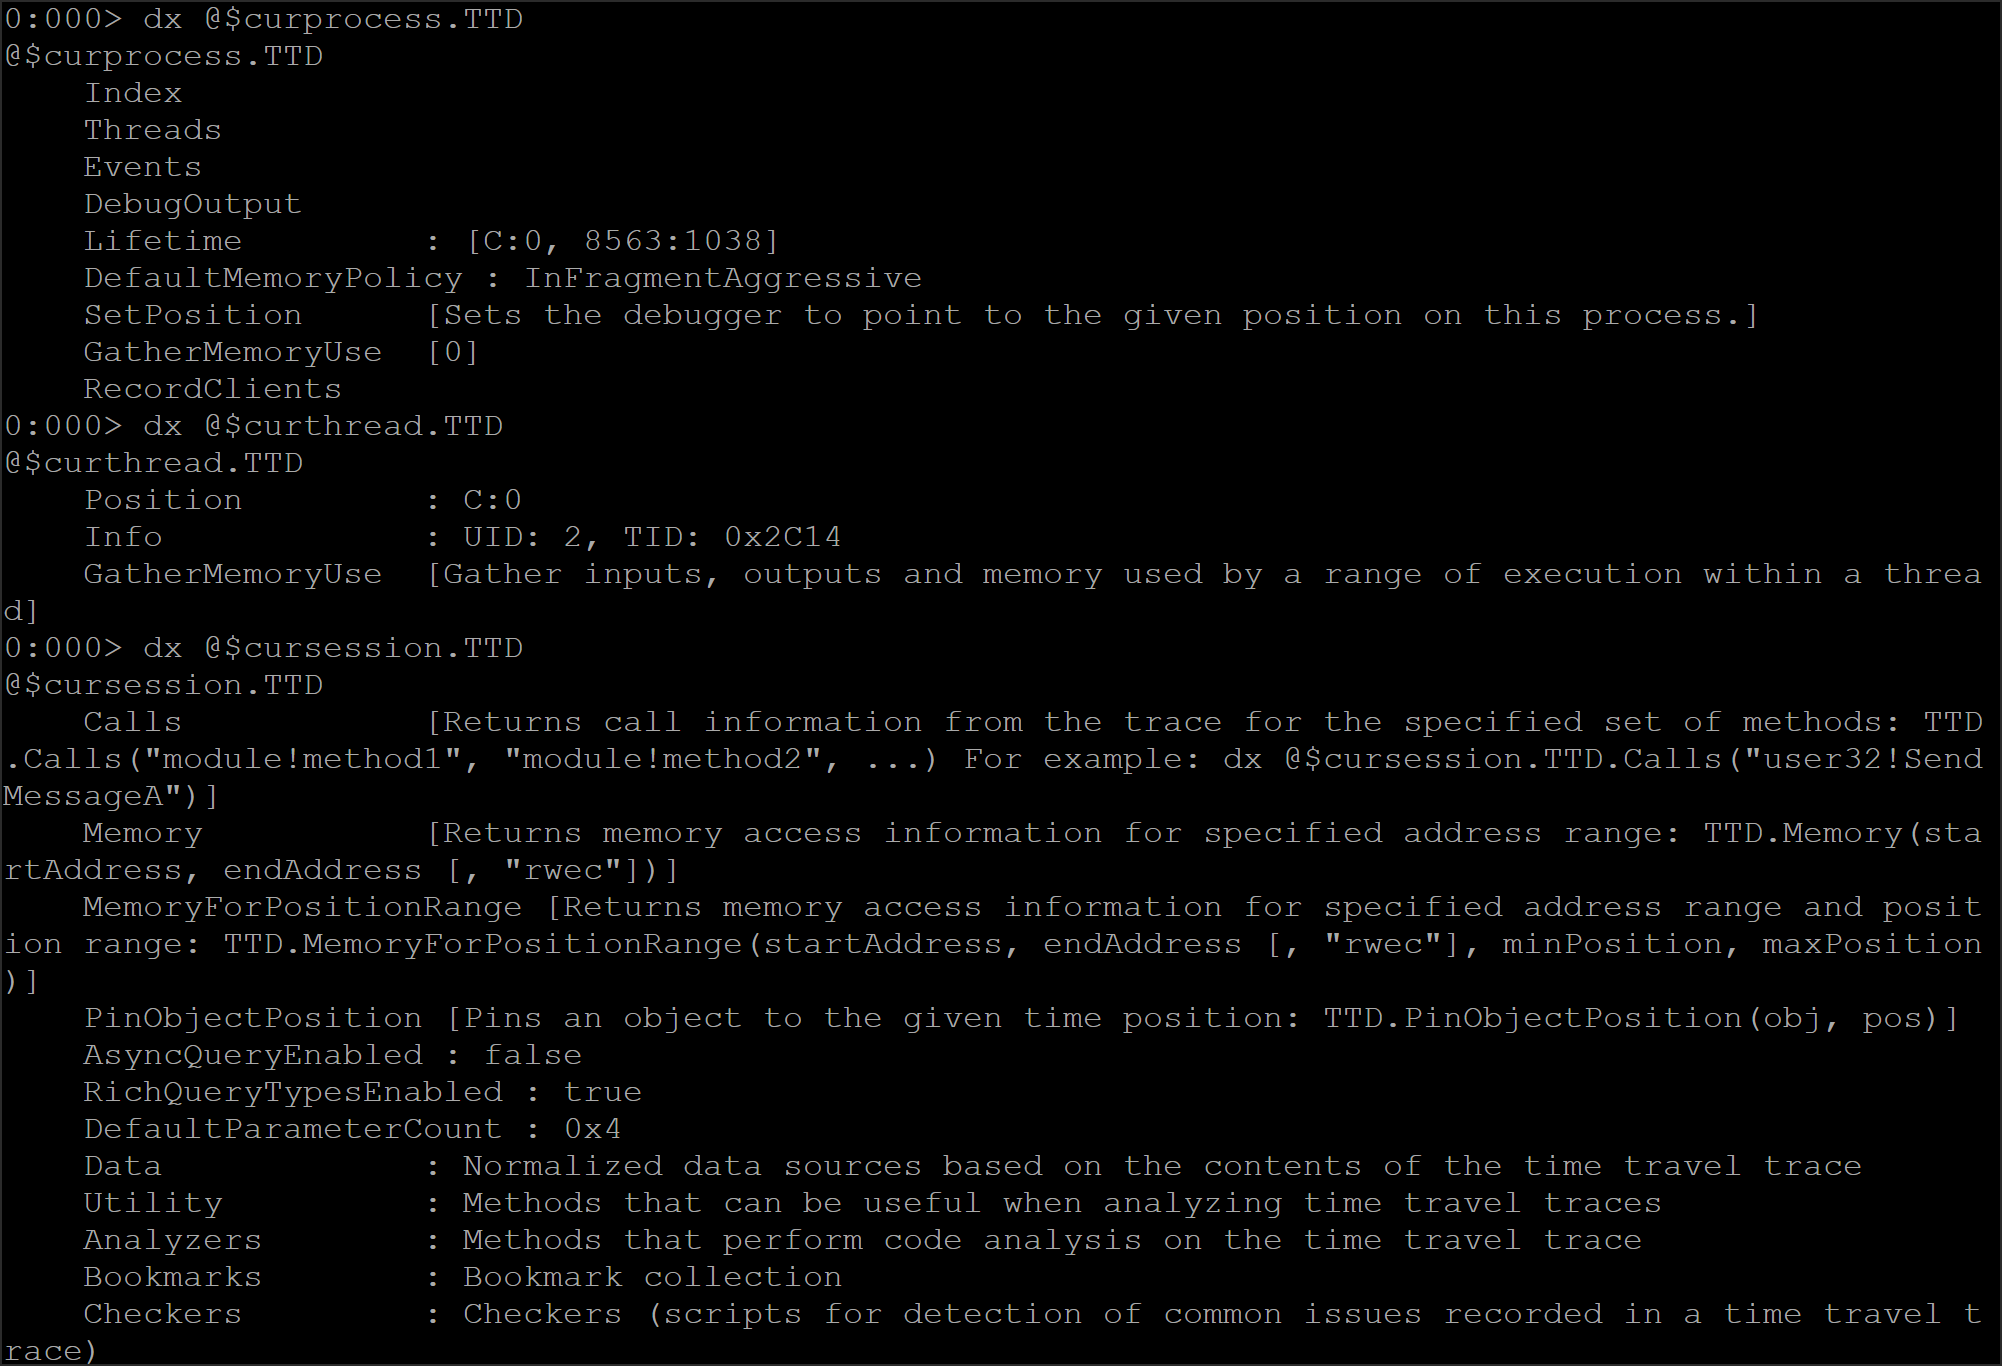
Figure 7: TTD query types
As an example, the @$cursession.TTD.Calls method allows a user to query all call locations captured within the trace. It takes as input either an address or case-insensitive symbol name with support for regex. The symbol name can either be in the format of a string (with quotes) or parsed symbol name (without quotes). The former is only applicable when the symbols are resolved fully (e.g., private symbols), as the data model has support for converting private symbols into an ObjectTargetObject object thus making it consumable to the dx evaluation expression parser.
The bug in question directly affects the exposed Calls method under @$cursession.TTD.Calls because it uses a fixed, static buffer to capture the results of the symbol query. In Figure 8 we illustrate that by passing in two similar regex strings that produce inconsistent results.
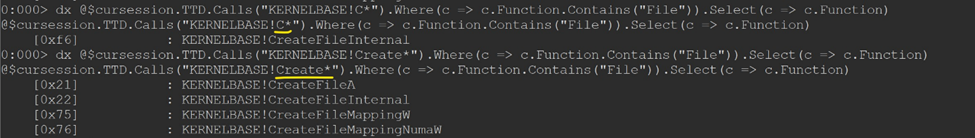
Figure 8: TTD Calls query
When we query C* and Create*, the C* query results do not return the other Create APIs that were clearly captured in the trace. Under the hood, TTDAnalyze executes the examine debugger command "x KERNELBASE!C*" with a custom output capture to process the results. This output capture truncates any captured data if it is greater than 64 KB in size.
If we take the disassembly of the global buffer and output capture routine in TTDAnalyze (SHA256 CC5655E29AFA87598E0733A1A65D1318C4D7D87C94B7EBDE89A372779FF60BAD) prior to the fix, we can see the following (Figure 9 and Figure 10):
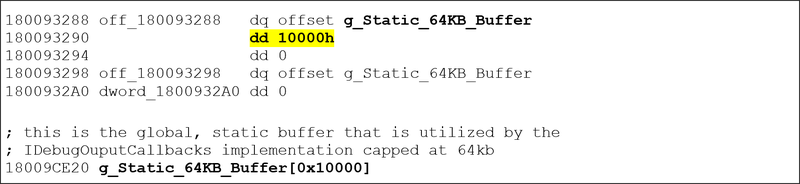
Figure 9: TTD implementation disassembly
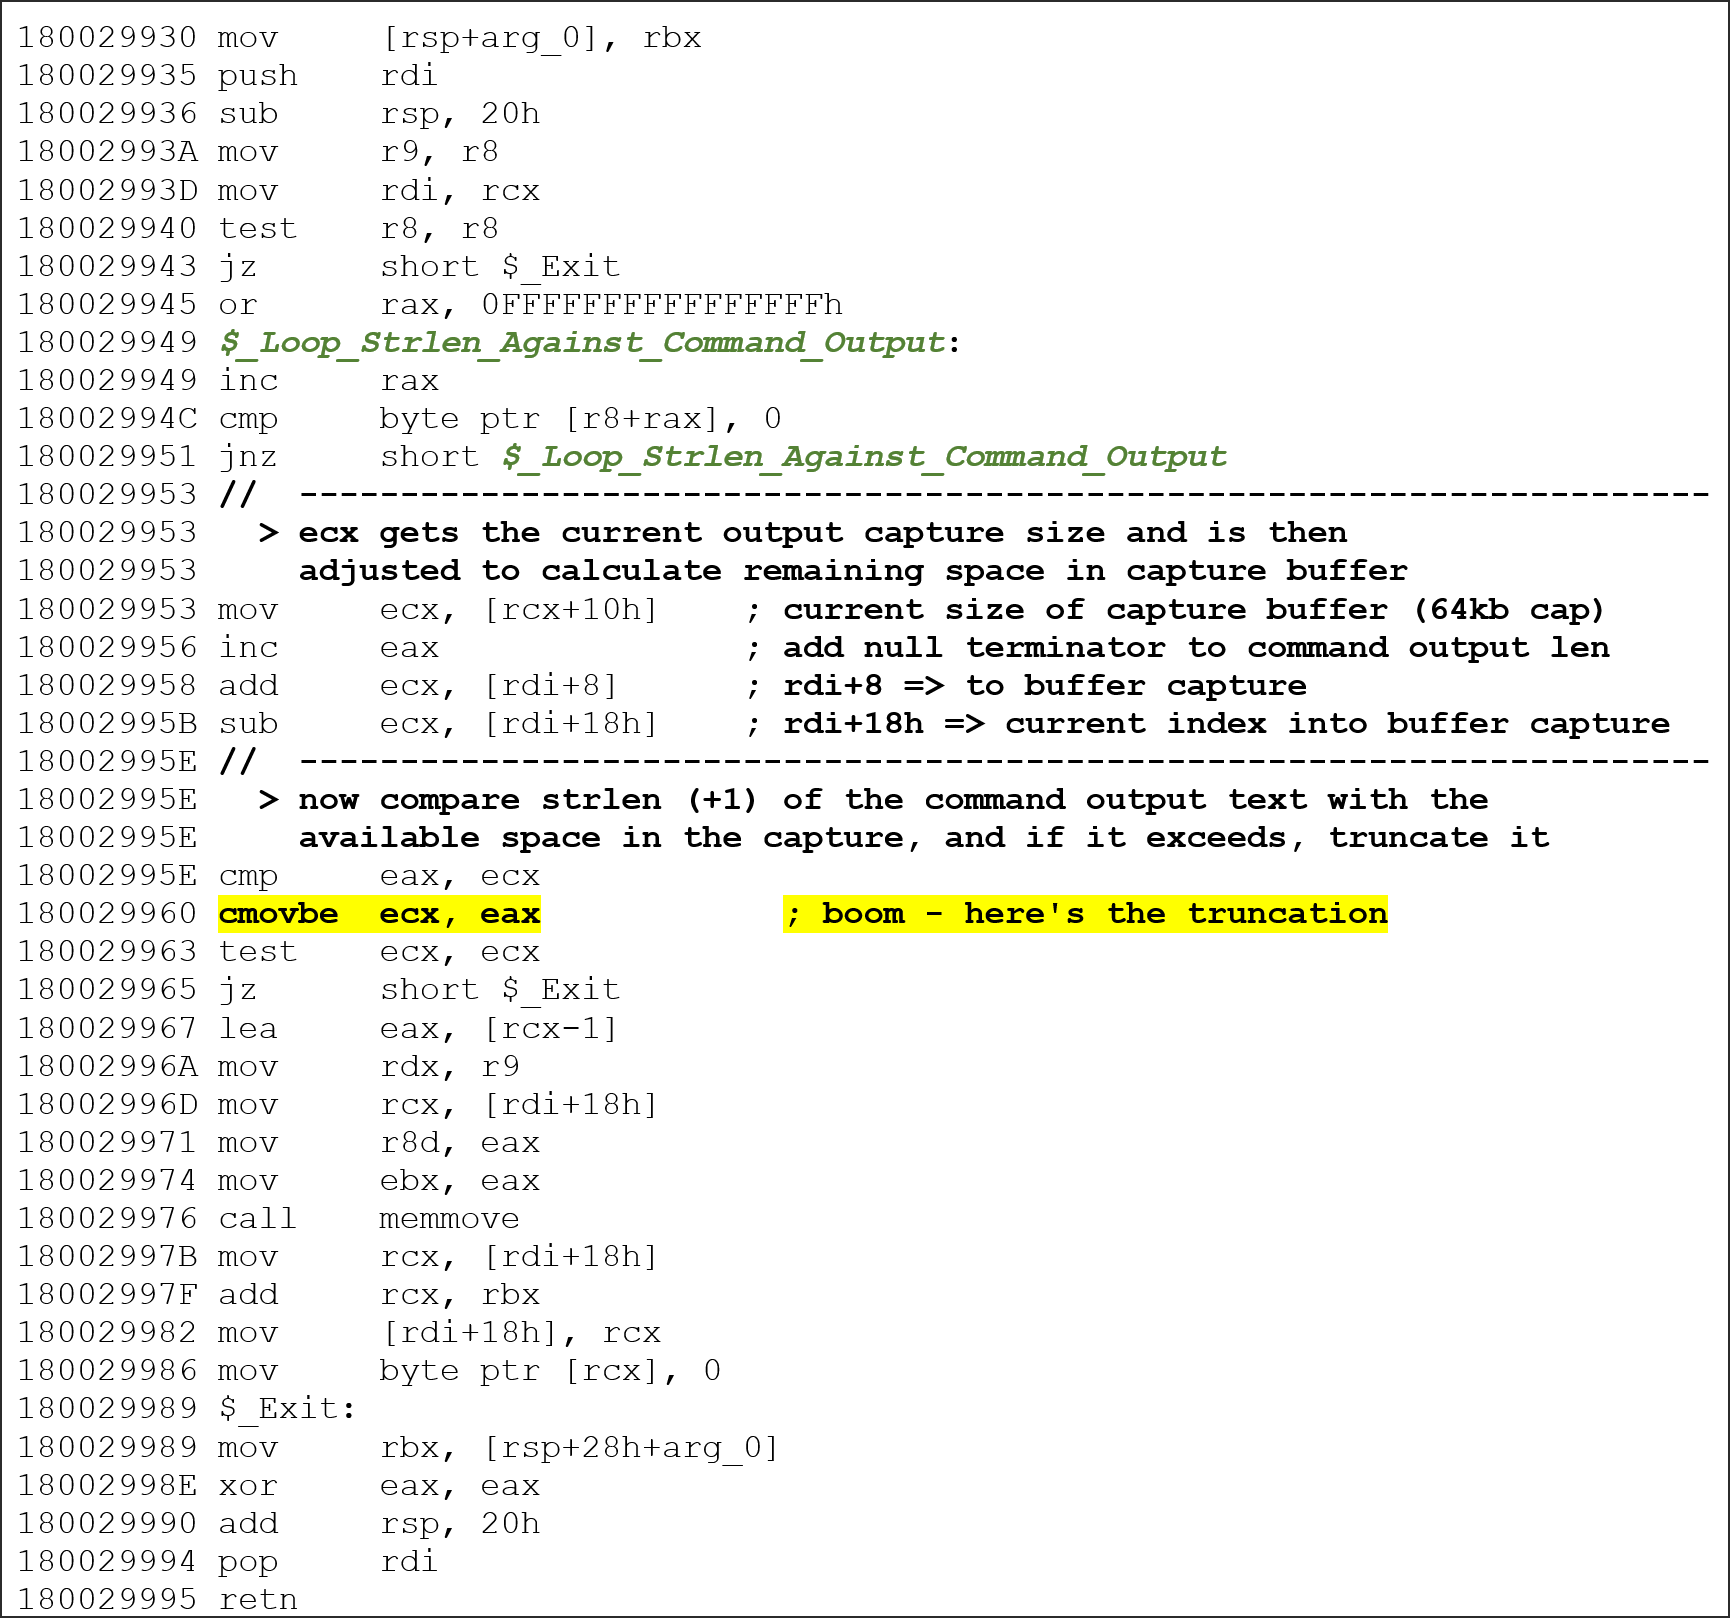
Figure 10: TTD implementation disassembly
The capture for the examine command is capped at 64 KB. When the returned data exceeds this limit, truncation is performed at address 0x180029960. Naturally querying symbols starting with C* typically yields a large volume of results, not just those beginning with Create*, leading to the observed truncation of the data.
Final Thoughts
The analysis presented in this blog post highlights the critical nature of accuracy in instruction emulation—not just for debugging purposes, but also for ensuring robust security analysis. The observed discrepancies, while subtle, underscore a broader security concern: even minor deviations in emulation behavior can misrepresent the true execution of code, potentially masking vulnerabilities or misleading forensic investigations.
From a security perspective, the work emphasizes several key takeaways:
-
Reliability of Debugging Tools: TTD and similar frameworks are invaluable for reverse engineering and incident response. However, any inaccuracies in emulation, such as those revealed by the misinterpretation of
pop r16,pushsegment, orlods*instructions, can compromise the fidelity of the analysis. This raises important questions about trust in our debugging tools when they are used to analyze potentially malicious or critical code. -
Impact on Threat Analysis: The ability to replay a process's execution with high fidelity is crucial for uncovering hidden behaviors in malware or understanding complex exploits. Instruction emulation bugs may inadvertently alter the execution path or state, leading to incomplete or skewed insights that could affect the outcome of a security investigation.
-
Collaboration and Continuous Improvement: The discovery of these bugs, followed by their detailed documentation and reporting to the relevant teams at Microsoft and AMD, highlights the importance of a collaborative approach to security research. Continuous testing, fuzzing, and cross-platform comparisons are essential in maintaining the integrity and security of our analysis tools.
In conclusion, this exploration not only sheds light on the nuanced challenges of CPU emulation within TTD, but also serves as a call to action for enhanced scrutiny and rigorous validation of debugging frameworks. By ensuring that these tools accurately mirror native execution, we bolster our security posture and improve our capacity to detect, analyze, and respond to sophisticated threats in an ever-evolving digital landscape.
Acknowledgments
We extend our gratitude to the Microsoft Time Travel Debugging team for their readiness and support in addressing the issues we reported. Their prompt and clear communication not only resolved the bugs but also underscored their commitment to keeping TTD robust and reliable. We further appreciate that they have made TTD publicly available—a resource invaluable for both troubleshooting and advancing Windows security research.
