Making sense of logs with machine learning
Dr. Federica Legger
Member of CMS experiment, CERN
Dr. Grazia Frontoso
Manager, Customer Engineering, Public Sector EMEA North
Hard at work on the border between France and Switzerland, thousands of researchers are using some of the biggest, most complex scientific instruments in the world to examine the smallest particles in our universe. The European Organization for Nuclear Research (CERN), based in Geneva, is one of the world’s largest and most respected research centers. They are famous for being the home of the Large Hadron Collider (LHC), the world’s largest particle accelerator. The CERN data center sits at the heart of a distributed global computing system called the Worldwide LHC Computing Grid, which shares computation resources and experimental data among more than 161 institutions in 42 countries worldwide.
In order to share those resources and data, it relies on a file transfer service that handles on average two million jobs a day, regularly exceeding 60GB/s. All those jobs are logged. The vast majority succeed, but for those that fail, the support team has to trawl through the logs to investigate the problem (a very time-consuming task). Yet finding patterns in the logs may help the team prioritize their efforts, plan resource allocation, accelerate resolution and improve service level objectives. In turn, this will lead to more efficient cooperation between scientists working on the experimental data.
Google Cloud and the CMS experiment worked together in the context of the Operational Intelligence CERN project to study the problem, with a view to automate the identification of anomalous transfers, analyze the message text content and recognize those patterns.
Exploring the data
CMS provided an historical excerpt of about 70 million log entries over several days. Google ingested them in BigQuery and set about exploring them using its BI Engine and Data Studio.
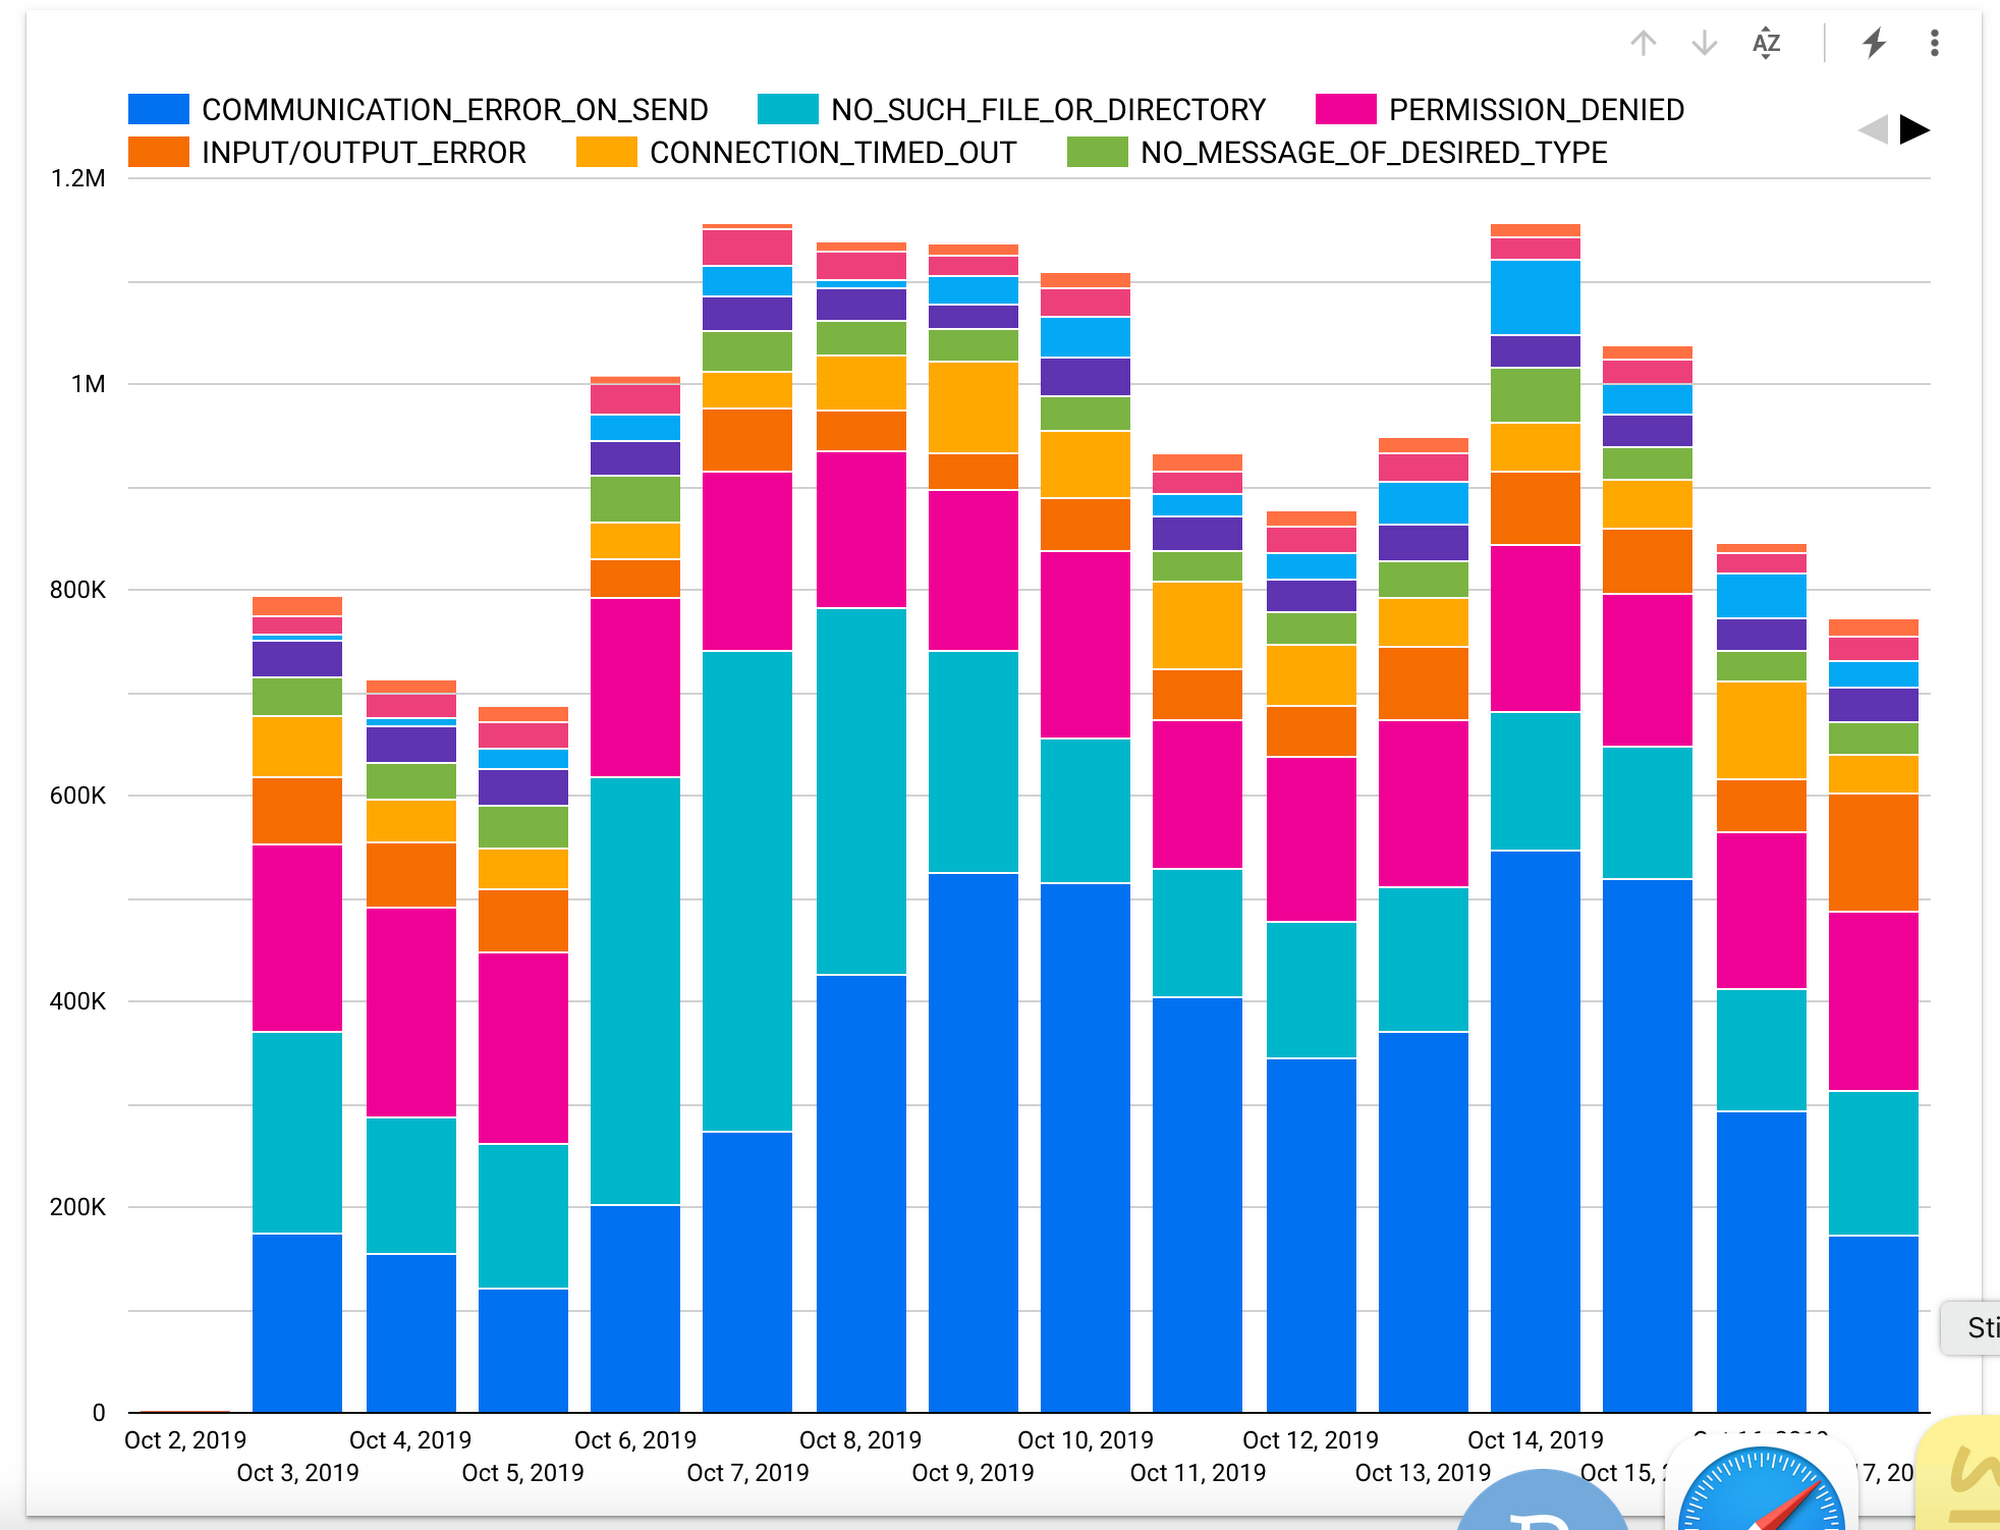
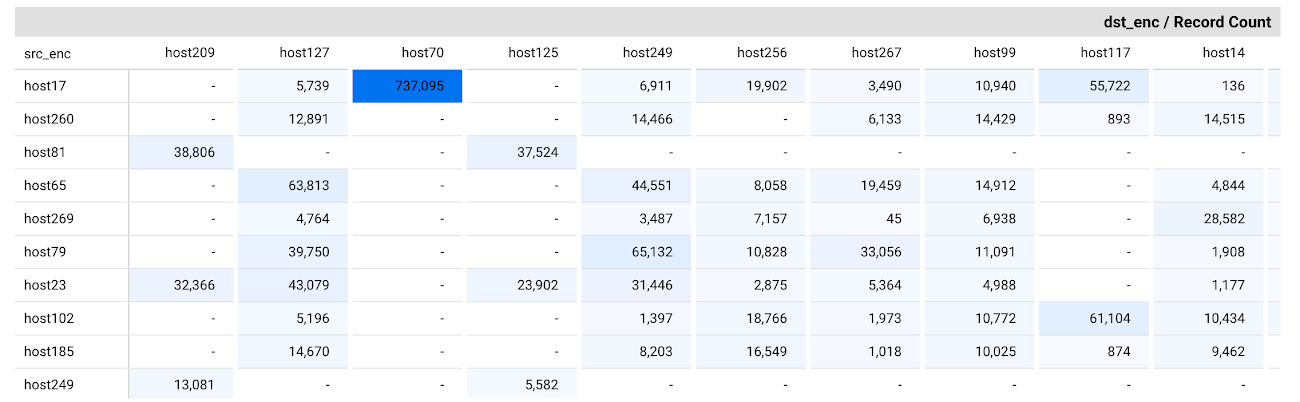
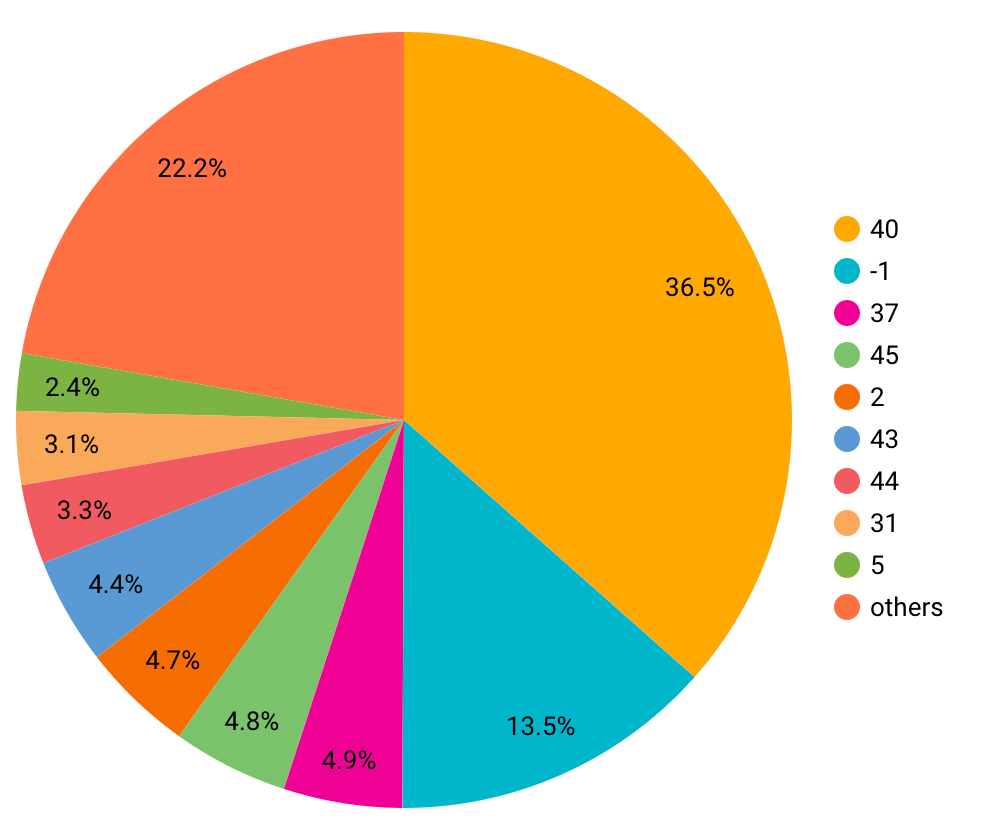
The error distribution was not uniform across categories, with the majority of errors falling into two groups: communication errors and missing files or directories. The distribution varied over time, and among network nodes. A few nodes were responsible for most failures, but the connection pattern varied over time.
Anomaly Detection
A communication network lends itself to representation as a graph. We observed changes in error distribution across time, connections on the graph and content of messages among nodes. Hence, we investigated graph anomaly detection algorithms as a possible way to identify issues in the logs.
Using Google’s AI Platform Notebooks to run several experiments for quick prototyping, we returned an anomaly score for each entry in the data set. The scores were subsequently stored into BigQuery for further analysis. This allowed us to visualize the evolution of the anomalies over time by producing a sequence of network or chord diagrams, which we could display as brief animations in the notebook itself.
Text Analysis
The content of the error messages is useful in identifying patterns and clusters of anomalies. To include it as a feature in our detection algorithm, it is necessary to encode it. For that purpose, we chose Google’s Universal Sentence Encoder.
The model is trained on sentences, phrases and paragraphs rather than just words. Log entries range from a simple “transfer successful” to full paragraphs, tracing errors across the software stack. For messages longer than a few words, a sentence encoder tends to outperform word-based ones in most natural language tasks. While not specifically trained on computer logs, the encoder vocabulary is large enough to include phrases that are likely to appear there. The universal sentence encoder is available in Tensorflow Hub and can be imported in your python code. All the necessary libraries to leverage Universal Sentence Encoder are already included with Vertex AI notebooks. The algorithm encodes text into 512-element floating-point vectors, which we manipulated further to extract topic clusters.
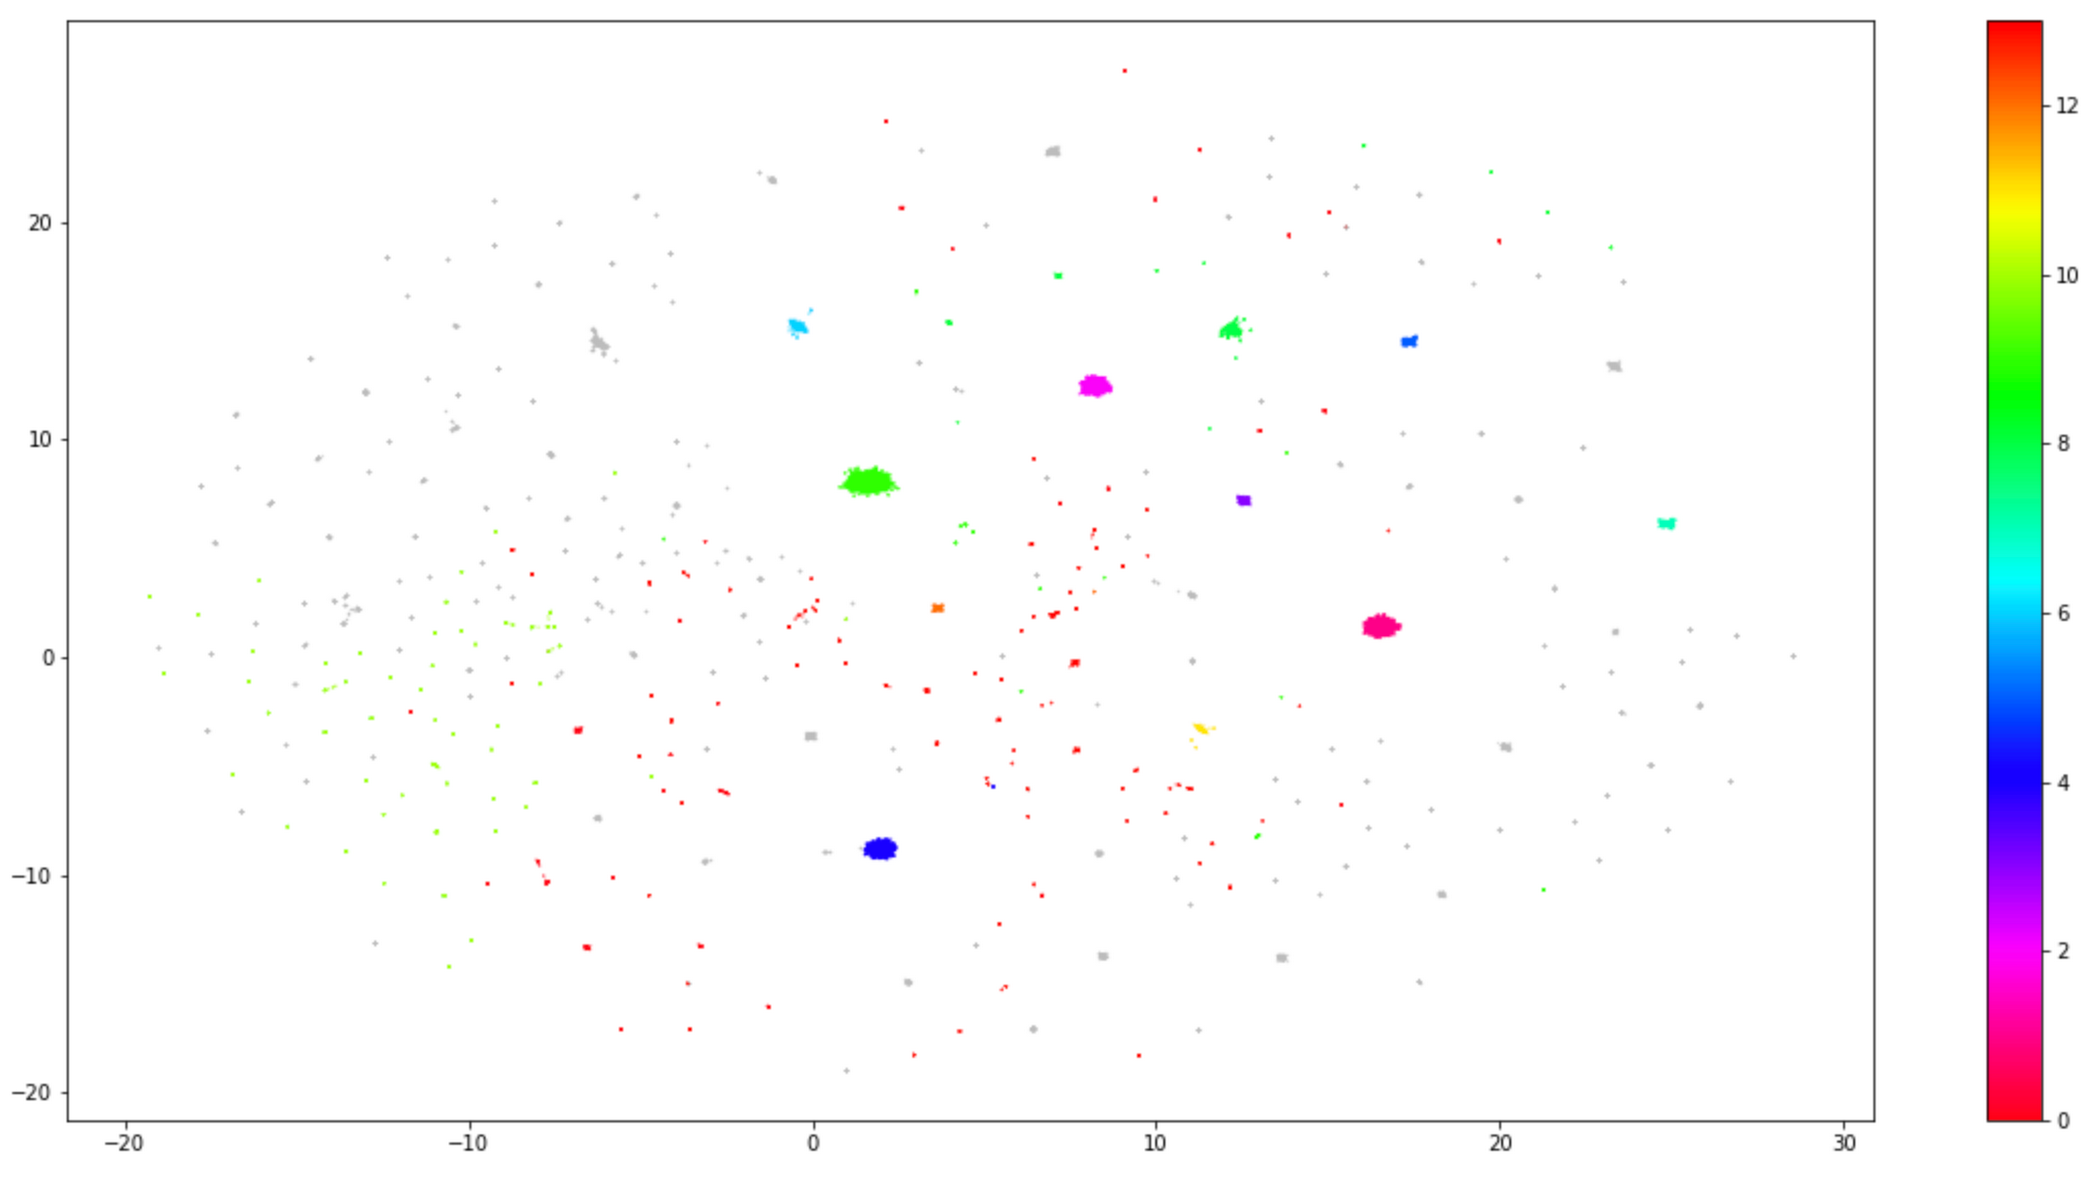
While the main clusters correspond to the categories that already existed in CERN data, we found several more of interest. For each, we could extract the message closest to the cluster center, which can be considered a “template” for the rest. For instance, the second-largest error cluster contained messages such as:
'TRANSFER <...>: the server responded with an error 500 500-Command failed. : System error in open: No such file or directory 500-A system call failed: No such file or directory 500 End.'
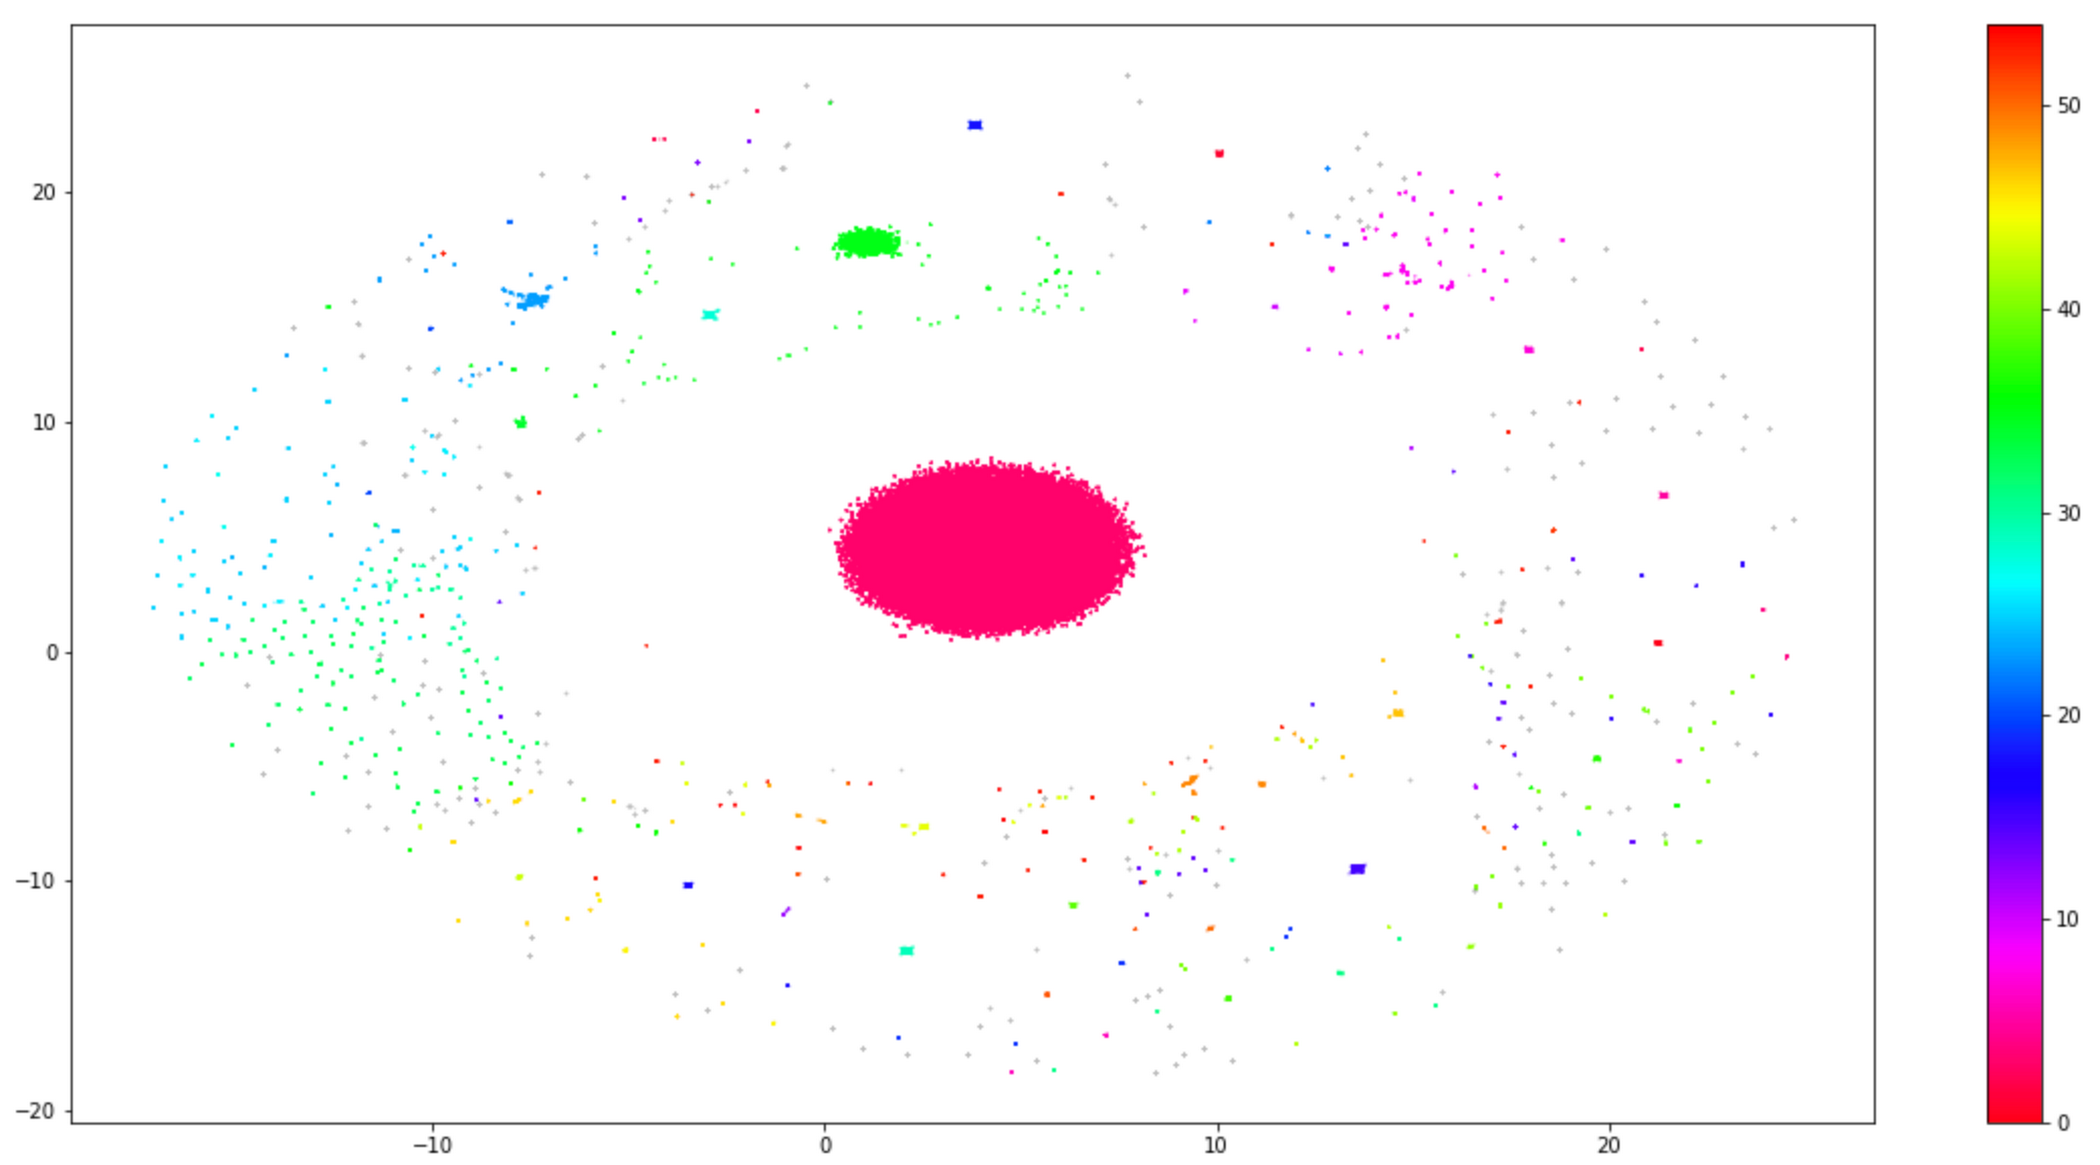
If we include successful transfers as well into the analysis, we’ll have to expect a diagram looking like Figure 5, with a large cluster in the middle representing “success” messages. Errors are normally outliers.
Actionable Information
With the information from anomaly detection and text analysis, one can build a recommender for the support team, which proposes a selection of errors to investigate. Both criteria are useful. For instance:
Common errors (represented as large clusters) may not require a support agent to investigate, because they may already have a prescribed solution. However, if they occur at uncommon times or between unusual nodes, they may indicate an anomaly worth examining.
An uncommon error (belonging to a small cluster) may occur at heavily trafficked times or on heavily trafficked links and cause disruption, hence be worth investigating.
No algorithm is perfect, so one must make sure that whatever selection is chosen, it is actually composed of errors. A useful metric for that is precision-at-k, where k is the number of selected items. In our experiments, with k=1000 most anomalous entries, we obtained a precision of 85% or better, thus making our selection quite relevant.
Next Steps
Given the promising results of this study, we plan to finalise and deploy in production a recommendation engine for operators based on the techniques described above. Issue severity will be calculated by correlating with information from the ticketing systems used by the operators for past issues. The aim is to provide the operators with a list of the most severe issues to be addressed, as well as with suggestions on actions to take (such as opening a ticket, escalating to experts, etc.). The final goal is the complete automation of this process.
The experiment can be generalized to process other types of communication logs or log streams, including information such as commercial transaction records over time. One can also include other categorical and numerical information too, such as quantities, product codes, etc. (rather than just text descriptions).
Want to give it a try? Once you sign up for Google Cloud, you can deploy an AI Platform notebook and experiment with the Universal Sentence Encoder.
There is no need to rewrite from scratch; you can explore our patterns for anomaly detection with streaming analytics.