Route Datadog monitoring alerts to Google Cloud with Eventarc
Mete Atamel
Cloud Developer Advocate
Route Datadog monitoring alerts to Google Cloud with Eventarc
A few weeks ago, we announced third-party event sources for Eventarc, with the first cohort of third-party providers by our ecosystem partners. This blog post describes how to listen for events from one of those third-party providers, Datadog, and route them to a service in Google Cloud via Eventarc.
Datadog is a monitoring platform for cloud applications. It brings together end-to-end traces, metrics, and logs to make your applications and infrastructure observable. In Datadog, you can create monitors that track metrics, events, logs, integration availability, and network endpoints, and you can set alert thresholds on those monitors. Once these thresholds are reached, Datadog notifies your teams or services via email, Slack, and now a Google Cloud service via Eventarc.
Let’s take a look at what it takes to set up one of those monitors and notify a Google Cloud service when a threshold is reached.
Discover the Datadog provider
An Eventarc provider is a service or entity that can emit events directly to Google Cloud; those events are then routed to your project. Third-party providers, such as Datadog, are non-Google Cloud providers that are integrated with Google Cloud through Eventarc.
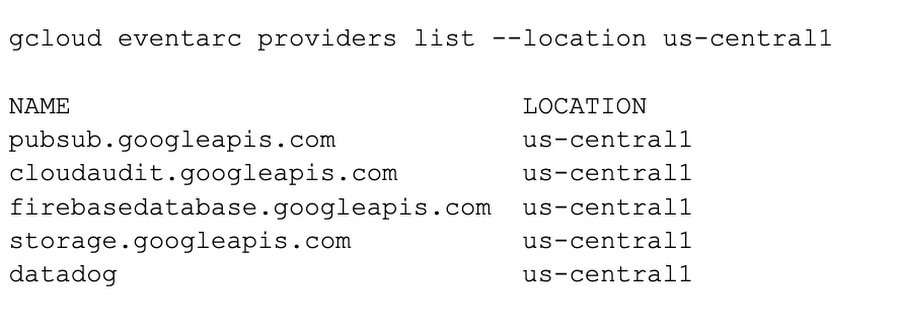
You can see all Google Cloud providers (and also the Datadog provider) in a region in Google Cloud Console or using gcloud:

Create a channel
To receive events from a provider, you need to set up a channel. The process involves creating and activating the channel with the provider:
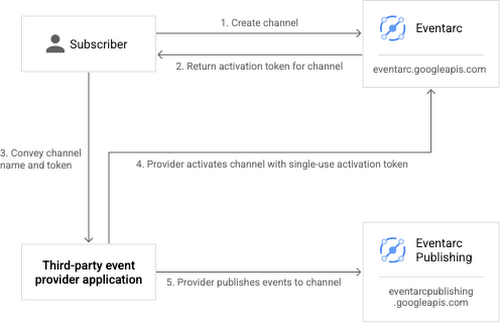

Event subscription flow
You can create a Datadog channel from the Eventarc section of Google Cloud Console:
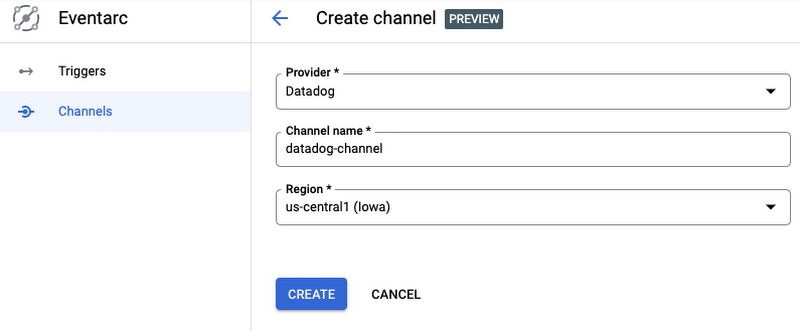

Creating a channel
The channel will be in a pending state until you send the activation token to Datadog:
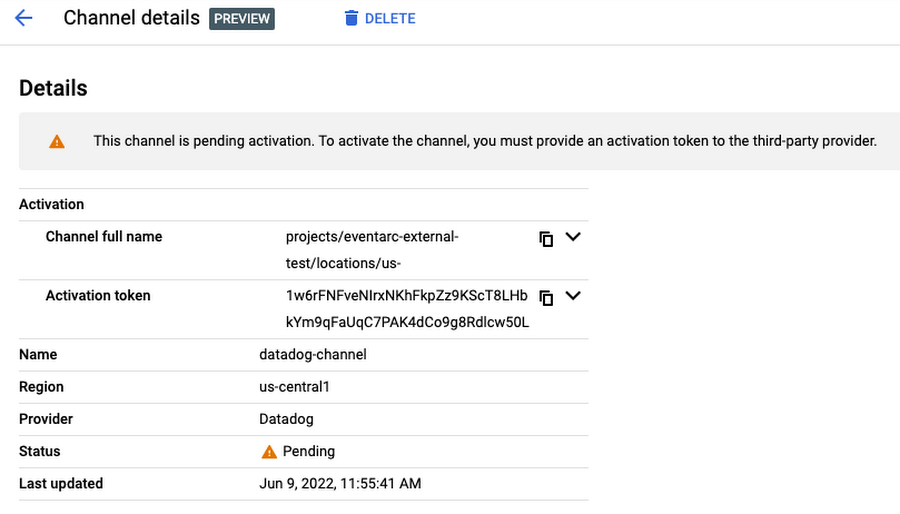

Channel in a pending state
Login to Datadog, go to the integrations page, and make sure the Google Eventarc integration is installed:
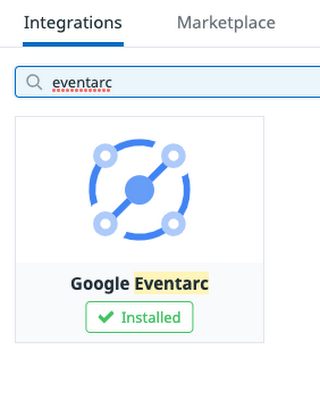

Google Eventarc integration
In the configuration section of the Google Eventarc integration, enter the full channel name and the activation token:
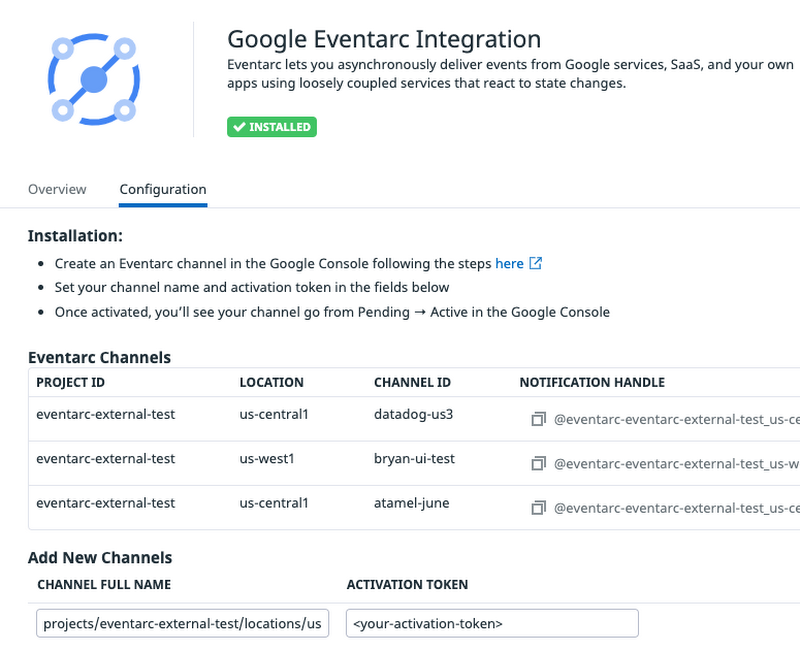

Google Eventarc integration
After a few seconds, you should see the channel become active in Google Cloud Console:
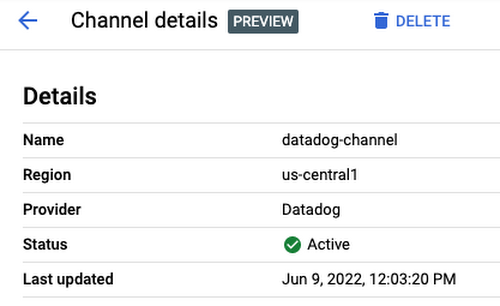

Channel in an active state
Now, you're ready to use the channel.
Create a workflow
You need a destination in Google Cloud to receive events from Datadog. Eventarc supports a number of event destinations including Cloud Run, Workflows, and Kubernetes services. In this case, deploy a workflow to simply log the received events.
Note that the workflow is receiving an event as a parameter. This event will come from Datadog monitoring via Eventarc. Once the event is received, the workflow simply logs the received event.
Create an Eventarc trigger
You are now ready to connect events from the Datadog provider to Workflows with an Eventarc trigger.
Create a trigger with the Datadog channel, event type, and the workflow destination:
Create a Datadog monitor
You are now ready to create a Datadog monitor and connect it to Eventarc. In this example, it is a simple Hello-World type monitor with default values. You will manually trigger it to generate the monitoring alerts, which in turn will generate an Eventarc event in Google Cloud.
To create a monitor in Datadog, first log in to Datadog. Then hold the pointer over Monitors in the main menu and click New Monitor. There are many monitor types. Choose the Metric monitor type.
In the New Monitor page, leave the defaults for steps 1 and 2.
- In step 3, set
Alert thresholdto 1 - In step 4, set
Test monitor for Eventarcas the monitor name and setNotify your teamto@eventarc_<your-project-id>_<your-region>_<your-channel-name>
Test the Datadog and Eventarc integration
To test the Datadog monitor and the Eventarc trigger, you can manually trigger the monitor.
At the bottom of the monitor creation page, click theTest Notifications button:

Then, click the Run Test button:
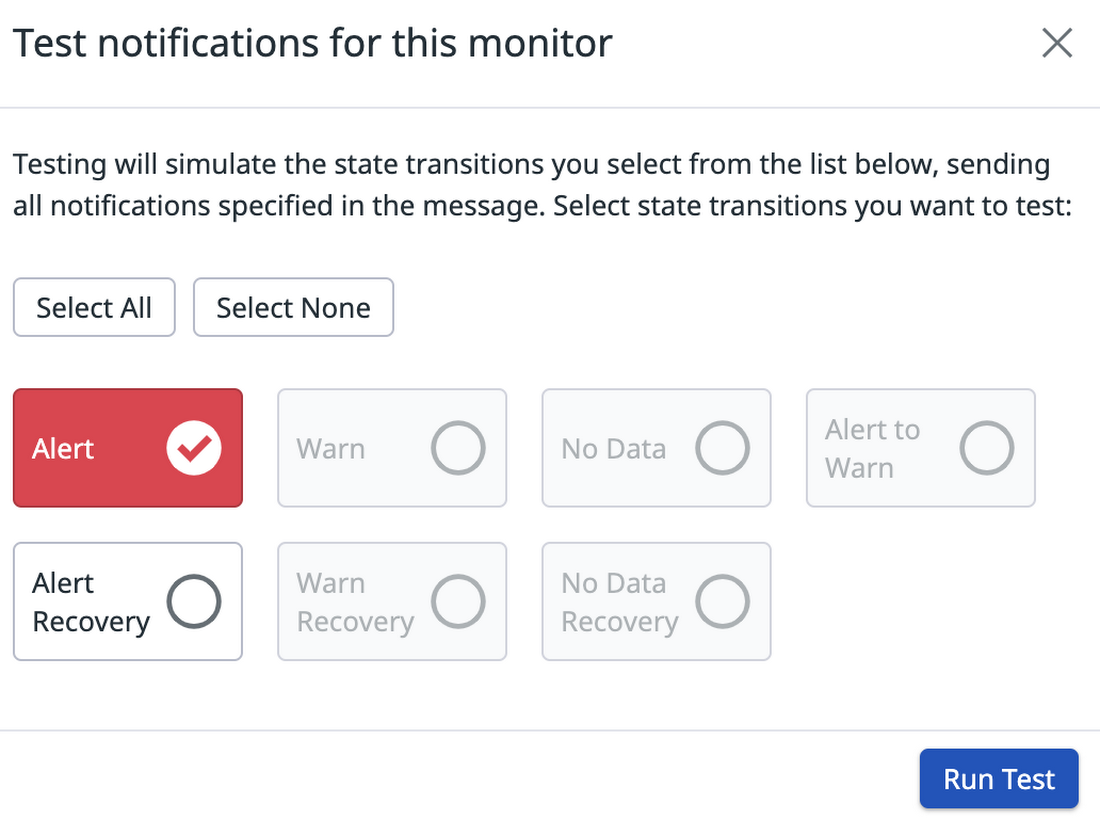

Test notifications
This should simulate the state transition in the monitor and trigger an Eventarc event. In the workflow, you should see that there's a new execution. In the details of that execution, you should see the Datadog event type datadog.v1.alert generated from the monitoring alert in the input of the workflow and also in the logs:
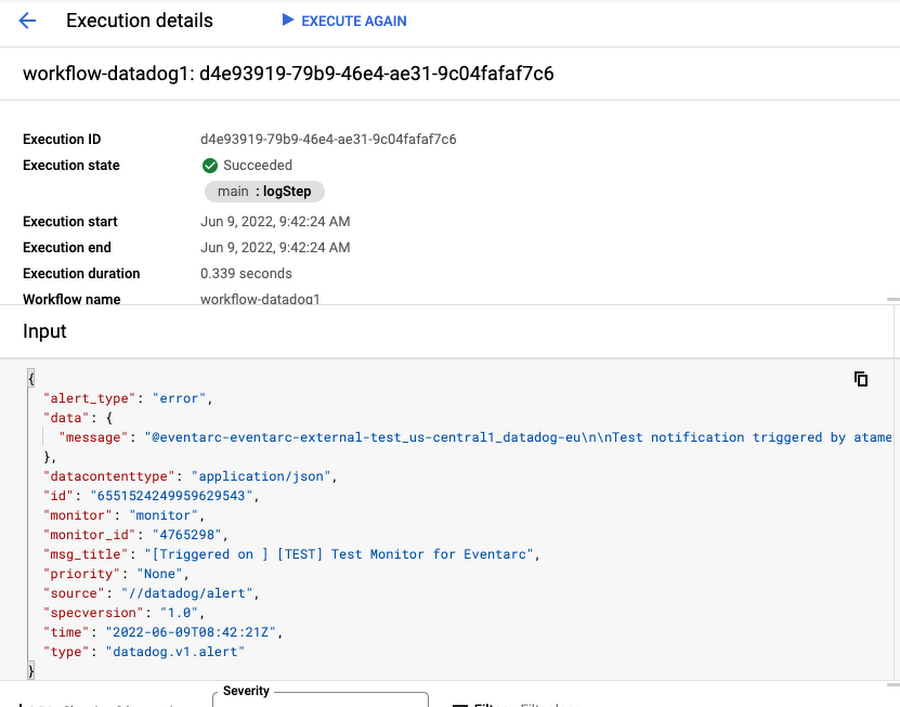

Workflows execution
Next steps
This post covered how to route Datadog monitoring alerts to Google Cloud with Eventarc. If you want to run through these steps in your own project, we have a codelab that you can try.
It is only useful to listen for alerts if you can act upon them. In this second codelab, you will learn how to respond to Datadog monitoring alerts with Workflows. More specifically, you will create two Compute Engine virtual machines and monitor them with a Datadog monitor. Once one of the VMs is deleted, you will receive an alert from Datadog to Workflows via Eventarc. In turn, Workflows will recreate the deleted VM to get the number of running VMs back to two. This is just a simple example of how to automatically respond to Datadog alerts with services in Google Cloud.
Feel free to reach out to me on Twitter @meteatamel for any questions or feedback.
