Going beyond the dashboard paradigm with Looker Components
Kenneth Cunanan
Product Manager, Looker
Try Google Cloud
Start building on Google Cloud with $300 in free credits and 20+ always free products.
Free trialThese days, it’s no secret that traditional business intelligence (BI) is evolving. With the rise of embedded analytics, enterprises everywhere are beginning to seek out opportunities to augment their day-to-day workflows with real-time insights. These data-augmented workflows are what Looker calls “data experiences”.
Some of these experiences are easy to identify and implement: maybe it’s as simple as embedding an analytics dashboard within an existing SaaS application, like Salesforce or Zendesk. Or a company may decide to monetize their analytics by embedding a Looker dashboard inside their own product, enhancing the value of the product for users.
But some of these opportunities may come from embedding data even deeper into applications, so that insights are available the moment a knowledge worker needs to make a decision. These deeper types of experiences are where we think Looker truly shines as a platform.
Looker’s approach to embedded analytics is to make it easier for our customers to continue to build, adapt, and extend their own data experiences by integrating data even deeper into their operational workflows. We also want to make it possible for more of our customers to build these custom data experiences by creating sensible but flexible abstractions for developers.
Analytics as Reusable Components
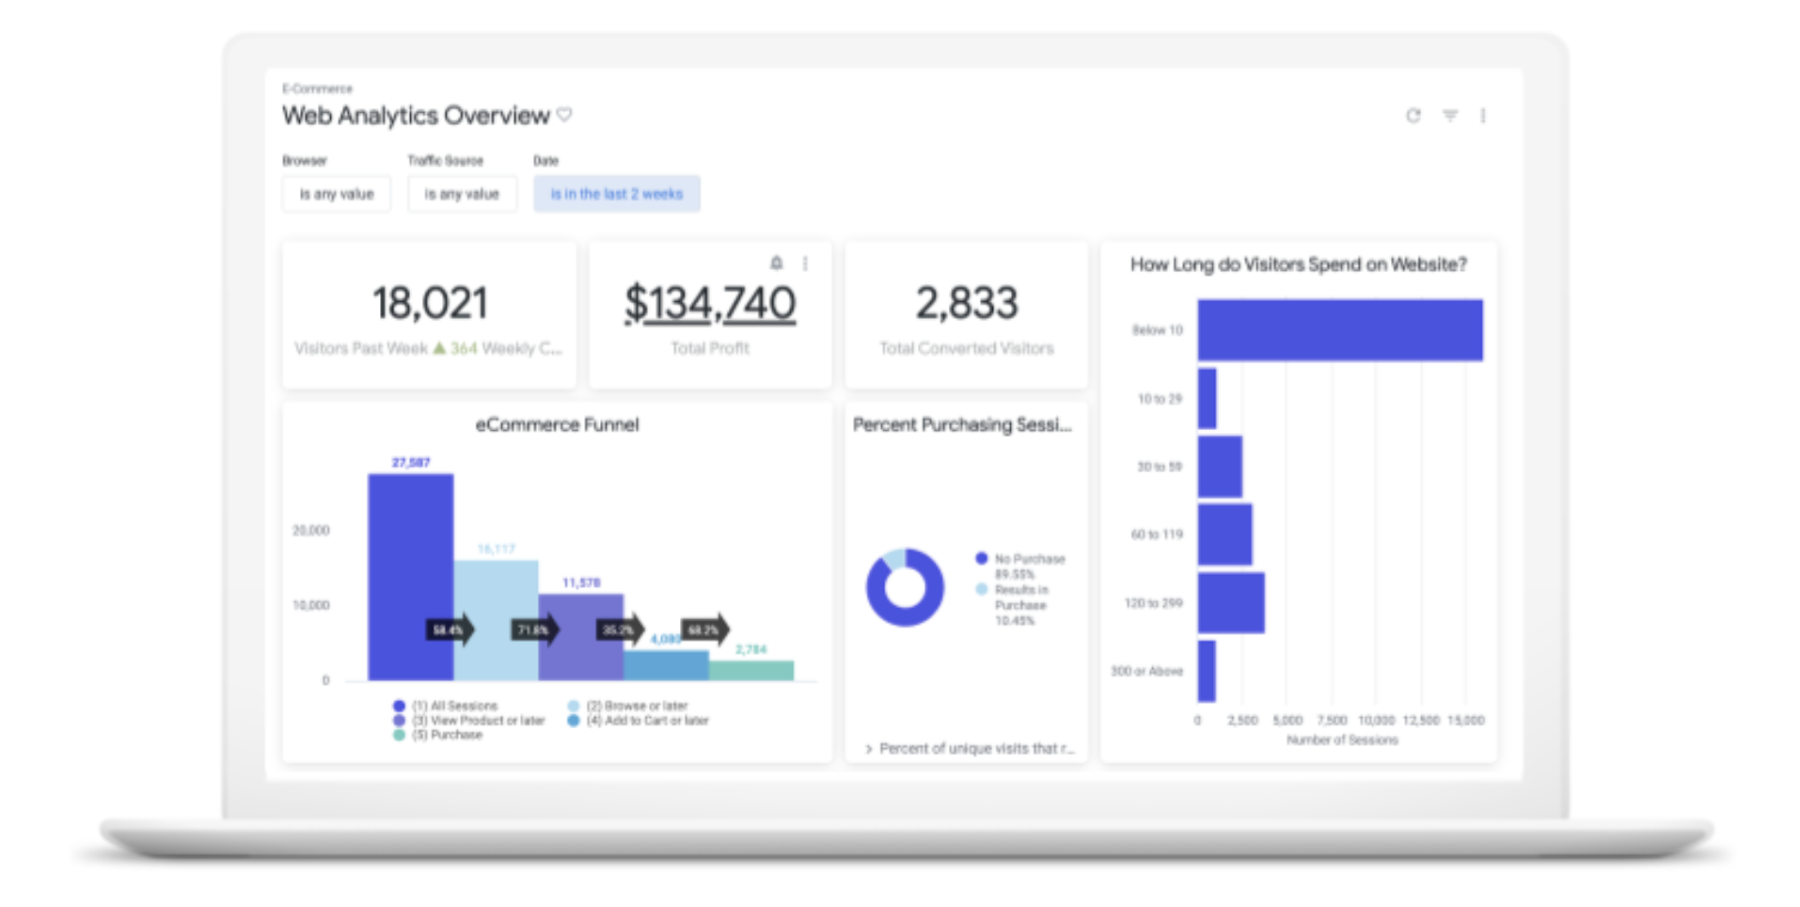
Looker dashboards are integral to the product, providing a powerful interface to view, interact with, and dive deeper into your data.
But data consumption via dashboards is really just one use case for data. There are other data experiences available on the Looker platform, such as exploration, navigation, data curation, and even taking action on your data that we can make easier for our customers to build.
Historically, building these experiences had been challenging, primarily because most of these experiences required a fully custom font-end to be built from the ground up. And sometimes, the amount of time and resources a custom front-end on our API is prohibitive.
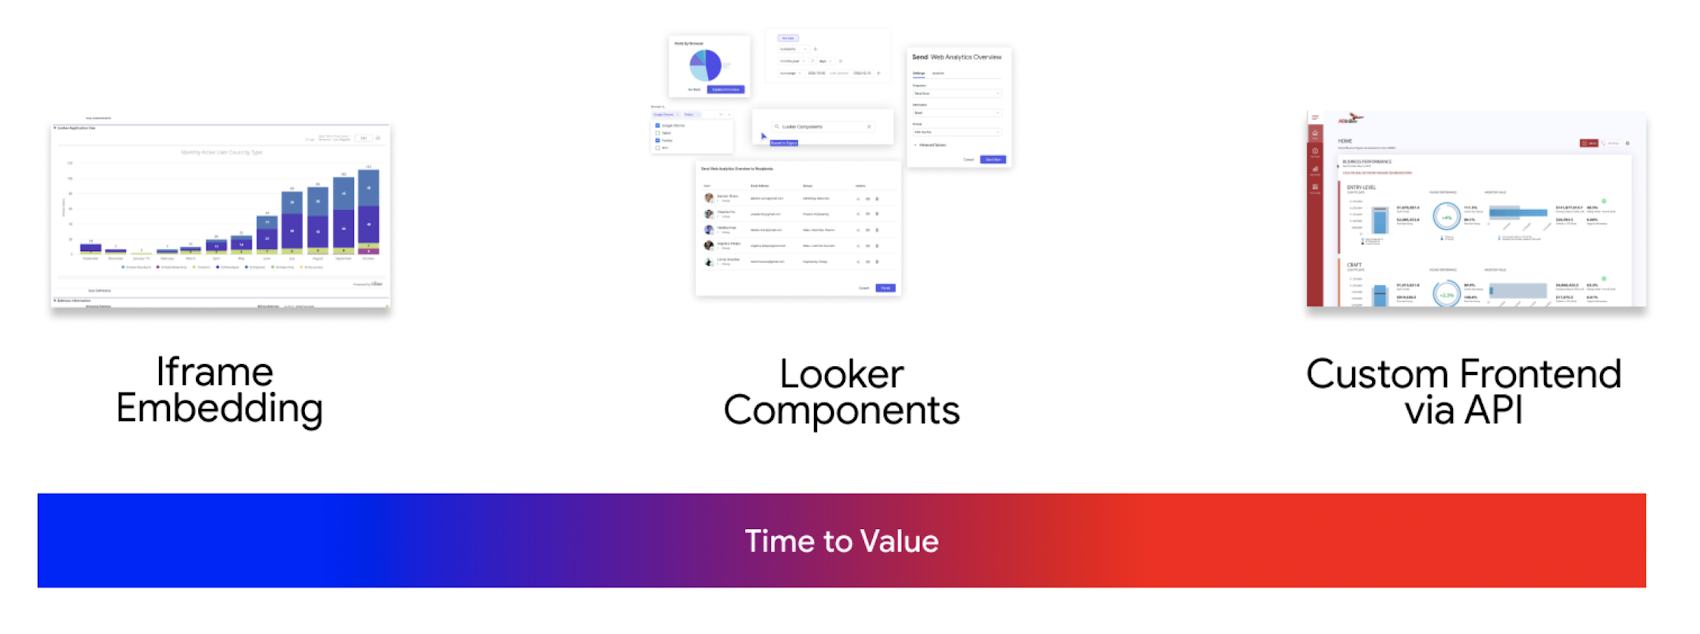
With Looker Components, we hope to introduce a third way to embed data that’s easier to build than a fully-custom front-end on Looker’s API, but offers more flexibility than a monolithic iframe embedded dashboard.
And the way we plan to do this is by identifying and exposing reusable patterns in our dashboards themselves.
Dashboards as a Composition
What if we looked at dashboards not as a monolithic feature, but as a composition of different components and patterns, all of which work together to create a unified experience?
Looker’s dashboards are primarily a composition of three components:
Visualizations, which display queries from the database in a form that can be consumed by the user
Filters, which provide an interface to interact with and manipulate the existing queries on the dashboard
Layout, which enables a user to manipulate the size of the visualizations on the dashboard
What if we made it possible for a developer to pull these powerful patterns out of their Looker dashboards and use them in their own applications?
Introducing: Visualization Components
Today, we are proud to announce Looker visualization components – a new way to surface data from Looker in your application.
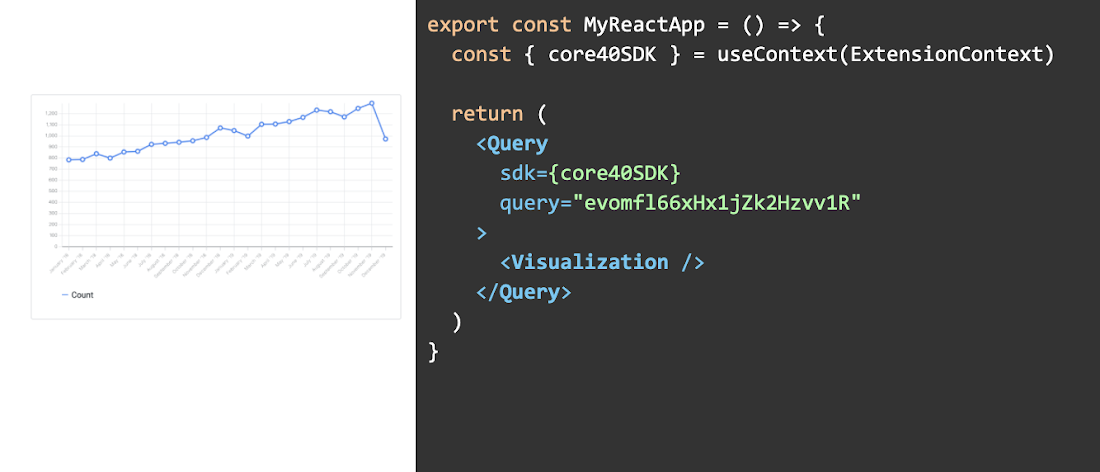
Looker visualization components are an open source package that provides three high-level components to make it easy to build data experiences in any React application:
Query: handles the data fetching and loads the response into context
Visualization: accepts the data returned by Query and utilizes configuration adapters to render the appropriately customized chart on a page.
QueryFormatter: performs light data cleanup and normalization for the purpose of passing query data to a custom visualization.
Using Looker’s SDK, our standard library of charts can be rendered through the use of the Query and Visualization components to request query data and parse the response through our visualization adapters. To build custom visualization that extends our out-of-the-box functionality, developers can use the QueryFormatter component to clean up Looker’s query response before sending the formatted data to a custom visualization that they would build.
Unlike other methods of embedding that Looker offers, visualization components do not require an iframe to present, rendering instead on the client-side of an application. Developers interested in building custom front-end experiences with Looker no longer need to worry about choosing a vis library or worry about learning a new vis framework.
Starting today our package will provide a small selection of visualizations for our customers to begin using. Our initial offering includes Scatter, Line, Area, Sparkline, and Table. These visualizations are an entirely separate visualization layer than the one that’s available within the core Looker product, so while they are compatible with many of the options in Looker’s visualization menu, we don’t have full parity with Looker’s native visualizations yet.
These components have been a labor of love for our team for quite some time. We can’t wait to see how you decide to use visualization components in your applications on Looker.
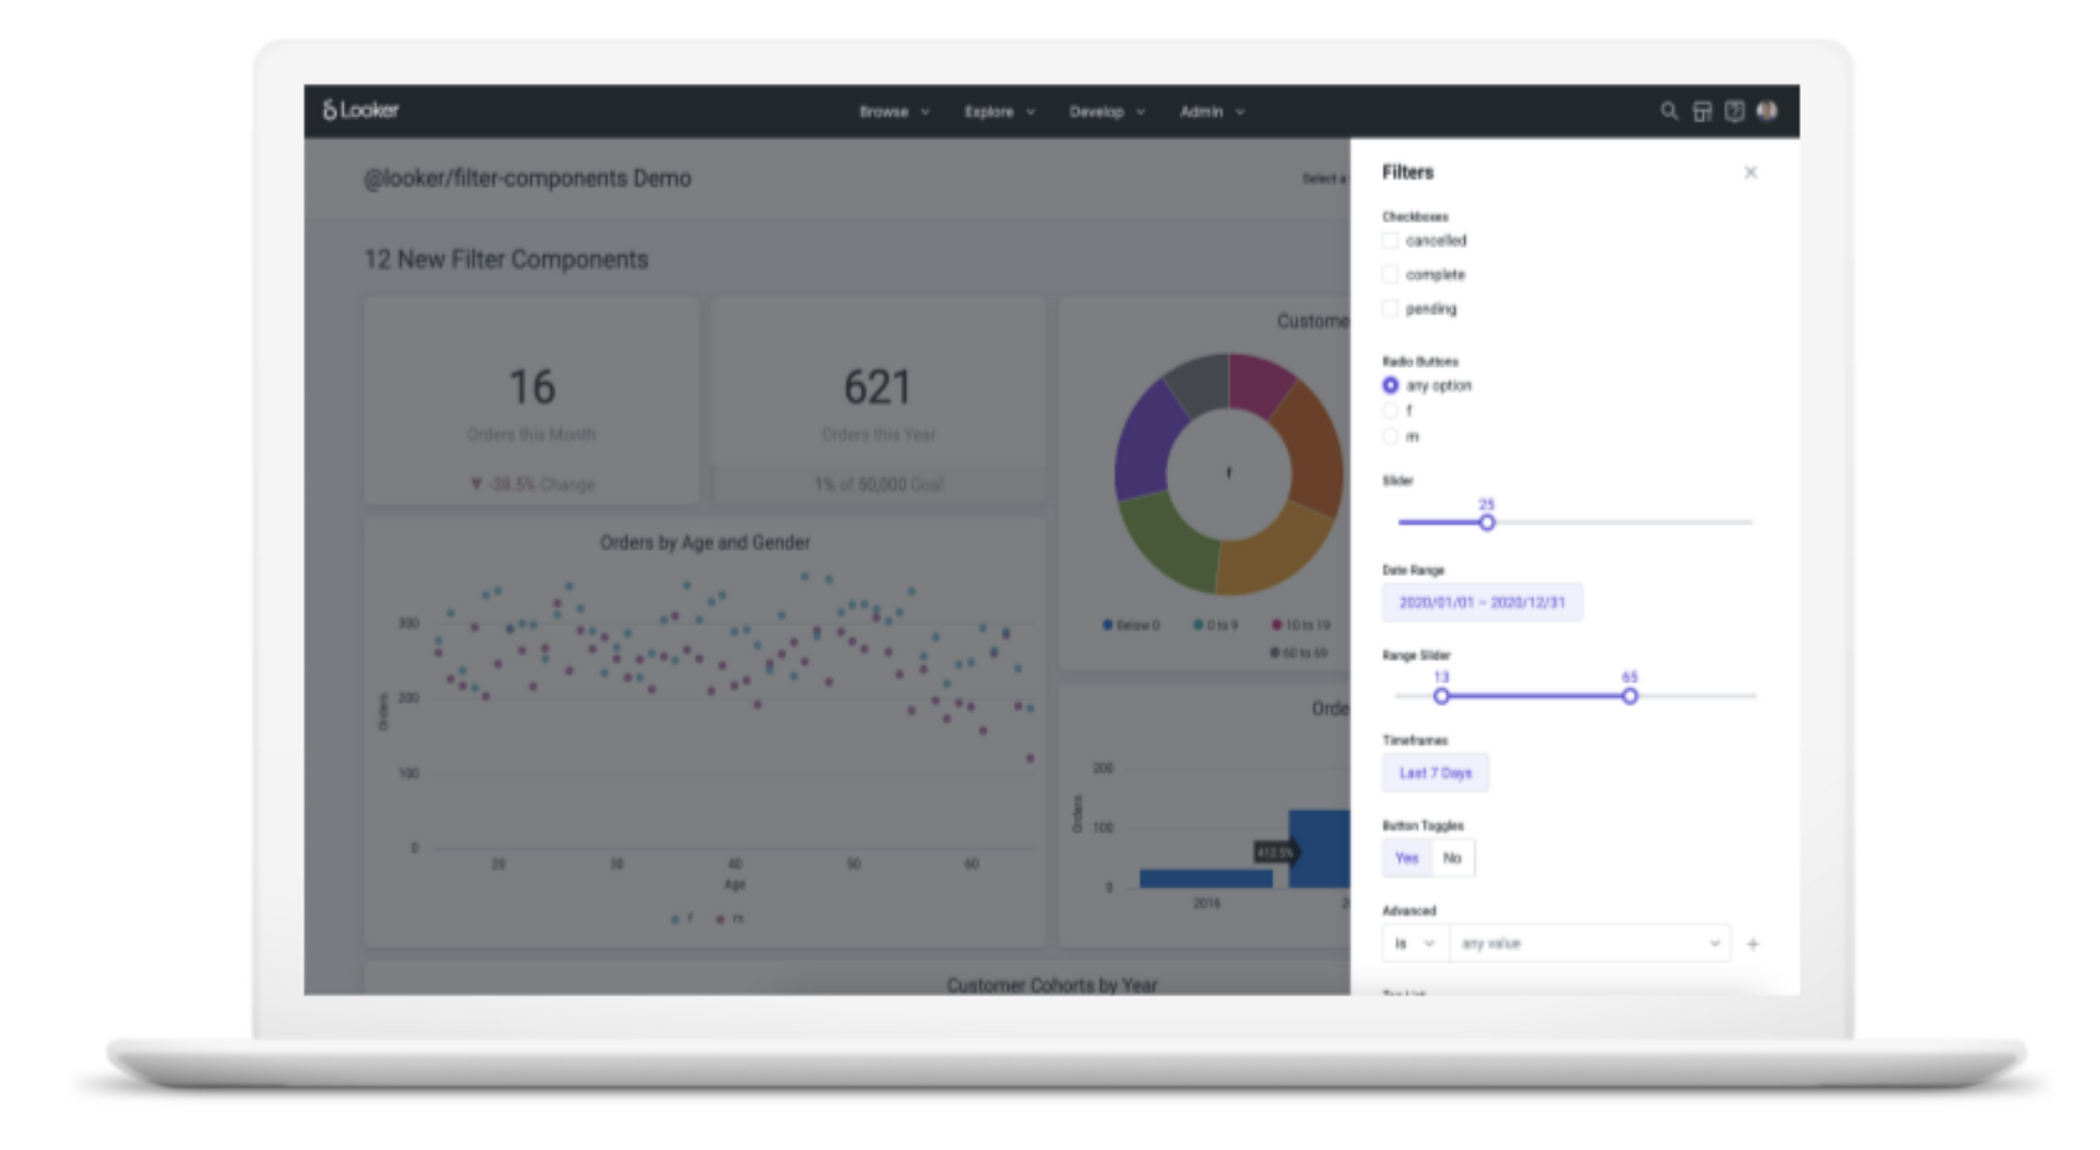
Introducing: Filter Components
Along with meaningful improvements to make it possible for developers to declare individual visualizations outside of Looker, we’ve also made it possible to embed and use Looker dashboard filters in any application or extension on Looker.
A large part of what makes Looker’s dashboard experience so powerful is the ability to filter data using our 12 different types of filters. Using our filter experience, dashboard users have the ability to build complex queries with Looker in a straightforward and streamlined way.
Currently, the best way to use our Filter Components is within an embedded Looker Dashboard, but in the near future, we plan to introduce patterns that make it easy to combine Filter Components with our Vis Components.
Using Filter Components with Embedded Dashboards
Using Looker’s embed SDK, developers can declare a filter component in their application and pass in a relevant dashboard ID to the component. The component will then render the fields displayed from the dashboard.
One of the uniquely defining features of Looker’s filter components is that they are synced to a live Looker dashboard. That means, when you declare filter components in your application and link them to a Looker dashboard, any changes made to the filters on the Looker dashboard are automatically reflected in the filter components in your custom application.
This is great for application developers because they get to declare filters in their embedded application and then offload the management to their SMEs, the analysts. They don’t have to spend their time making manual updates or changes to the filter experience.
Looker’s filter components are also great for analysts because we get to bring them closer to product development. Rather than waiting for a developer to implement a change to a filter, an analyst can implement that change in a Looker dashboard and watch that be reflected in their custom application. This is part of our initiative to give analysts, the SMEs, more control over embedded applications created with Looker.
Now, every data experience built on Looker can benefit from the powerful, flexible, and beautiful user experience that’s a defining feature of Looker’s dashboards. When we unlock the filtering experience for our embedded customers, we ultimately enhance the interaction with the data for all users of embedded applications on Looker.
Building Compositions with Components
Our filter and visualization components are an exciting next step for the Looker platform, and make it possible to embed Looker data into a number of existing data experiences.
We’re also excited by the possibility of our developer community choosing to build wholly bespoke experiences with our 150+ UI components on Looker’s extension framework or within their own custom applications.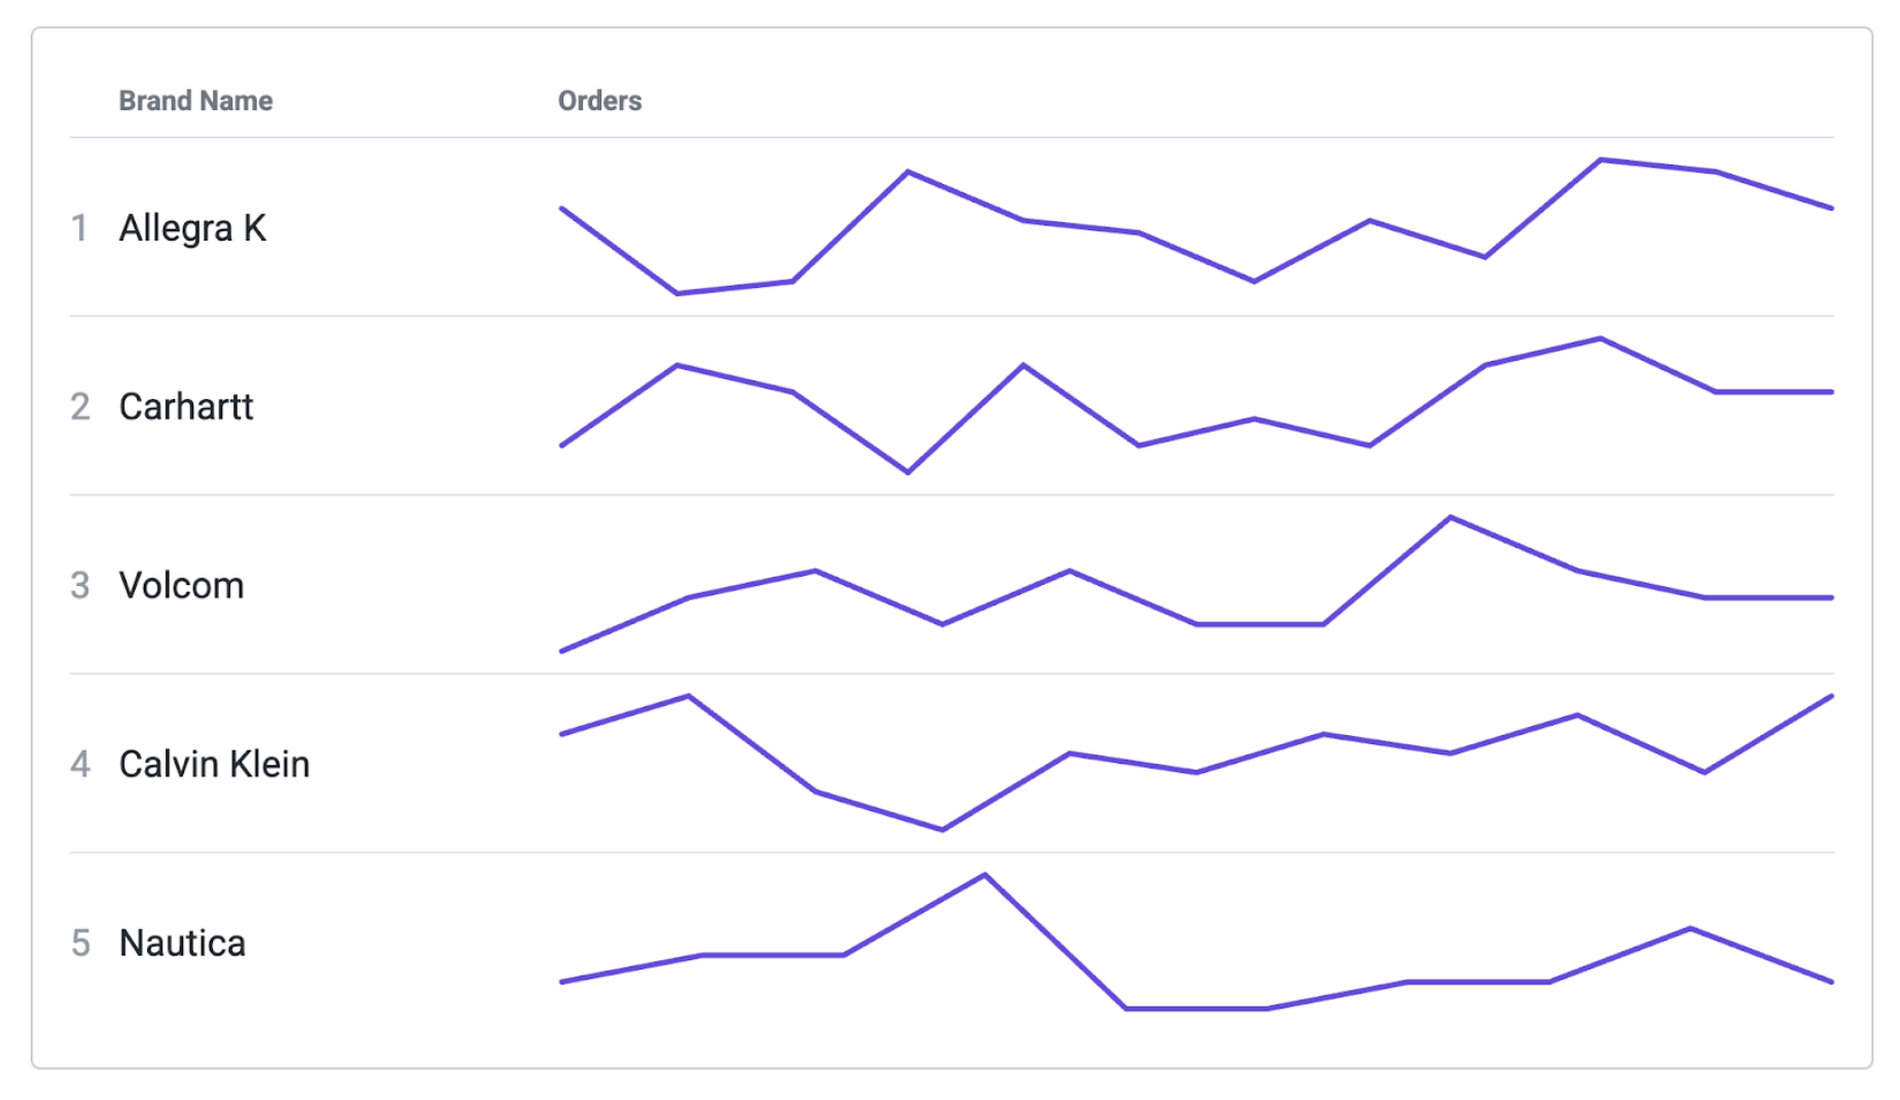
The creativity that we can unlock by building entirely new compositions with Looker components is truly a next step in unlocking the value of composable analytics for the enterprise. To learn more about how using components can help your business grow through data experiences, watch this JOIN 2021 session.