Debugging Vertex AI training jobs with the interactive shell
Rajiv Pasricha
Software Engineer
Training a machine learning model successfully can be a challenging and time consuming task. Unlike typical software development, the results of training depend on both the training code and the input data. This can make debugging a training job a complex process, even when you’re running it on your local machine. Running code on remote infrastructure can make this task even more difficult.
Debugging code that runs in a managed cloud environment can be a tedious and error-prone process since the standard tools used to debug programs locally aren’t available in a managed environment. Also, training jobs can get stuck and stop making progress without visible logs or metrics. Interactive access to the job has the potential to make the entire debugging process significantly easier.
In this article, we introduce the interactive shell, a new tool available to users of Vertex AI custom training jobs. This feature gives you direct shell-like access to the VM that’s running your code, giving you the ability to run arbitrary commands to profile or debug issues that can’t be resolved through logs or monitoring metrics. You can also run commands using the same credentials as your training code, letting you investigate permissions issues or other problems that are not locally reproducible. Access to the interactive shell is authenticated using the same set of IAM permissions used for regular custom training jobs, providing a secure interface to the Vertex AI training environment.
Example: TensorFlow distributed training
Let’s take a look at one example where using the interactive shell in Vertex AI can be useful to debug a training program. In this case, we’ll intentionally submit a job to Vertex AI training that deadlocks and stops making progress. We’ll use py-spy in the interactive shell to understand the root cause of the issue.
Vertex AI is a managed ML platform that provides a useful way to scale up your training jobs to take advantage of additional compute resources. To run your TensorFlow trainer across multiple nodes or accelerators, you can use TensorFlow’s distribution strategy API, the TensorFlow module for running distributed computation. To use multiple workers, each with one or more GPUs, we’ll use tf.distribute.MultiWorkerMirroredStrategy, which uses an all-reduce algorithm to synchronize gradient updates across multiple devices.
Setting up your code
We’ll use the example from the Vertex AI Multi-Worker Training codelab. In this codelab, we train an image classification model on the Tensorflow Cassava dataset using a ResNet50 model pre-trained on Imagenet. We’ll run the training job on multiple nodes using tf.distribute.MultiWorkerMirroredStrategy.
In the codelab, we create a custom container for the training code and push it to Google Container Registry (GCR) in our GCP project.
Submitting a job
Because tf.distribute.MultiWorkerMirroredStrategy is a synchronous data parallel algorithm, all workers must have the same number of GPUs. This is from the MultiWorkerMirroredStrategy docs, which say that “All workers need to use the same number of devices, otherwise the behavior is undefined”.
We can trigger the example deadlock behavior by submitting a training job with different numbers of GPUs in two of our worker pools, and see that this will cause the job to hang indefinitely. Since logs aren’t printed out while the job is stuck, and the utilization metrics won’t show any usage either, we’ll use the interactive shell to investigate. We can get the exact call stack of where the job is stuck, which can be helpful for further analysis.
You can use the Cloud Console, REST API, Python SDK, or gcloud to submit Vertex AI Training Jobs. Simply set the customJobSpec.enableWebAccess API field to true in your job request. We’ll use the Cloud Console to submit a job with the interactive shell enabled.
If you use the Cloud Console:
- In
Training method, selectNo managed datasetandCustom training. - In
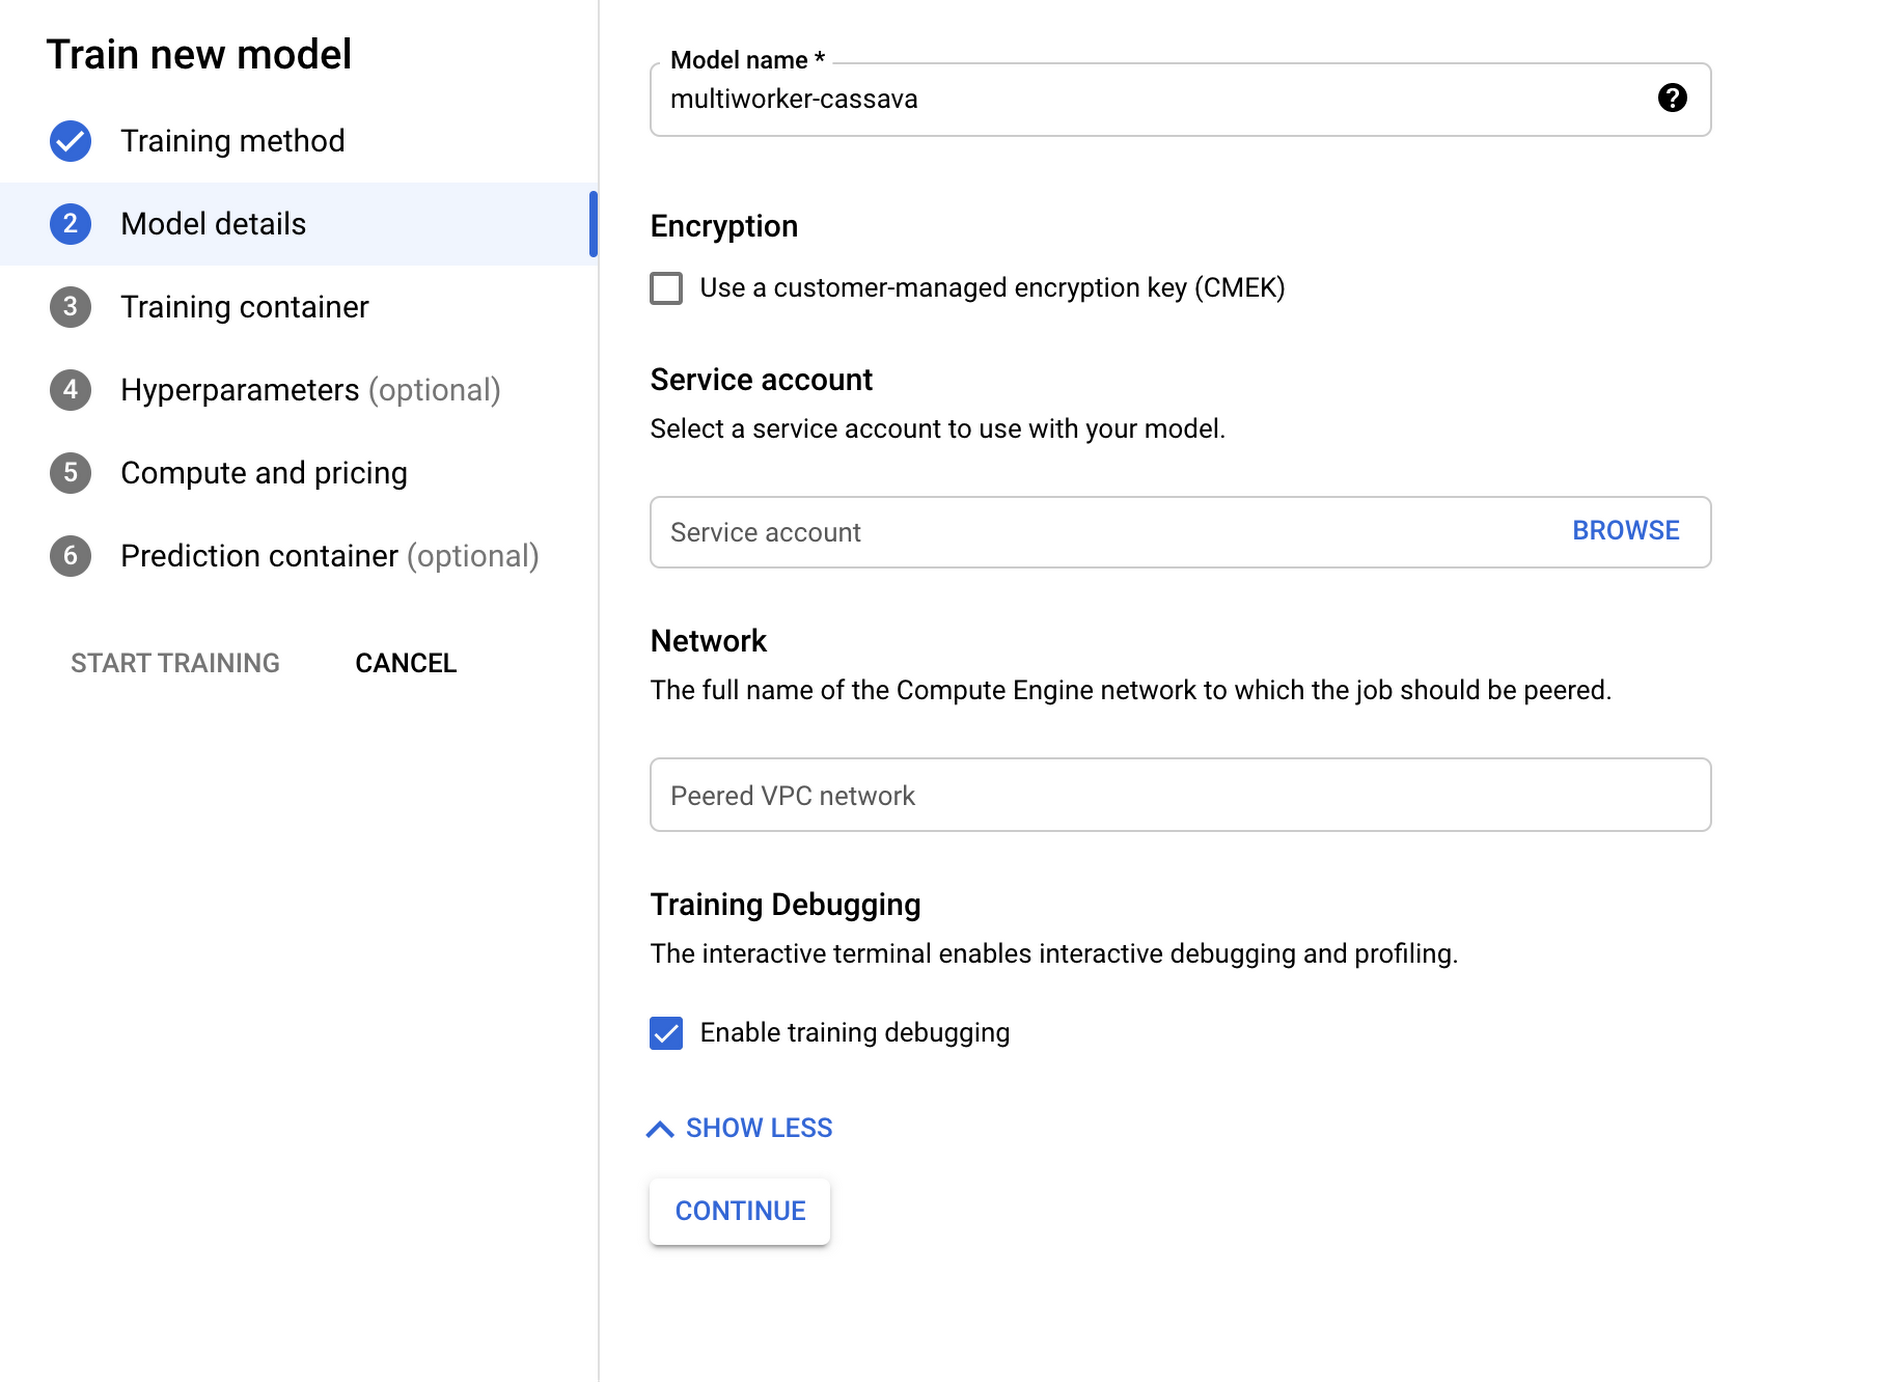
Model details, expand theAdvanced optionsdropdown and selectEnable training debugging. This will enable the interactive shell for your training job.

3. In Training container, select Custom container and select the container that was pushed to GCR in the codelab (gcr.io/$PROJECT_ID/multiworker:cassava).
4. In Compute and pricing, create 2 worker pools. Worker pool 0 has a single chief node with 1 GPU, and worker pool 1 has 2 workers, each with 2 GPUs. This deviates from the config used in the codelab and is what will trigger the deadlock behavior, as the different worker pools have different numbers of GPUs.
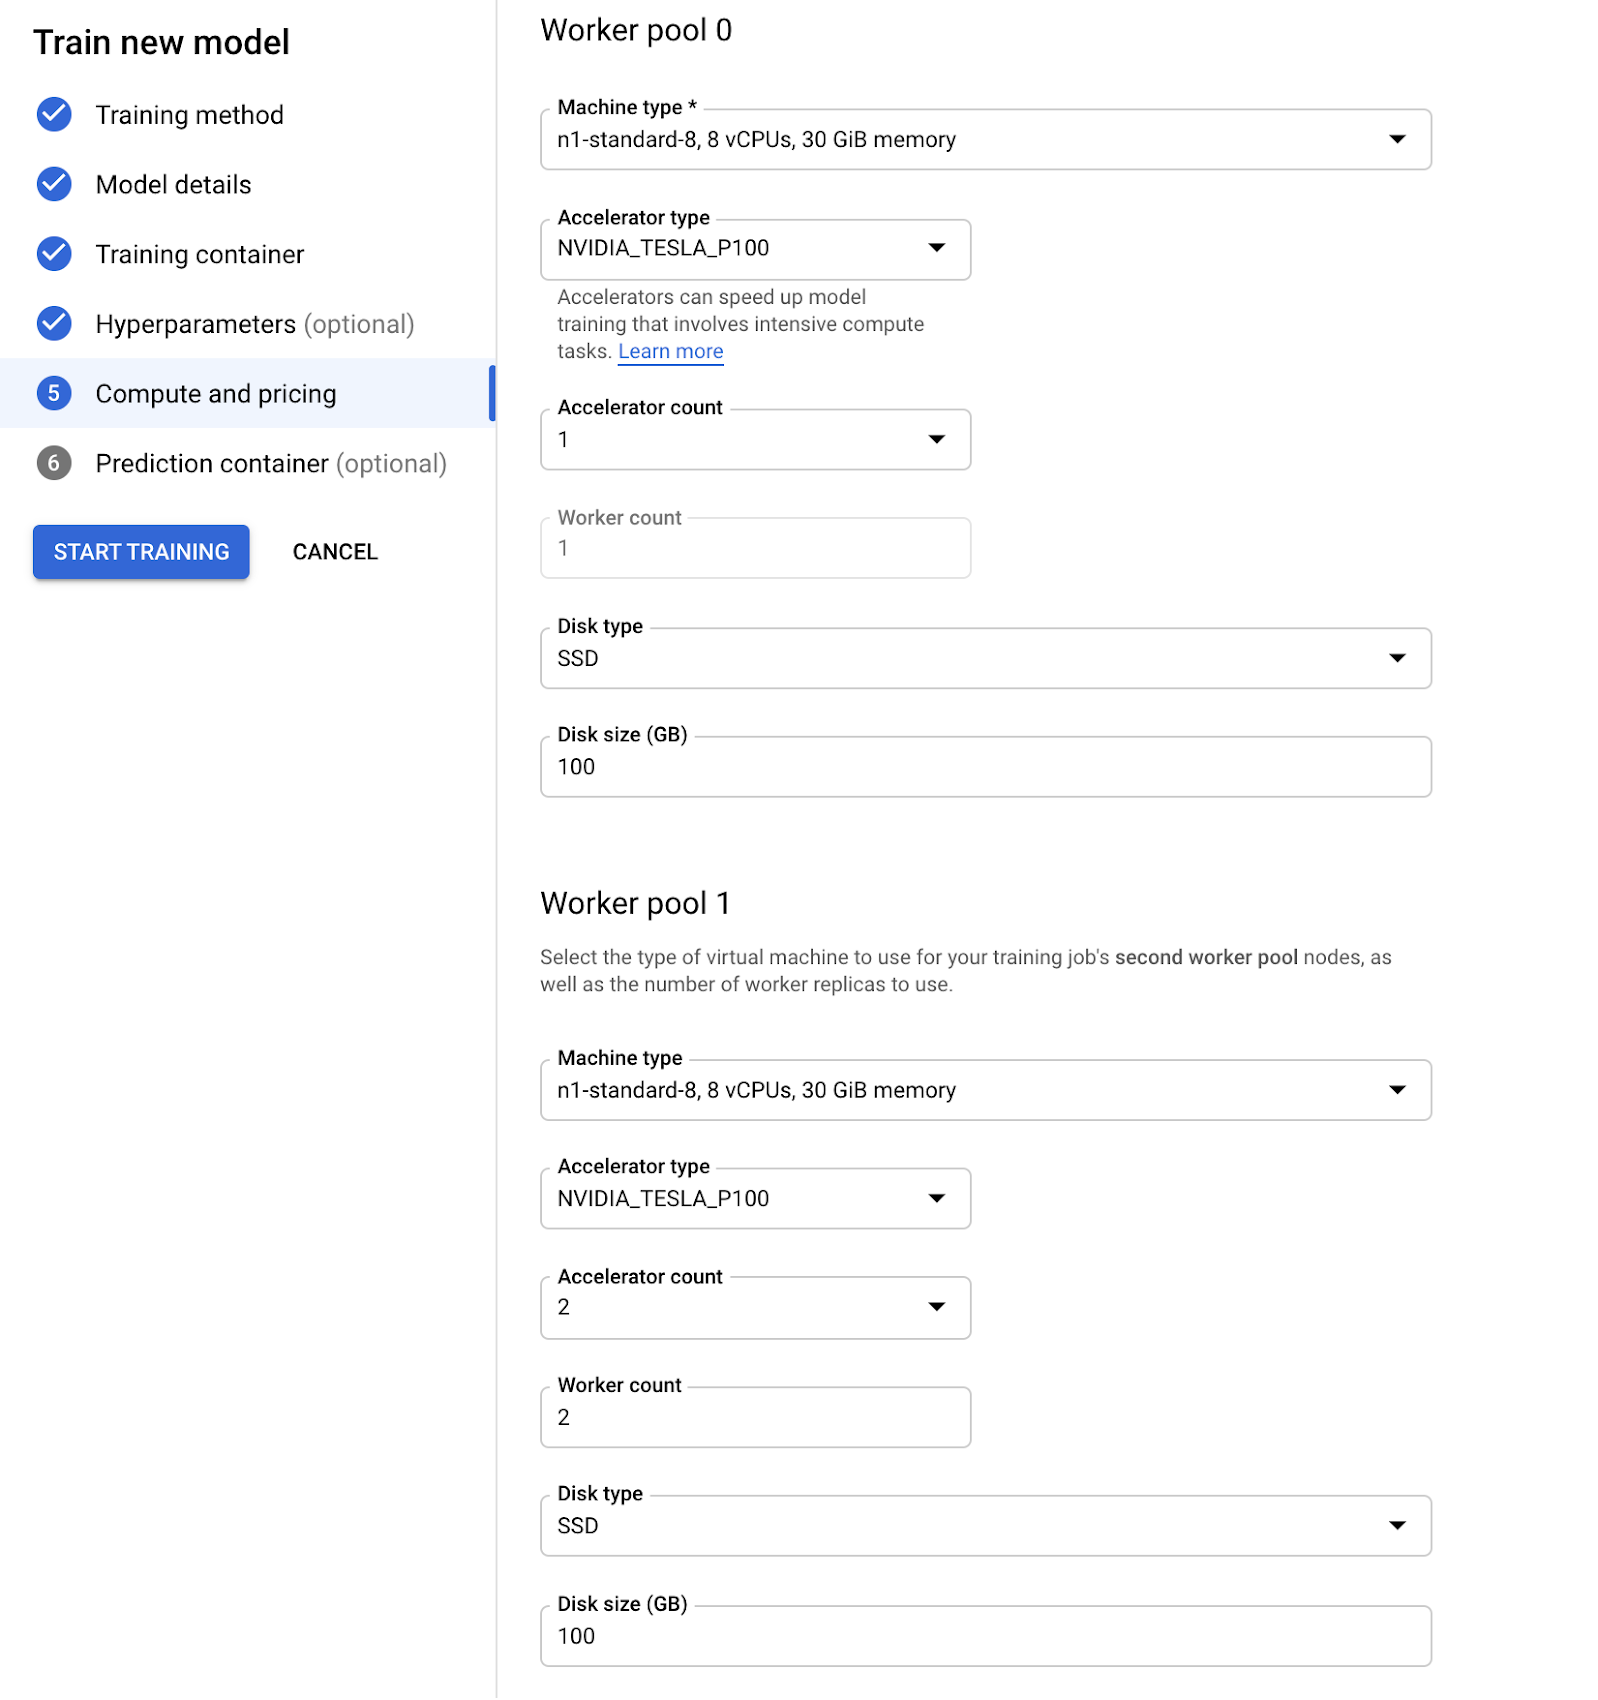

Hit the Start training button and wait for the job to be provisioned. Once the job is running, we can take a look at the logs and metrics and see that it’s deadlocked. The CPU utilization metrics are stuck at 0% and nothing is printed to the logs.


Accessing the interactive shell
The interactive shell is created along with your job, so it’s only available while the job is in the RUNNING state. Once the job is completed or cancelled, the shell won’t be accessible. For our example job, it should take about 5-10 mins for the job to be provisioned and start.
Once the job is running, you’ll see links to the interactive shell on the job details page. One web terminal link will be created for each node in the job:
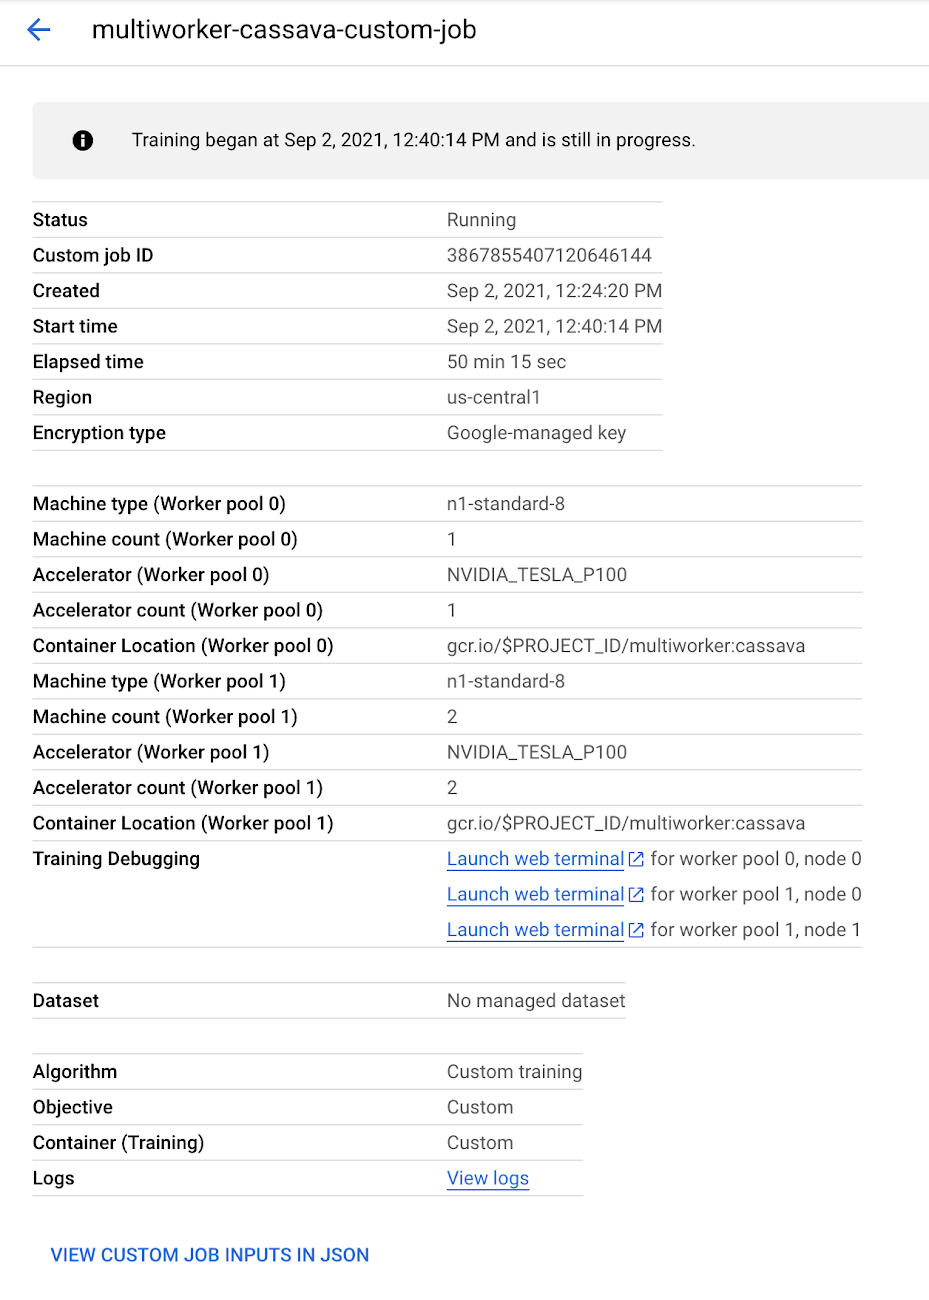

Clicking one of the web terminal links opens a new tab, with a shell session running on the live VM of the training job.

Using py-spy for debugging
py-spy is a sampling profiler for Python programs and is useful for investigating issues in your training application without having to modify your code. It also supports profiling Python programs in separate processes, which is useful since the interactive shell runs as a separate process.
We run pip install py-spy to install py-spy. This can either be done at container build or runtime. Since we didn’t modify our container when we enabled the interactive shell, we’ll install py-spy at runtime to investigate the stuck job.
py-spy has a number of useful commands for debugging and profiling Python processes. Since the job is deadlocked, we’ll use py-spy dump to print out the current call stack of each running Python thread.
Running this command on node workerpool0-0 (the chief node) gives the following result:
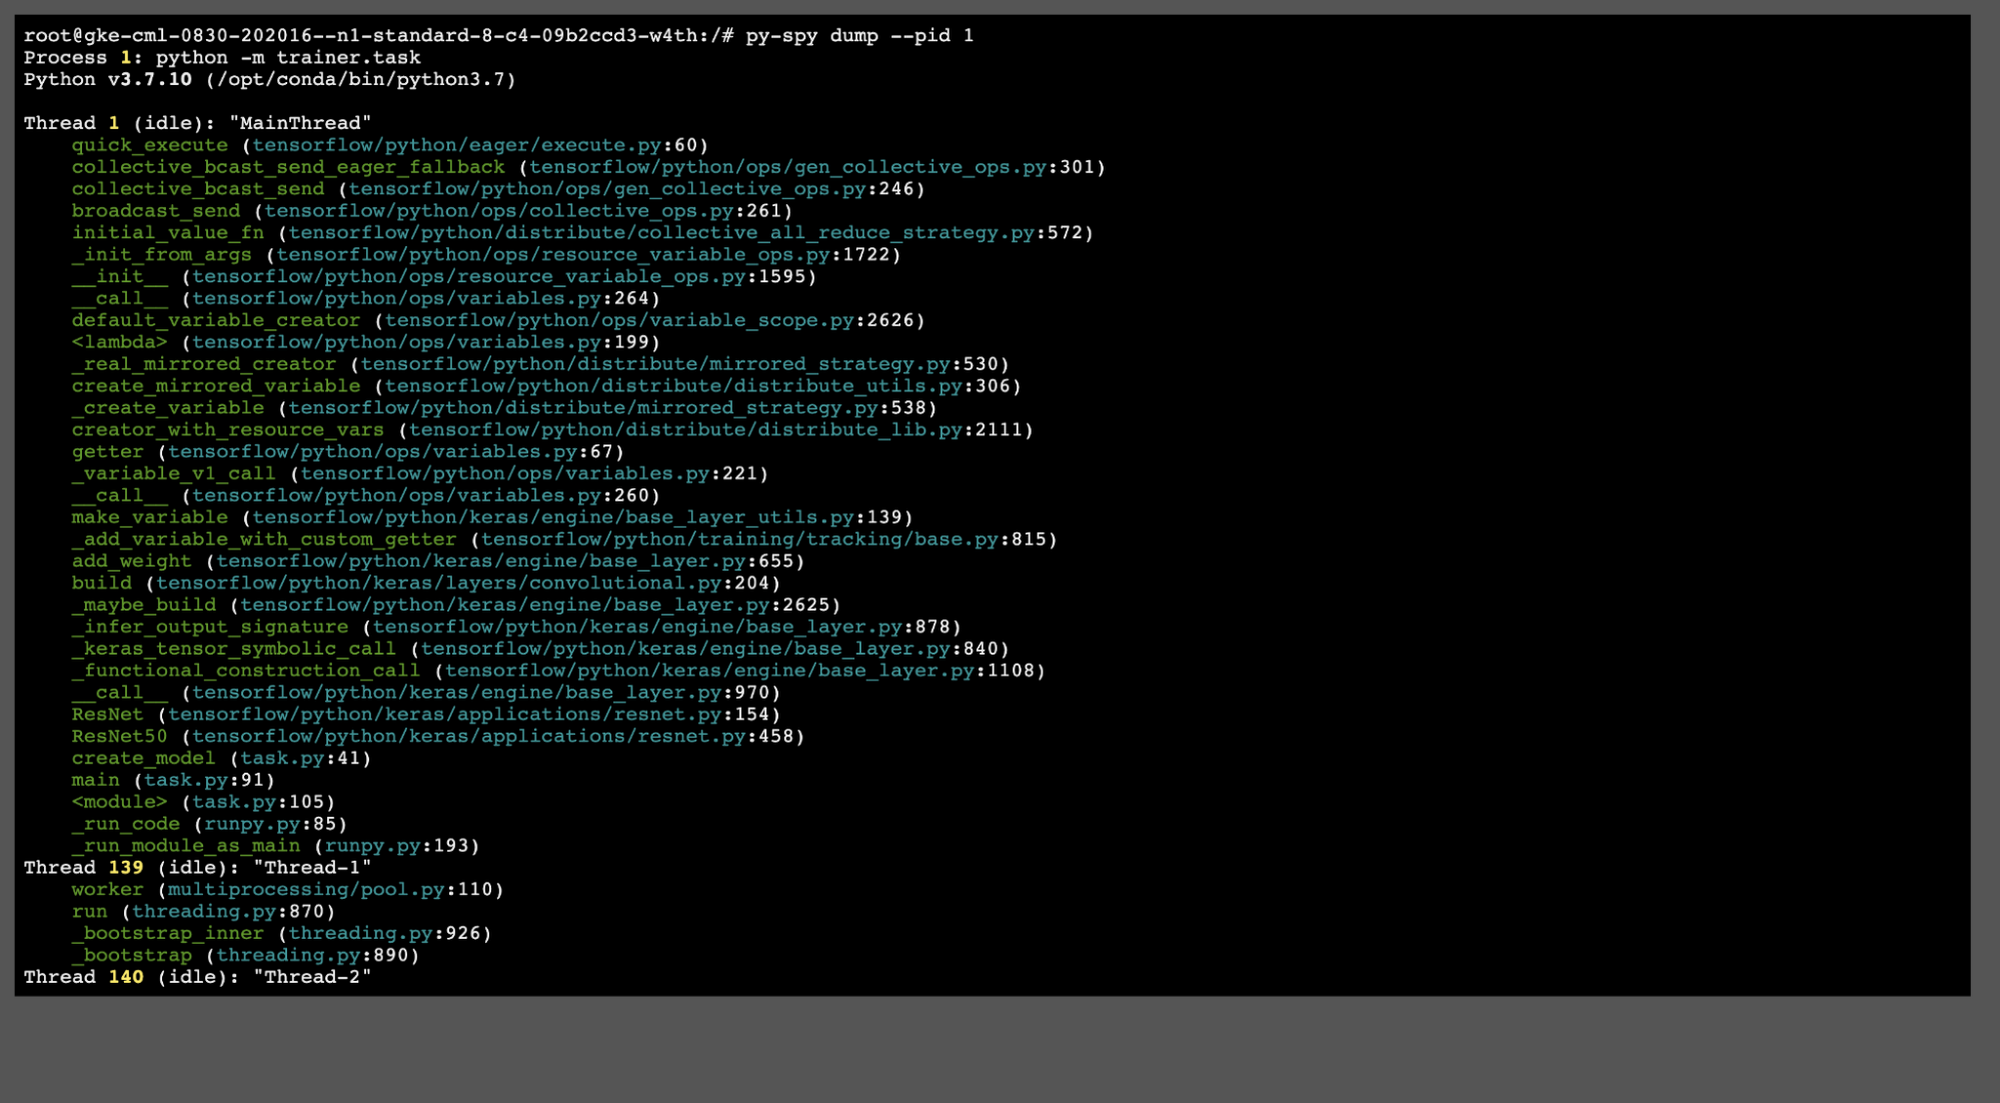

There are a couple of useful entries in the above call stack, which are listed below:
create_mirrored_variable(tensorflow/python/distribute/distribute_utils.py:306)_create_variable(tensorflow/python/distribute/mirrored_strategy.py:538)ResNet50(tensorflow/python/keras/applications/resnet.py:458)create_model(task.py:41)
From these, we can see that the code is stuck at the create_mirrored_variable method in our code’s create model function. This is the point where TensorFlow initializes the MultiWorkerMirroredStrategy and replicates the model’s variables across all the provided devices. As specified in the MultiWorkerMirroredStrategy docs, when there’s a mismatch between the number of GPUs on each machine, the behavior is undefined. In this case, this replication step hangs forever.
py-spy has additional useful commands for debugging training jobs, such as py-spy top and py-spy record. py-spy top provides a live-updating view of your program’s execution. py-spy record periodically samples the Python process and creates a flame graph showing the time spent in each function. The flame graph is written locally on the training node, so you can use gsutil to copy it to Cloud Storage for further analysis.
Cleanup
Even though the job was stuck, we’ll still be charged for the infrastructure used while the job is running, so we should manually cancel it to avoid excess charges. We can use gcloud to cancel the job:
To avoid excess charges in general, you can configure Vertex AI to automatically cancel your job once it reaches a given timeout value. Set the CustomJobSpec.Scheduling.timeout field to the desired value, after which the job will be automatically cancelled.
What’s next
In this post, we showed how to use the Vertex AI interactive shell to debug a live custom training job. We installed the py-spy profiler at runtime and used it to get a live call stack of the running process. This helped us pinpoint the root cause of the issue in the TensorFlow distribution strategy initialization code.
You can also use the interactive shell for additional monitoring and debugging use cases, such as:
Analyzing local or temporary files written to the node’s persistent disk.
Investigating permissions issues: the interactive shell is authenticated using the same service account that Vertex AI uses to run your training code.
Profiling your running training job with
perfornvprof(for GPU jobs).
For more information, check out the following resources:
Documentation on monitoring and debugging training with an interactive shell.
Documentation on containerizing and running training code locally before submitting it to Vertex AI.
Samples using Vertex AI in our Github repository.
