Introducing granular cost insights for GKE, using Cloud Monitoring and Billing data in BigQuery
Joy Wang
Senior Product Manager
Rupa Patel
Senior Product Manager, Cloud FinOps
For FinOps managers and developers using Google Cloud, the quest is clear: fix application issues fast, optimize resource usage, and gain crystal-clear cost visibility. Today, we're thrilled to announce a powerful new tool in your arsenal: Cloud Monitoring metrics in BigQuery (now in Preview). With this exciting capability, you can now combine billing data with resource utilization metrics, empowering you to perform detailed analyses in BigQuery.
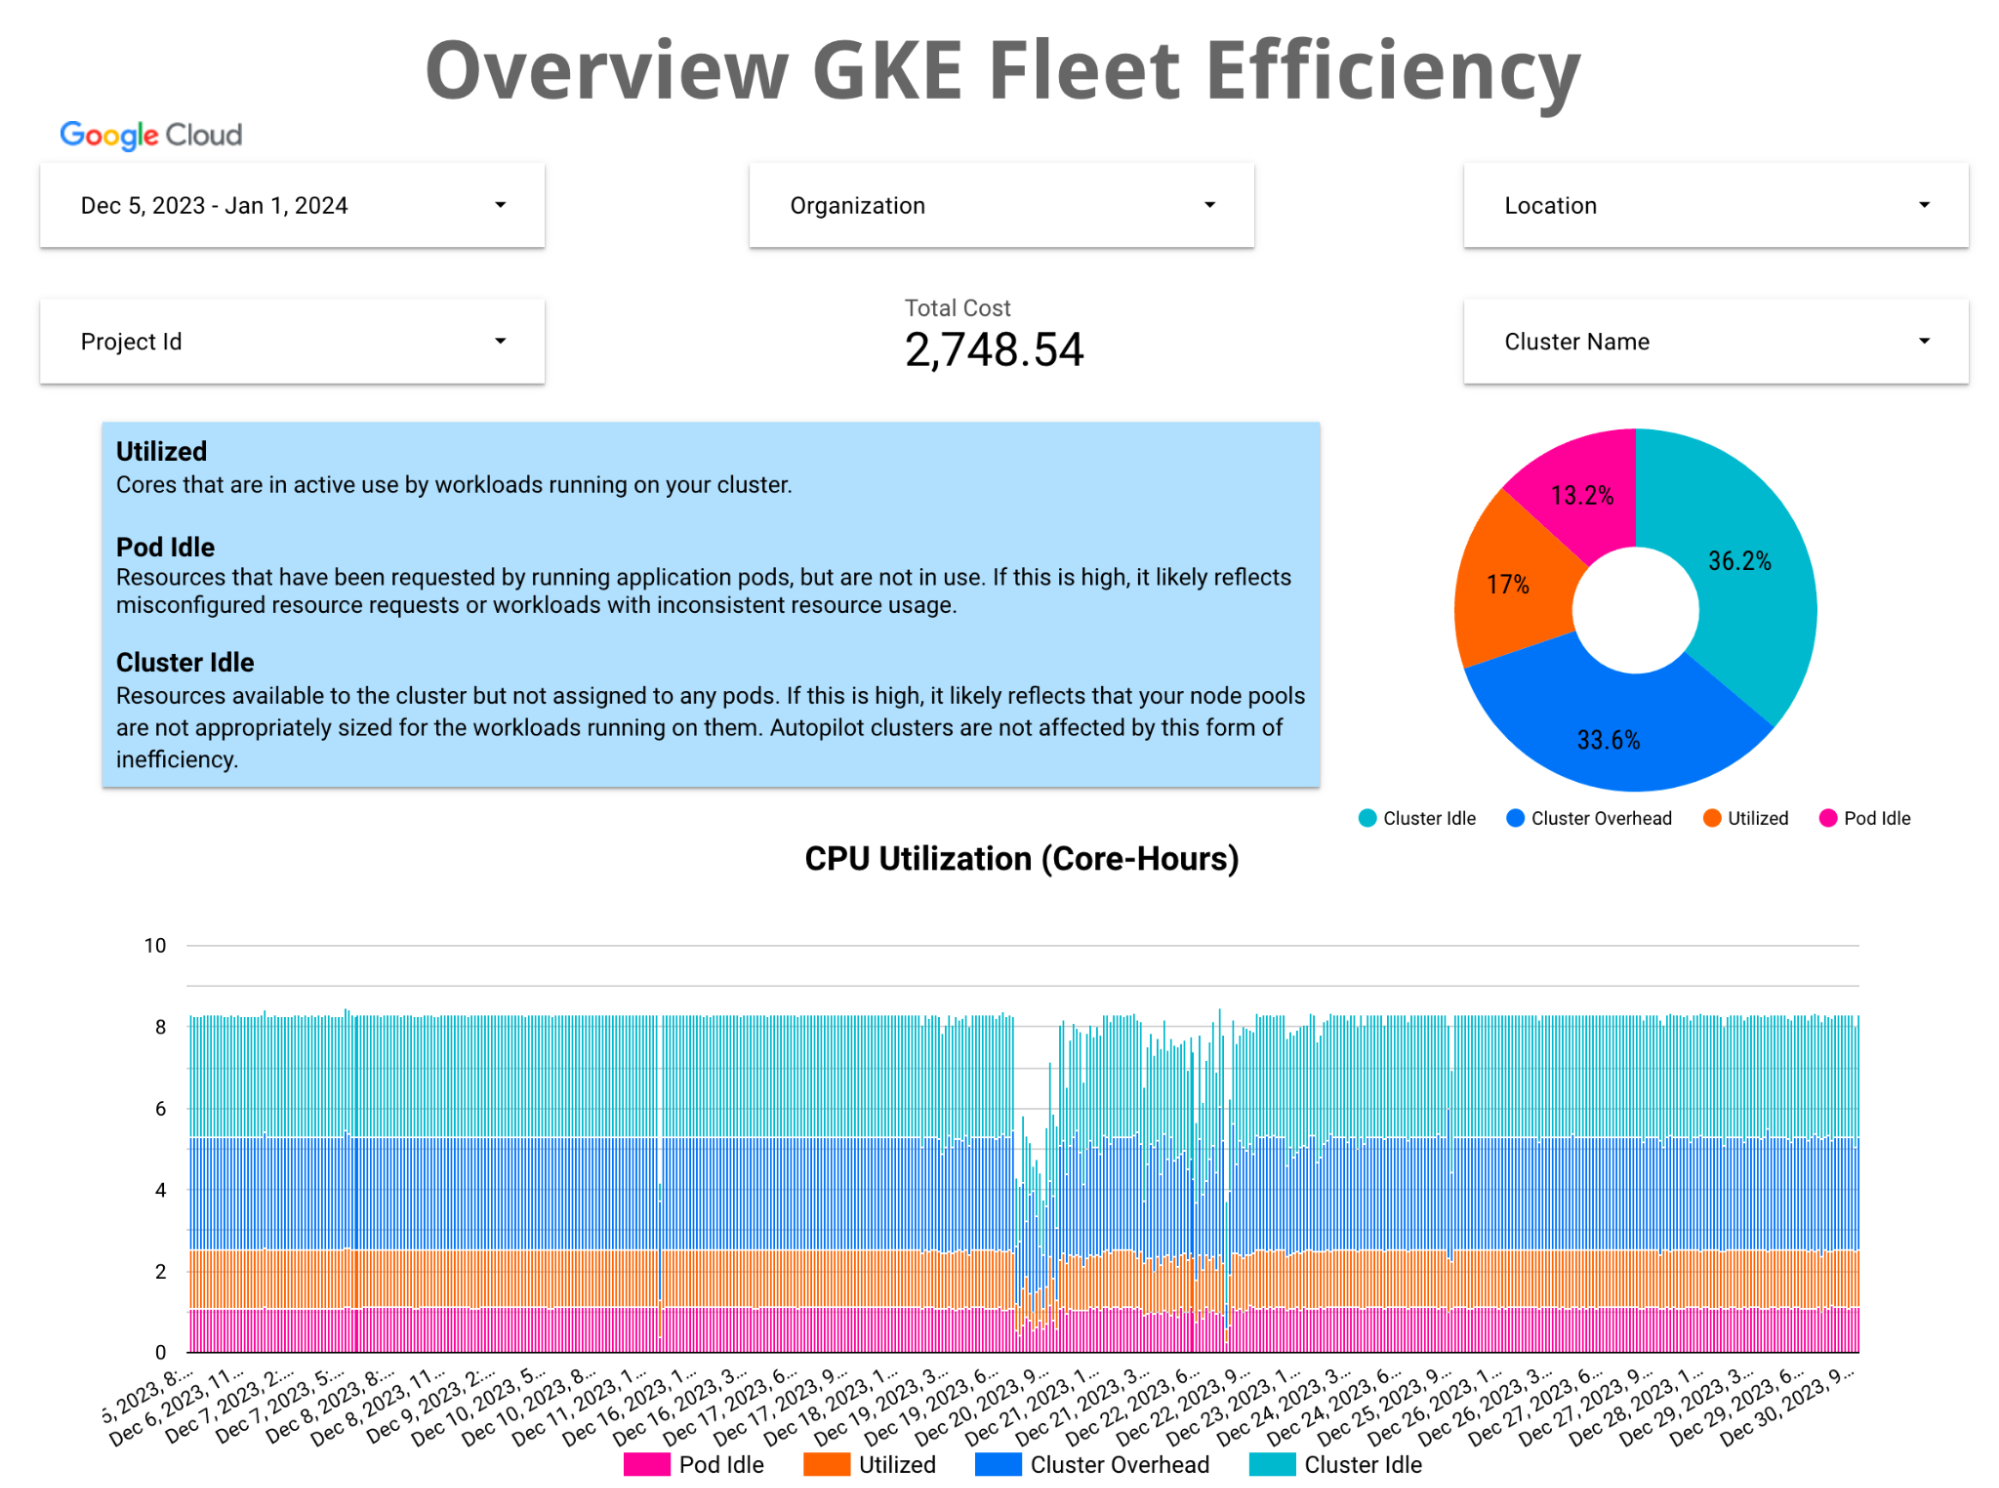
Along with this preview, we are providing an out-of-the-box Looker Studio template that combines Cloud Monitoring and detailed billing metrics for GKE, allowing you to pinpoint the exact cost of specific clusters — no more nebulous guessing about what's driving your bill. For example, you can now see precisely how each workload, pod, or service contributes to your Google Kubernetes Engine (GKE) spend. Sneak a peek of the template below!

Benefits of granular cost insights
With Cloud Monitoring metrics in BigQuery, there are a multitude of benefits for Google Cloud users, including:
- Monitoring resource allocation: Identify underutilized or overutilized resources, like clusters, and relocate them for greater efficiency.
- Cost-driven decision making: Make more informed decisions about workload scaling, resource provisioning, and infrastructure optimization.
- Enhanced cost visibility: Uncover hidden costs and eliminate unnecessary expenses.
- Improved chargeback visibility: Accurately allocate costs to individual teams or projects for fair and transparent chargeback practices.
The path towards better GKE resource utilization
The integration between resource usage metrics and billing data takes cost visibility to a whole new level. By joining billing data with GKE resource usage metrics, you can now attribute specific costs to individual workloads, namespaces, or even pods within their clusters. This granular level of detail empowers you to pinpoint the sources of your cloud expenditures and make data-driven decisions to optimize resource allocation and minimize costs.
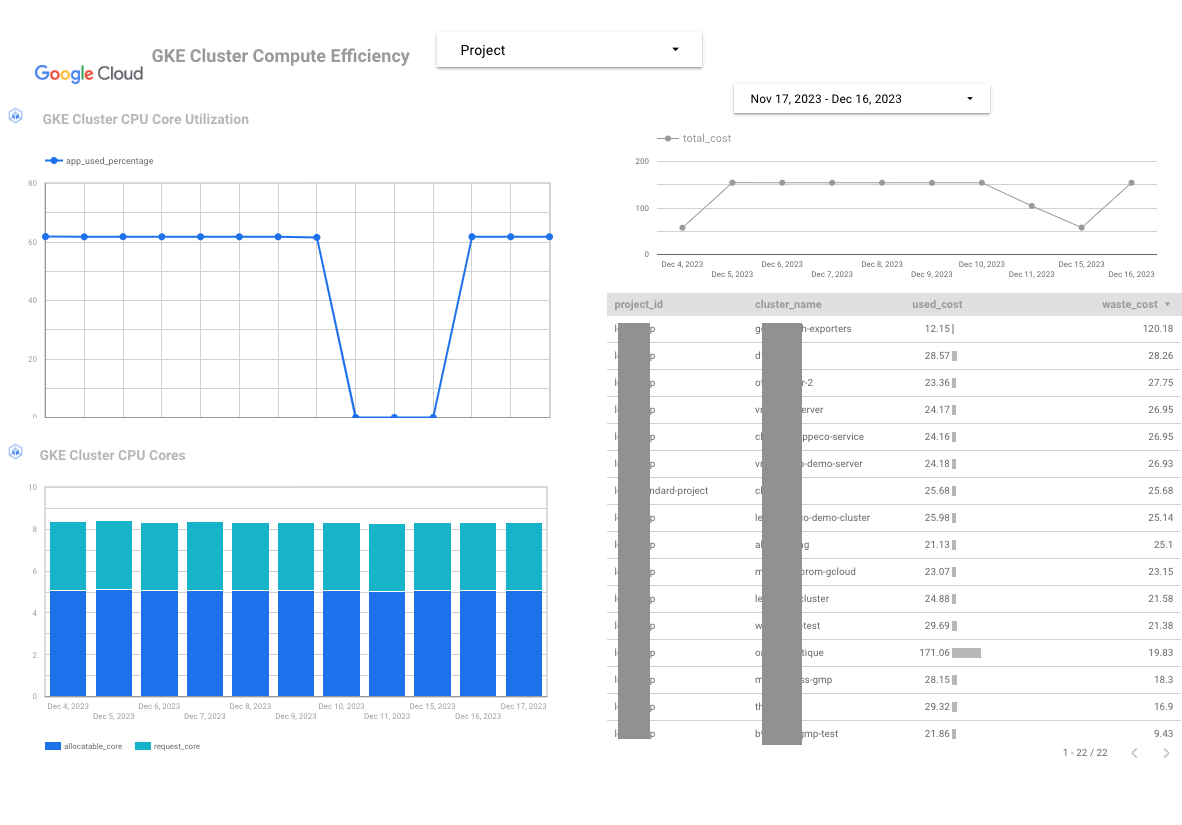
Use our Looker Studio template, which integrates system metrics from Cloud Monitoring and detailed billing data to make resource utilization analysis easy. This Looker Studio template lets you delve into granular cost insights for your GKE deployments at the project, cluster and workload level, enabling informed decisions that drive cost efficiency and resource optimization.
Embark on your cost optimization journey
To start exploring the granular cost insights with resource usage metrics and billing data, follow these steps:
- Enable Cloud Monitoring metrics in Observability Analytics: Sign up for the preview. Once enrolled in the preview, enable Cloud Monitoring metrics in Observability Analytics for your GCP project(s) where GKE clusters are deployed; the metrics will be in BigQuery-backed infrastructure and can be accessed through BQ-linked dataset.
- Configure billing data integration: Link your detailed export to BigQuery with Observability Analytics to join cost data with GKE metrics.
- Analyze and optimize: Utilize the Looker Studio template dashboards and visualizations to gain insights into your GKE costs and identify optimization opportunities.

Get started today
You can sign up for the Preview for Cloud Monitoring metrics in Observability Analytics here. To use the Looker Studio template for the granular GKE cost dashboard, follow the steps listed in this GitHub repository to add your own data to get the template. Get started today!
Query in GitHub Repository and Looker Template are contributed by Solution Architect Xiang Shen.
