Simpler billing, clearer savings: A FinOps guide to updated spend-based CUDs
Alfonso Hernandez
Sr. Product Manager
Rahul Sharma
Sr. Product Manager
Optimizing cloud spend is one of the most rewarding aspects of FinOps — and committed use discounts (CUDs) remain one of the most effective levers to pull.
In July 2025, we began rolling out updates to the spend-based CUD model to make it easier to understand your costs and savings, expand coverage to new SKUs (including Cloud Run and H3/M-series VMs), and offer increased flexibility. These changes are now available to all customers. Let’s dive into how this new model simplifies your FinOps practice.
1. What is the spend-based CUD data change all about?
The most important shift is the move from a credit-based system to a direct discounted price model using consumption models.
Under the old credits model, you committed to an hourly on-demand amount. To find your savings (the actual cost reduction realized), you had to use three different numbers: the full on-demand cost, the commitment fee, and the offsetting credit.
1. The old math:
-
$10.00 (On-demand) + $5.50 (Commitment fee) - $10.00 (Credit) = $5.50 (Net Cost)
-
Savings = $10.00 (On-demand) - $5.50 (Net costs) = $4.50
With the new direct discount model, you don’t need to do that math to calculate your net costs. You commit directly to the net, discounted spend amount. Your usage is simply billed at that discounted rate.
2. The new math:
- $5.50 (Discounted costs)
- Savings = $10.00 (On-demand) - $5.50 (Discounted costs) = $4.50
You can now see your net cost at a glance, and calculating the savings only requires comparing the on-demand price ($10.00) to your new discounted cost ($5.50), which equals $4.50/hr.
2. How do I validate my savings before and after the changes?
The unified CUD Analysis tool is your best resource for auditing the migration or performing deep-dives on your spend. CUD Analysis for the new spend-based CUD model allows you to quickly verify the savings you are getting with the new model, and you can use this tool to compare that the savings didn’t change between the old and the new model.
You can validate your savings by following these steps:
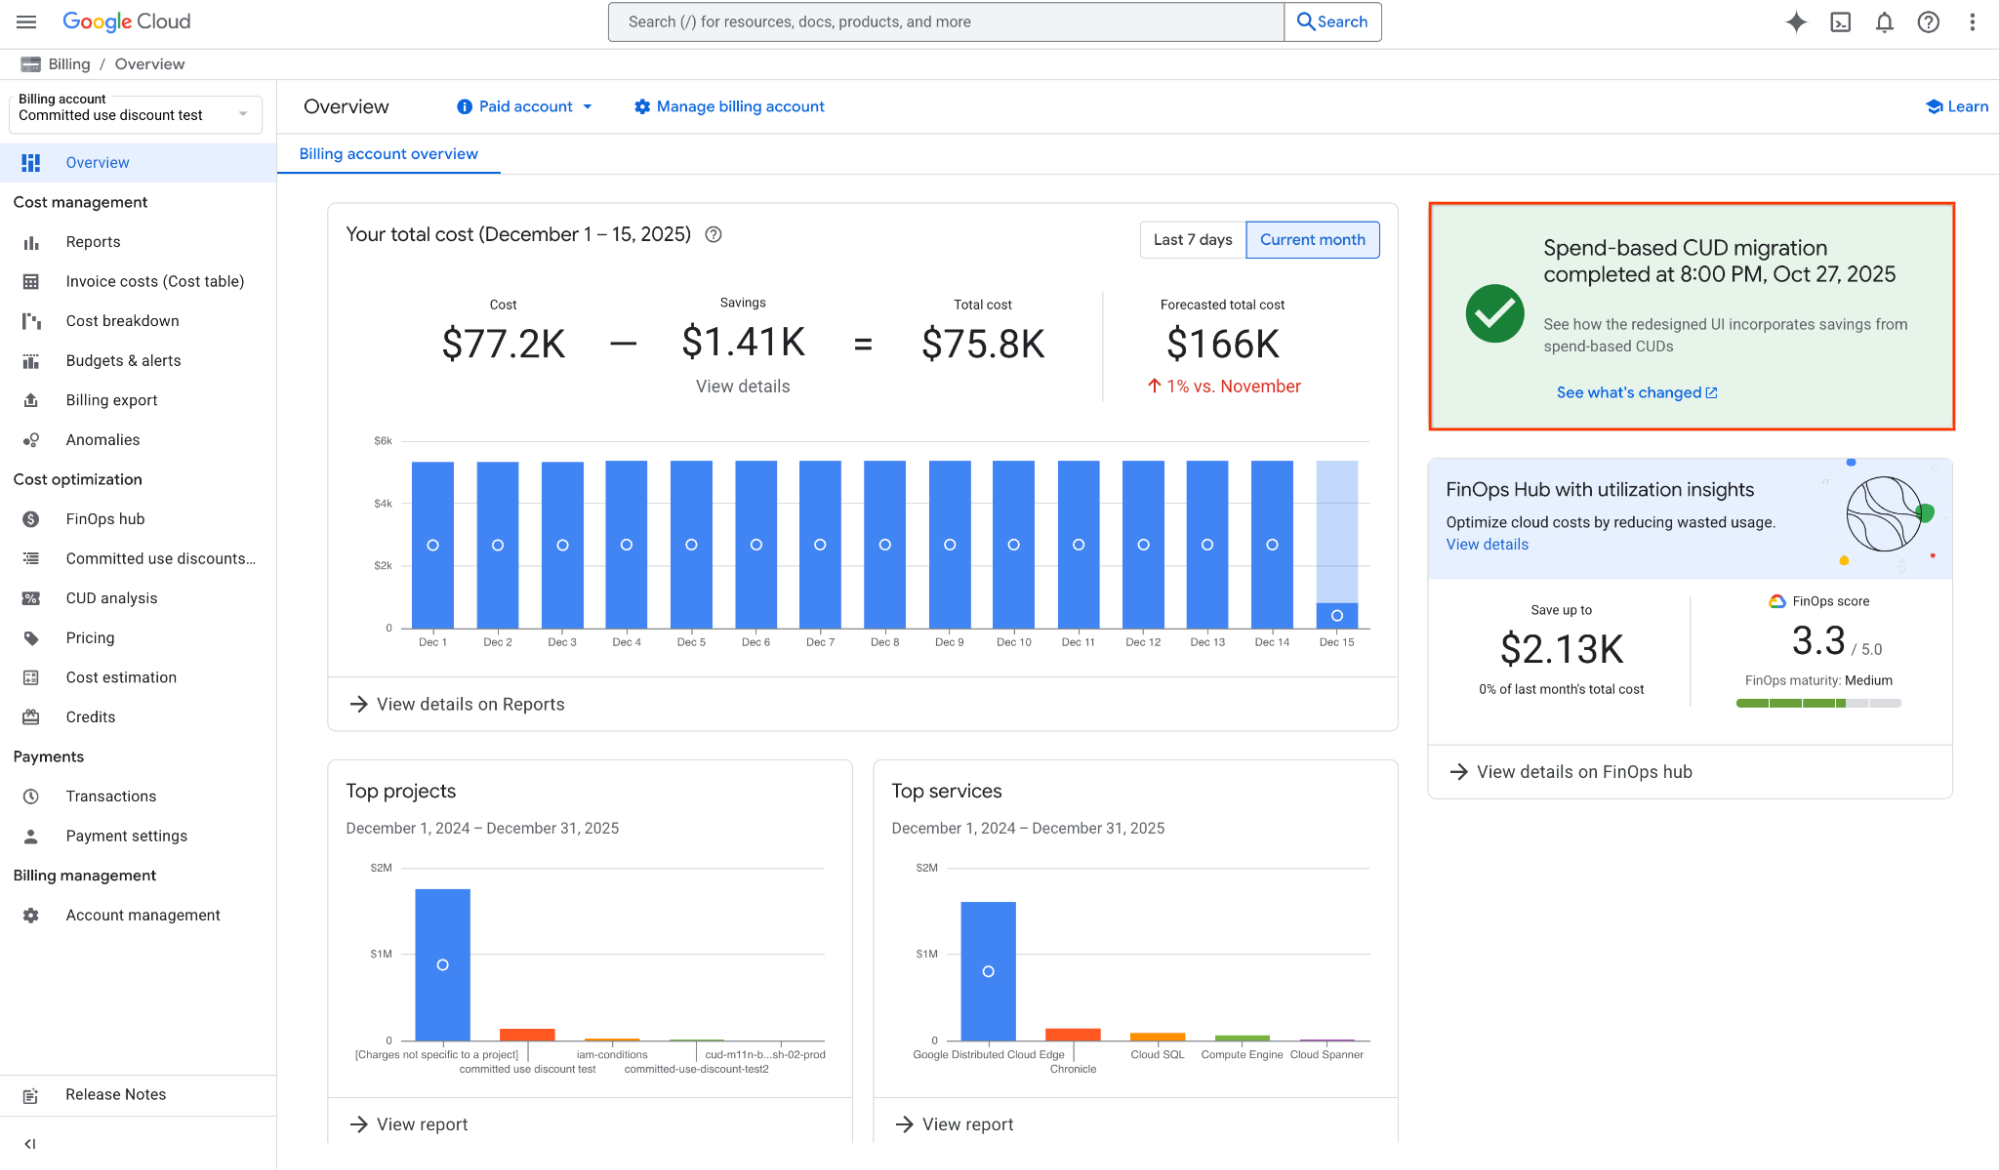
1. Identify the date when the migration took place; you can see the migration date in the billing overview page.
2. Go to CUD Analysis to validate the savings before and after the migration.
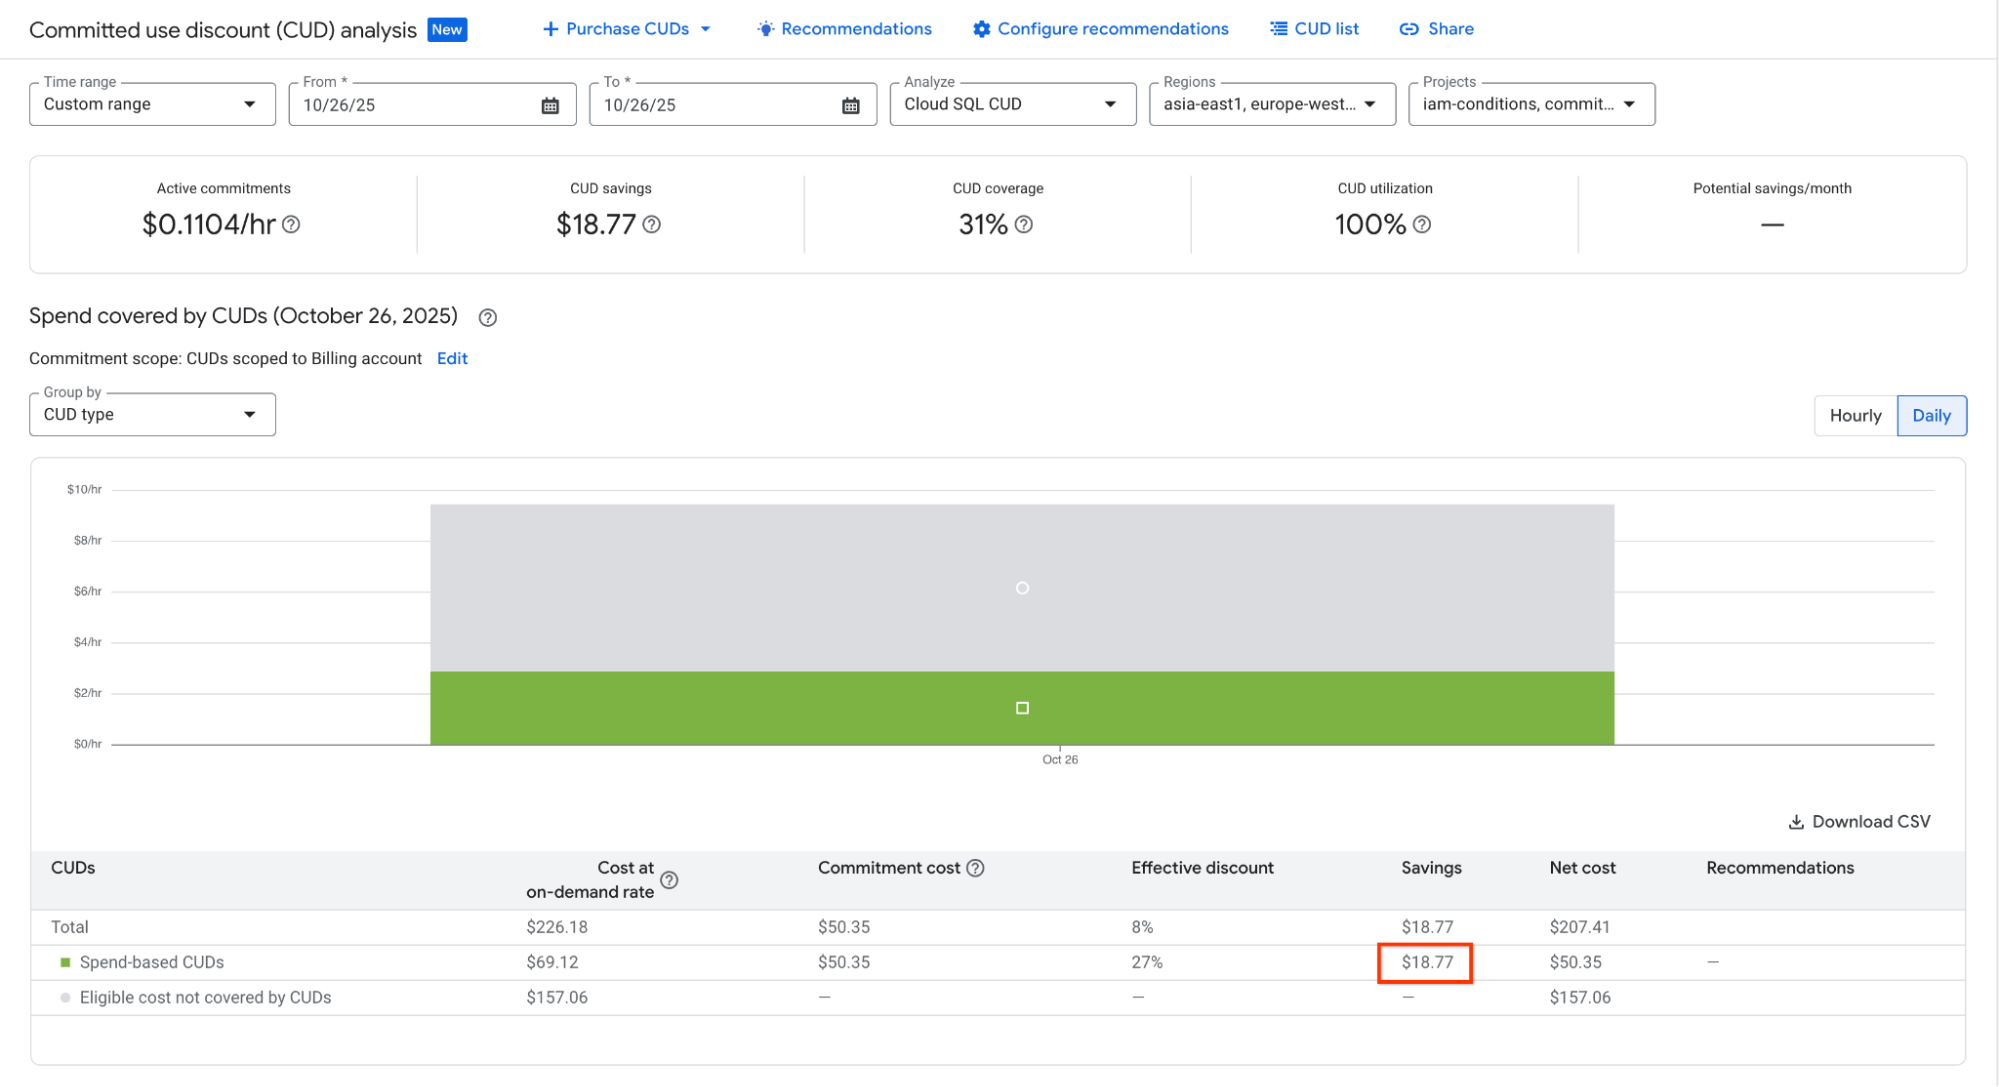
3. To quantify costs from before the migration:
- Filter the view for one day before the migration, in this case Oct. 26, 2025.
- Select a CUD Product, for example Cloud SQL CUD.
- In our example, we paid a $50.35 CUD fee to get a $69.12 credit. When you subtract that fee from the credit, your actual take-home savings were $18.77.
4. To validate costs after the migration
- Change the date to Oct. 28, 2025
- Under the new model, you pay the discounted rates upfront. Your dashboard will reflect a Net Cost of $50.35, compared to the $69.12 on-demand cost, clearly showing your $18.77 in savings.

In addition, this release also includes an update to Cost Reports to include “Savings Programs,” which accurately reflects your actual net savings ($18.77 in our example above), rather than gross credit. When comparing pre- and post-migration data in Cost Reports, ensure you include both usage SKUs and commitment fee SKUs to capture the full scope of the commitment.
3. What other capabilities are in the new CUD Analysis?
Beyond support for the new model, the new CUD Analysis tool offers deeper visibility into your CUD coverage and CUD utilization. You can now analyze your CUDs with hourly data granularity for up to 30 days. This is a major improvement for FinOps teams, as daily averages often hide underutilization spikes that occur during specific hours.
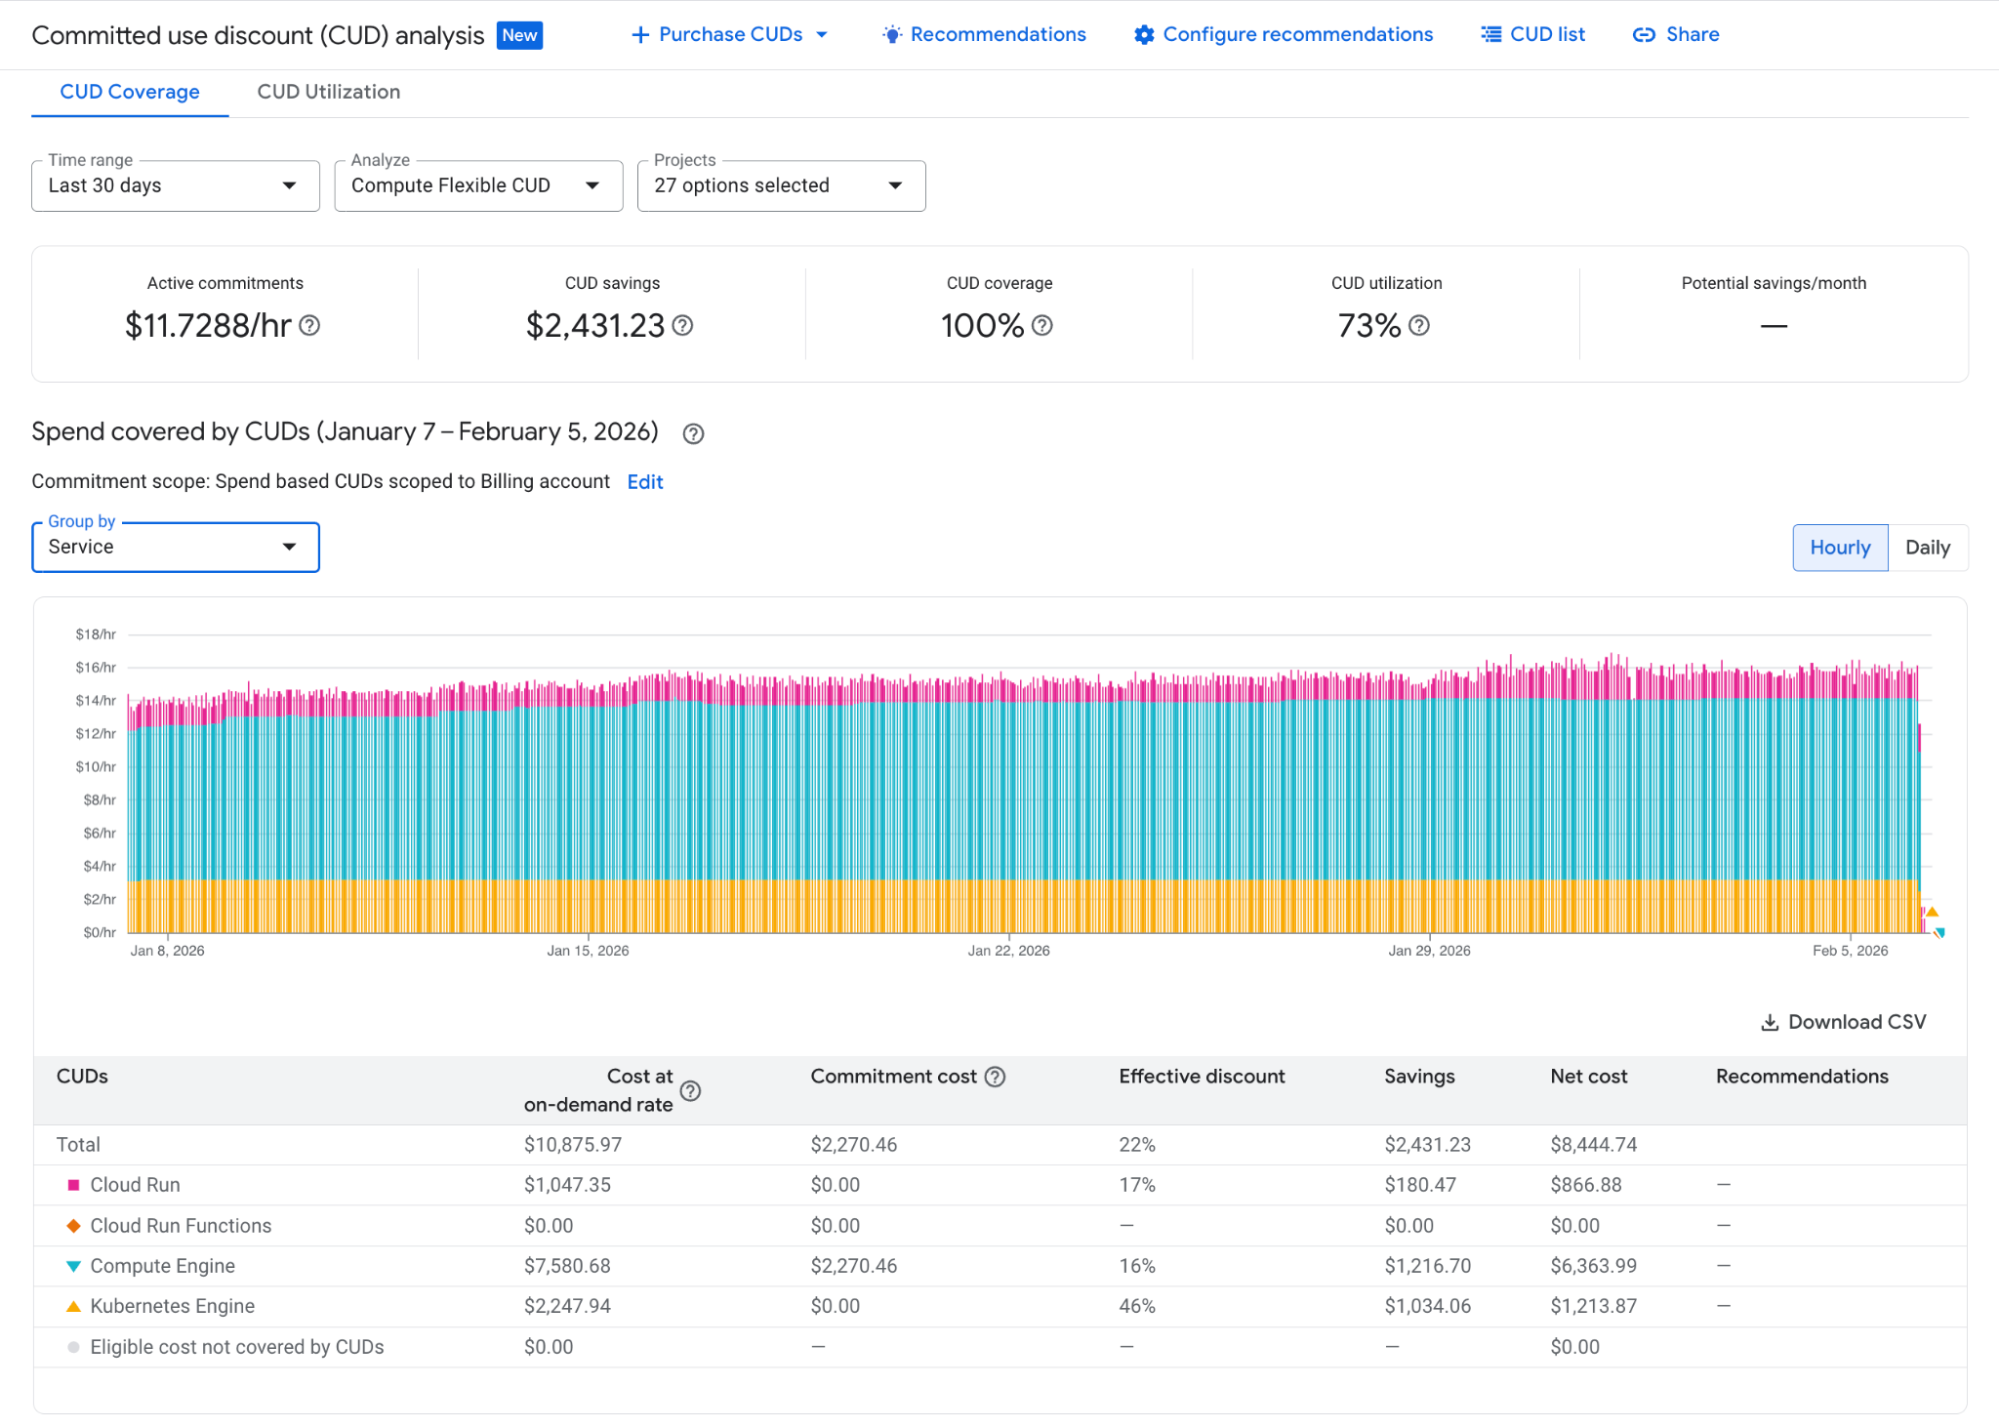
CUD Analysis: Compute Flexible CUD coverage analysis
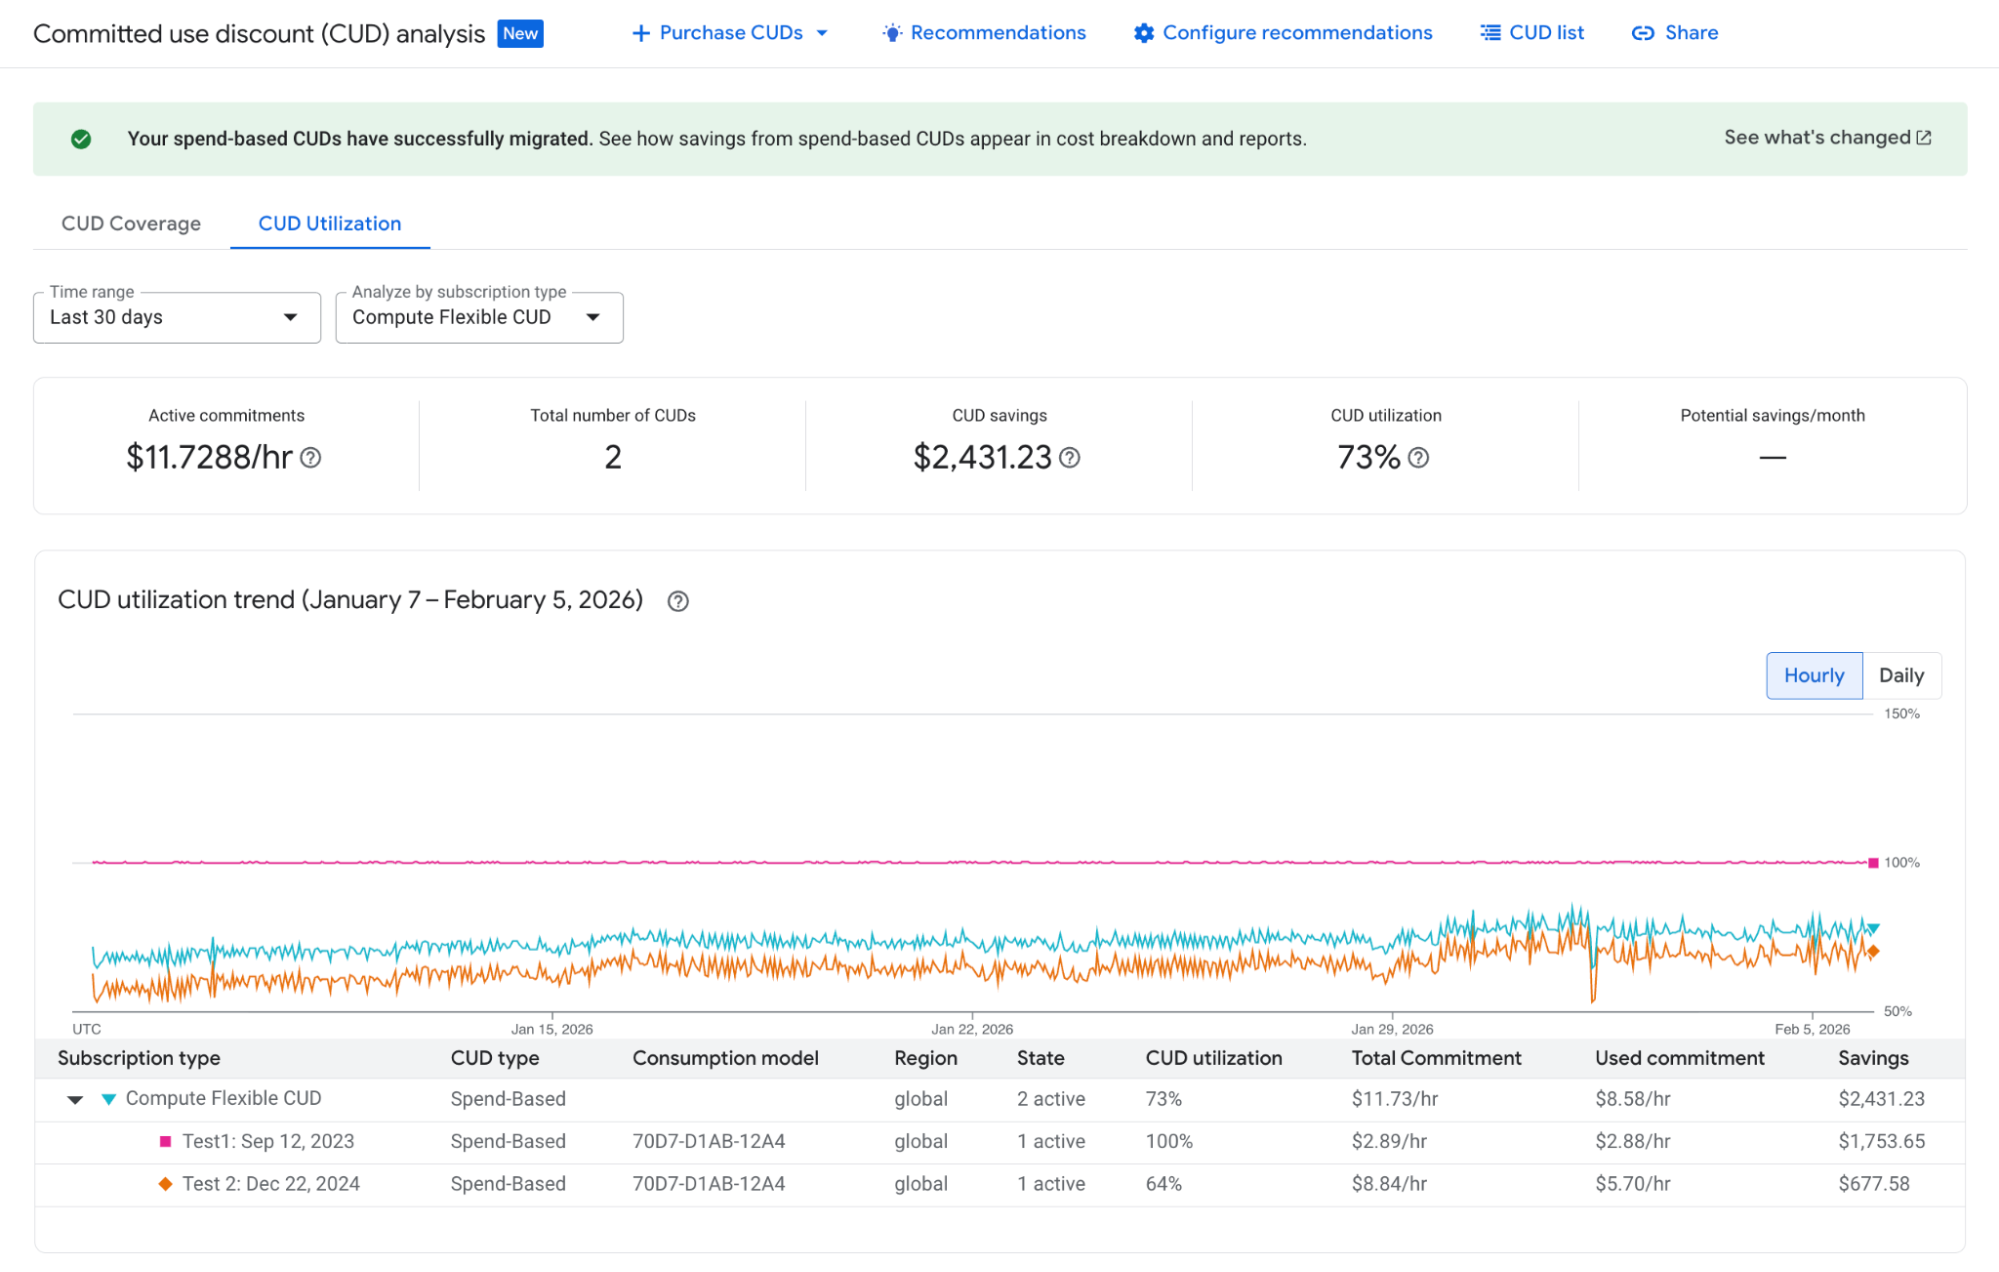
CUD Analysis: Per CUD purchase utilization visibility
If you want to use your own data analysis tools, we offer a new spend-based CUD metadata export that lets you manage your spend-based CUDs programmatically. You can use this export to join with the Billing BigQuery Export datasets to run in-depth, programmatic analysis on all your commitment data. You can also export a CSV from the CUD Analysis view to see the raw data for every resource and its price without needing the full BigQuery export.
4. How much commitment should I buy?
Our CUD recommendations are the primary tool for determining how much of a commitment to purchase. We recently enhanced our Compute Flexible CUD commitment recommendations to provide greater accuracy by including data from GKE, Cloud Run, Cloud Run Functions, and Compute Engine. Additionally, CUD scenario modeling allows you to adjust these suggestions in real-time. You can adjust coverage thresholds, filter out specific dates with irregular usage, or extend the lookback analysis window up to 180 days to identify the exact commitment level that aligns with your specific risk profile.
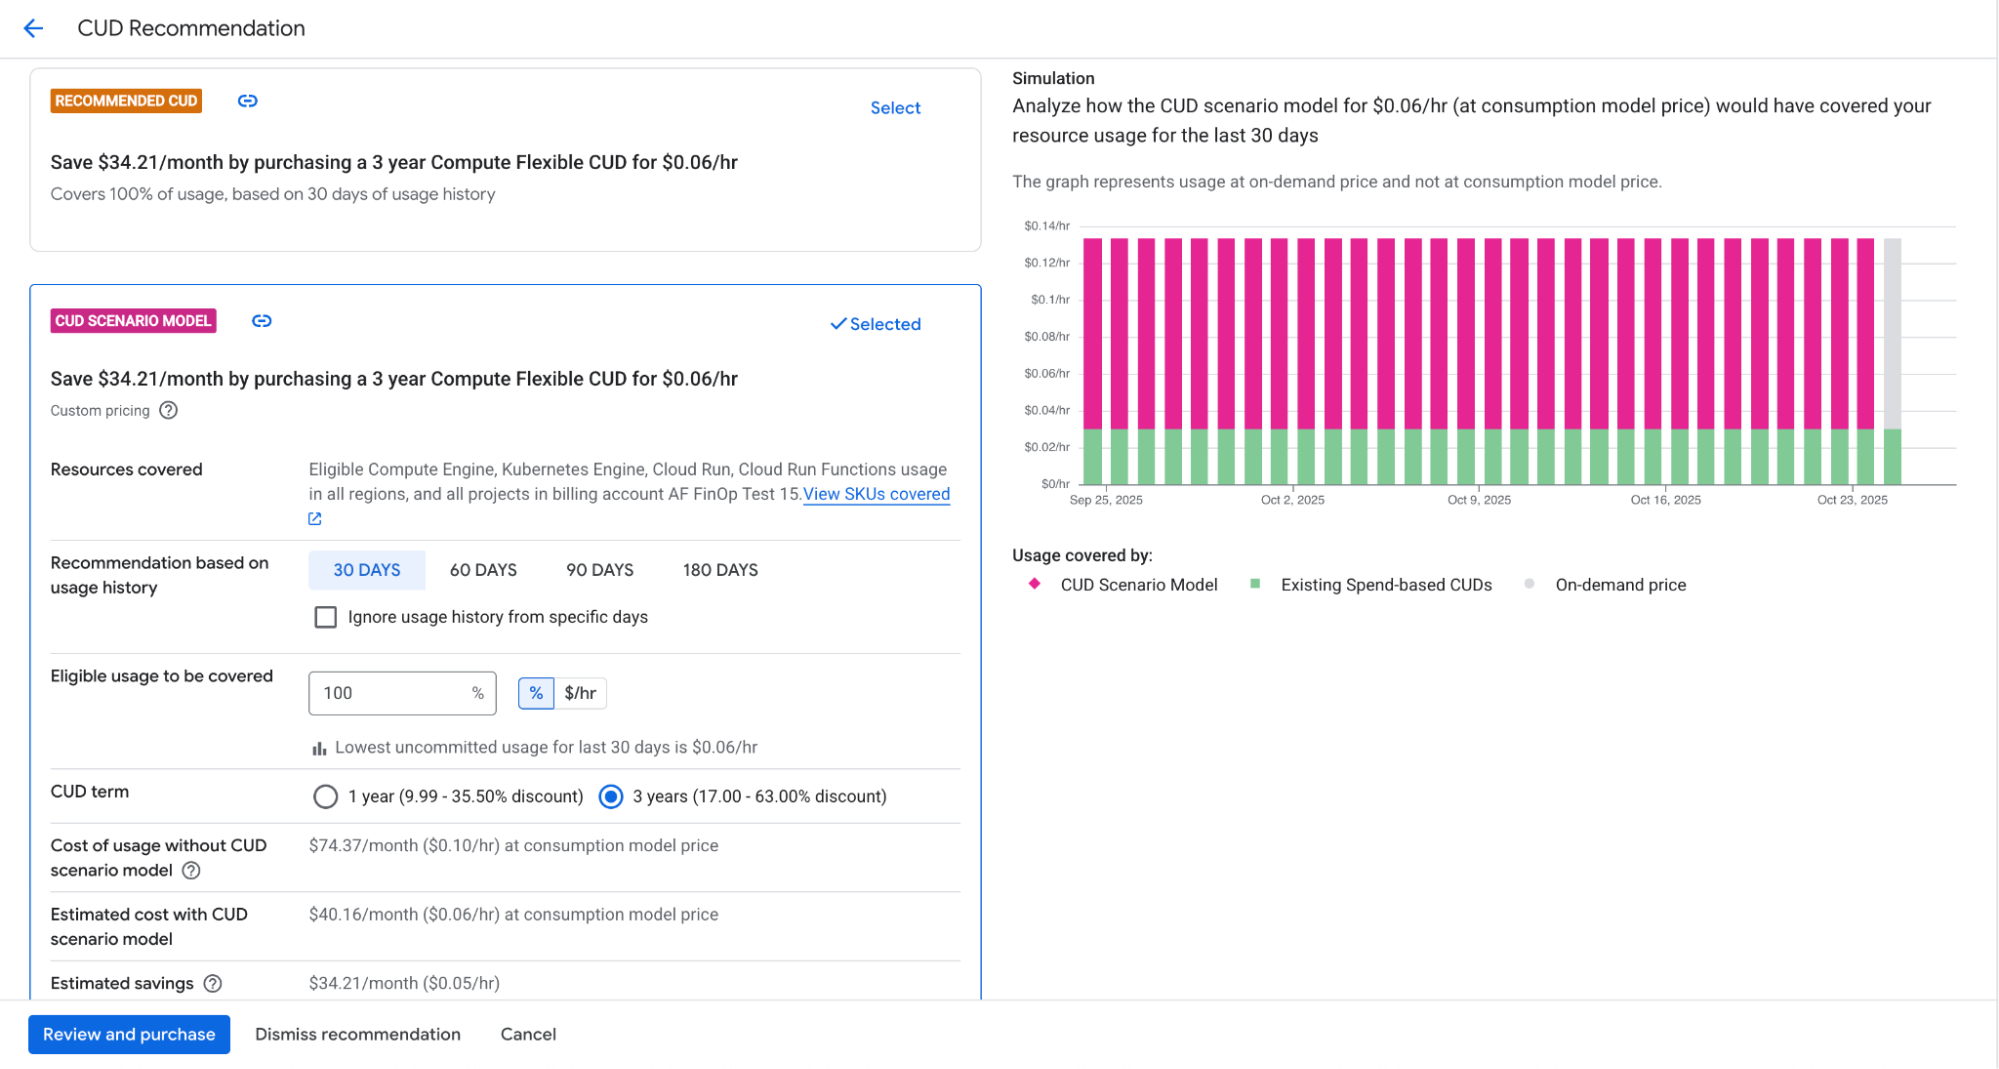
CUD scenario modeling: experiment with multiple options to identify your ideal CUD strategy
5. Is there anything else I should know about Flex CUDs?
With the release of the new spend-based model, we’ve addressed the reporting limitation affecting customers who use a combination of Flex CUDs and GKE/Cloud Run CUDs. Previously, our analysis tools were unable to accurately identify the source of specific credits, leading to discrepancies in KPI metrics like savings, coverage, and utilization. Under the new spend-based CUD model, this limitation has been corrected, so your CUD analysis now provides an accurate, granular view of your savings per Google Cloud service.
To begin navigating the updated spend-based model, visit the Billing console. You can learn more in our documentation: