Zero effort performance insights for popular serverless offerings
Eyamba Ita
Product Manager
Try Google Cloud
Start building on Google Cloud with $300 in free credits and 20+ always free products.
Free trialInevitably, in the lifetime of a service or application, developers, DevOps, and SREs will need to investigate the cause of latency. Usually you will start by determining whether it is the application or the underlying infrastructure causing the latency. You have to look for signals that indicate the performance of those resources when the issue occurred.
Using traces as your latency signals
In most instances, the signals that provide the richest information for latency are traces. Traces represent the total time it takes for a request to propagate through every layer of a distributed system, including the load balancer, computes, databases and more during execution. The subset of traces used to represent each layer of the execution are referred to as spans.
The difficulty of generating traces has prevented many users from accessing this useful troubleshooting resource. To make them more easily available to developers, we've started instrumenting our most popular serverless compute options, App Engine, Cloud Run and Cloud Functions to generate traces by default. While this will not provide the full picture of what is going on in a complex distributed system, it will provide crucial pieces of information needed to decide which area to focus on during troubleshooting.
What do I need to do to get this benefit today?
The simple answer is, nothing! Once your code is deployed in any serverless compute like App Engine, Cloud Run or Cloud Functions, any ingress or egress traffic through the compute automatically generates spans that are captured and stored in Cloud Trace. These spans are stored for 30 days at no additional cost. See additional terms here. The resulting traces can be visualized as waterfall graphs with representative values of latency. In addition, we have extended this capability to Google Cloud databases, with Cloud SQL Insights generating traces representative of query plans for PostgreSQL and sending them to Cloud Trace.
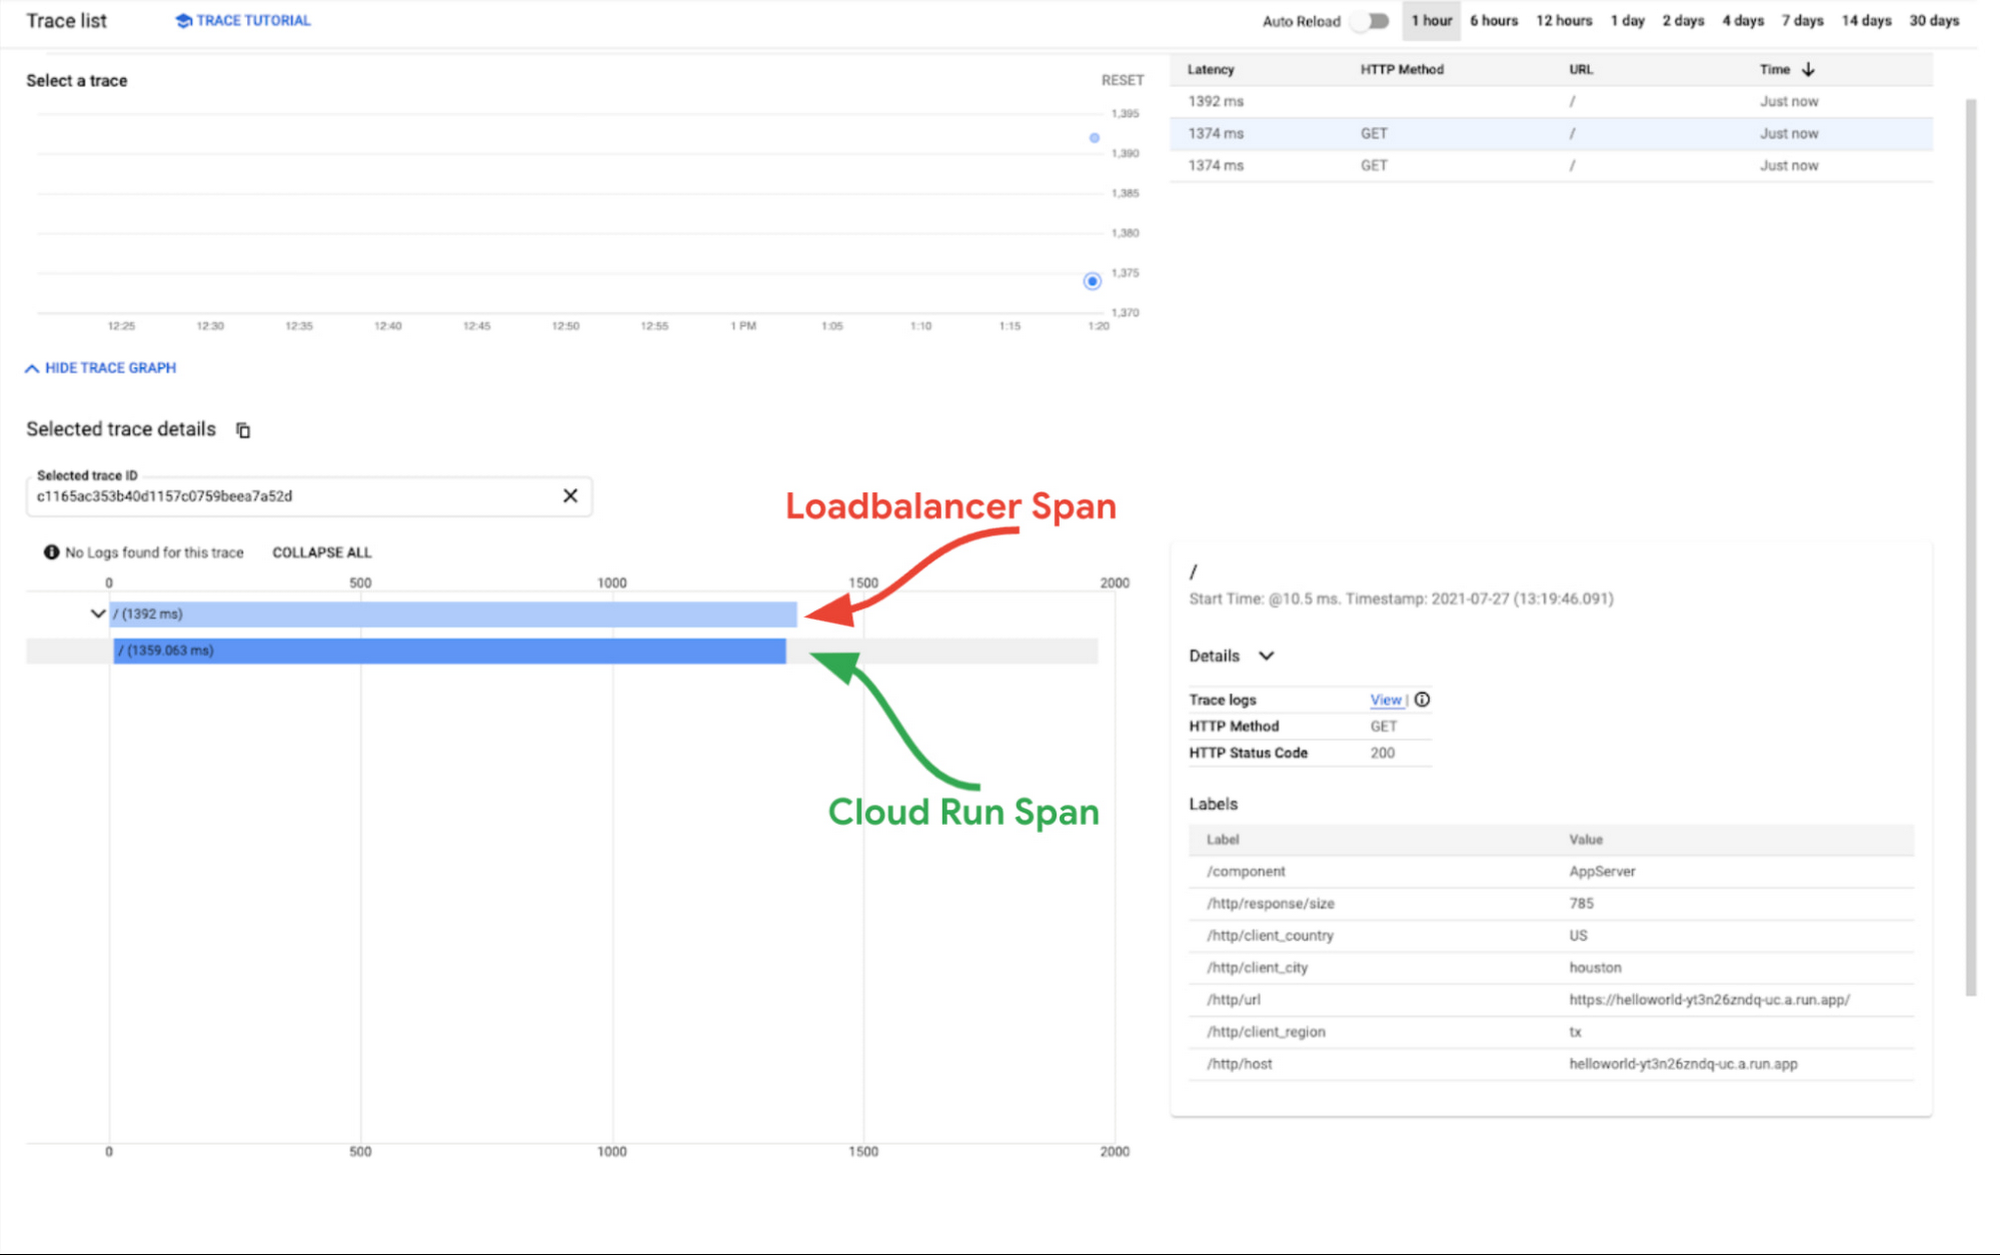
The screenshot below is a Day 1 trace captured from a simple “Helloworld'' application deployed in Cloud Run. The load balancer span (i.e. root span) is indicative of the total time through Google Cloud’s infrastructure and the Cloud Run span is indicative of the time it took for the compute to execute and service the request.
As you can see in the graphic below, the loadbalancer span is roughly equal to the Cloud Run span, so we can conclude that any observed latency is not being caused by Google’s infrastructure. At this point you can focus more on your code.

This is awesome, how do I extend it?
You must still instrument your application if you want it to generate more granular spans representative of the code's execution. You can start here to pick the library that matches your development language and for instructions on how to instrument your code. Once this is done, your traces will get richer, encompassing more spans with information about both the performance of the infrastructure and application in one single waterfall view.
Cloud Trace – Google Cloud’s hub for Infrastructure traces
We are excited about the future of telemetry in Google Cloud. Upcoming releases in the next six months will touch on infrastructure instrumentation and areas like trace analysis, metrics, integrations to other Google Cloud products and integrations with third party APM products.
Next Steps
Explore the traces from your infrastructure in your Cloud Trace console and explore the available libraries and procedures for application instrumentation. If you have questions or feedback about this new feature, head to the Cloud Operations Community page and let us know!
