Dashboards on Cloud Monitoring made easier with samples

Joy Wang
Senior Product Manager
Eliot Wong
Technical Lead
Setting up Cloud Monitoring dashboards for your team can be time consuming because every team's needs are different. Picking the right metrics, using the right visualizations to represent these metrics, deciding what metrics can go on the same chart, and determining the right pre-processing steps for metrics requires background and experience that may not yet exist among your development and operations teams. We’re making it easier for you to set up new dashboards with pre-configured samples that automatically sync with the Cloud Monitoring interface!
Preconfigured dashboard samples available with just one click
Now you and your teams can access dashboards that incorporate operational best practices to use in Cloud Monitoring without any setup.
Last year we introduced the Cloud Monitoring dashboard sample github repository that hosted all of these preconfigured samples. When it was launched, you could use the Dashboards API, gCloud, Terraform, or Deployment Manager to deploy them to your projects, but they weren't available to deploy from the Console UI.
We’re happy to announce that these samples are now available directly from your Cloud Console under the Cloud Monitoring section. You don’t have to programmatically create them anymore - all of the samples are available with just one click!
Simply navigate to the Cloud Monitoring dashboards page and under the Sample Library tab and you’ll discover 64 samples organized into 14 categories. You can preview a sample and get the JSON definition within 2 clicks. Some samples also have preview images so you can get an idea of how it will appear when populated with data.
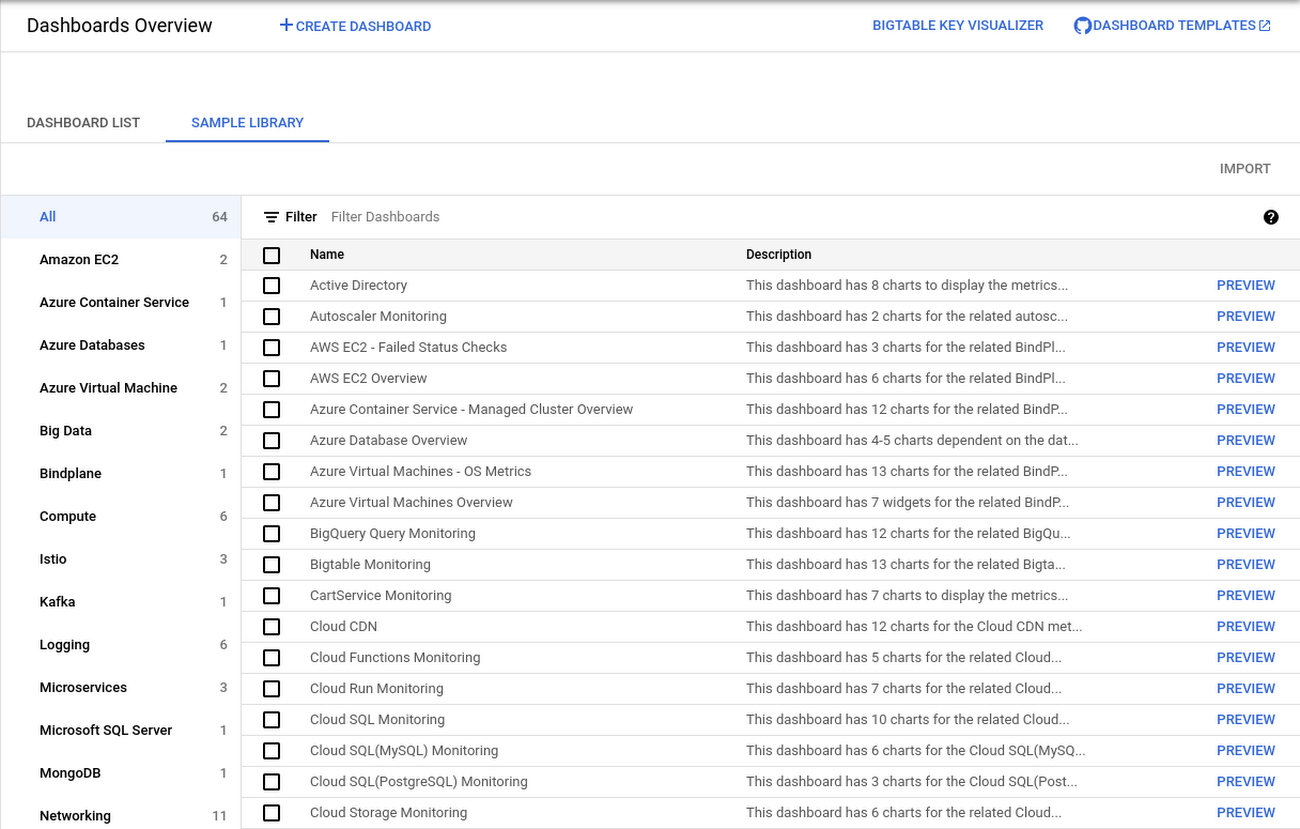

We provide a wide range of samples for different Google Cloud services such as CloudSQL, Spanner, Bigtable, and third-party integrations such as MongoDB and Windows Server. The dashboards have a documentation section that contains useful information such as how to install agents for third-party applications or how to integrate with Bindplane to ingest metrics from other clouds or on-premises workloads.
Sample dashboards do not contain sample datasets. Once they are applied to your project, you will need to have the relevant Google Cloud services up and running or third-party services integrated to see the dashboards created from samples showing the desired visualization.
Incorporate SRE principles into your business
Many of the dashboards were created with Site Reliability Engineering (SRE) best practices in mind. For example, the Data Processing Monitoring sample dashboard provides a view of data processing pipeline metrics, which use SRE principles described in this article.

Examples of dashboards that incorporate SRE principles
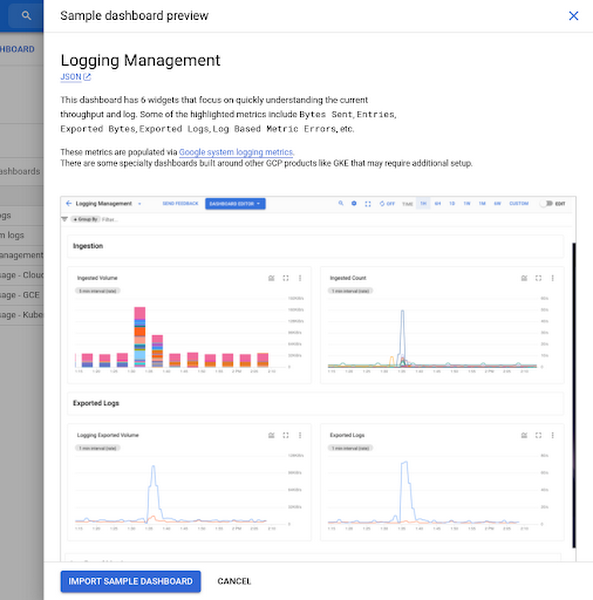
Another SRE example in the preconfigured samples is the Logging Management sample dashboard. This dashboard incorporates metrics used to track SRE golden signals, and the visualization follows SRE guidance.

Contribute a sample dashboard
The number of samples available will continue to increase as we create more and the community contributes to the github repo.
We welcome contributions of new sample dashboards that will be useful to other users. All contributors must sign Google’s Contributor License Agreement and should read the Sample Dashboards Contributor Guidelines.
A contribution should include:
The JSON configuration of the new sample dashboard
One or more screenshots of the dashboard layout
An addition to the README file with a brief description about the sample dashboard
After the contribution has been reviewed and merged into the repository, the new sample dashboard should appear in the Sample Library around a week later.
Get started today
Please navigate to Cloud Monitoring in the Console to try the new samples or visit the dashboard sample github repository and start creating your own dashboards.
We welcome your feedback and questions. Please consider joining the new Cloud Operations group in Google Cloud Communities.
