Troubleshooting best practices for Private Service Connect
Juan Fernández
Technical Solutions Engineer
Private Service Connect is a Cloud Networking offering that creates a private and secure connection from your VPC networks to a service producer, and is designed to help you consume services faster, protect your data, and simplify service management. However, like all complex networking setups, sometimes things don’t work as planned. In this post, you will find useful tips that can help you to tackle issues related to Private Service Connect, even before reaching out to Cloud Support.
Introduction to Private Service Connect
Before we get into the troubleshooting bits, let’s briefly discuss the basics of Private Service Connect. Understanding your setup is key for isolating the problem.
Private Service Connect is similar to private services access, except that the service producer VPC network doesn't connect to your (consumer) network using VPC network peering. A Private Service Connect service producer can be Google, a third-party, or even yourself.
When we talk about consumers and producers, it's important to understand what type of Private Service Connect is configured on the consumer side and what kind of managed service it intends to connect with on the producer side. Consumers are the ones who want the services, while producers are the ones who provide them. The various types of Private Service Connect configurations are:
-
Private Service Connect endpoints are configured as forwarding rules which are allocated with an IP address and it is mapped to a managed service by targeting a Google API bundle or a service attachment. These managed services can be diverse, ranging from global Google APIs to Google Managed Services, third-party services, and even in-house, intra-organization services.
-
When a consumer creates an endpoint that references a Google APIs bundle, the endpoint's IP address is a global internal IP address – the consumer picks an internal IP address that's outside all subnets of the consumer's VPC network and connected networks.
-
When a consumer creates an endpoint that references a service attachment, the endpoint's IP address is a regional internal IP address in the consumer's VPC network – from a subnet in the same region as the service attachment.
-
Private Service Connect backends are configured with a special Network Endpoint Group of the type Private Service Connect which refers to a locational Google API, or to a published service service attachment. A service attachment is your link to a compatible producer load balancer.
-
And Private Service Connect interfaces, a special type of network interface that allows service producers to initiate connections to service consumers.
How Private Service Connect works
Network Address Translation (NAT) is the underlying network technology that powers up Private Service Connect using Google Cloud’s software-defined networking stack called Andromeda.
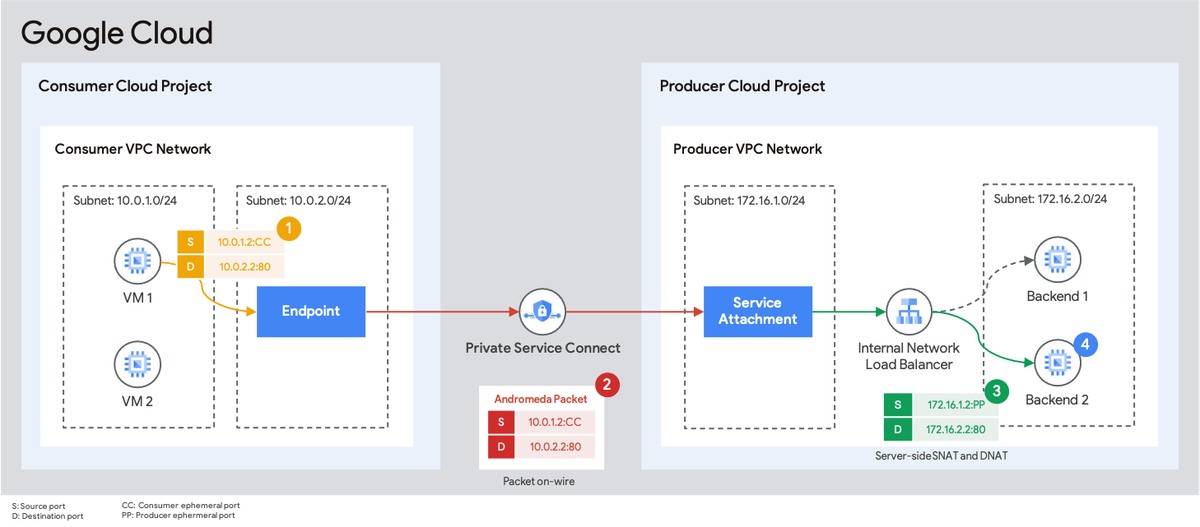
Let's break down how Private Service Connect works to access a published service based on an internal network-passthrough load balancer using a connect endpoint. In this scenario, you set up a Private Service Connect endpoint on the consumer side by configuring a forwarding rule that targets a service attachment. This endpoint has an IP address within your VPC network.
- When a VM instance in the VPC network sends traffic to this endpoint, the host’s networking stack will apply client-side load balancing to send the traffic to a destination host based on the location, load and health.
- The packets are encapsulated and routed through Google Cloud’s network fabric.
- At the destination host, the packet processor will apply Source Network Address Translation (SNAT) and Destination Network Address Translation (DNAT) using the NAT subnet configured and the producer IP address of the service, respectively.
- The packet is delivered to the VM instance serving as the load balancer’s backend.
All of this is orchestrated by Andromeda’s control plane; with a few exceptions, there are no middle box or intermediaries involved in this process, enabling you to achieve line rate performance. For additional details, see Private Service Connect architecture and performance.
With this background, you should be already able to identify the main components where issues could occur: the source host, the network fabric, the destination host, and the control-plane.
Know your troubleshooting tools
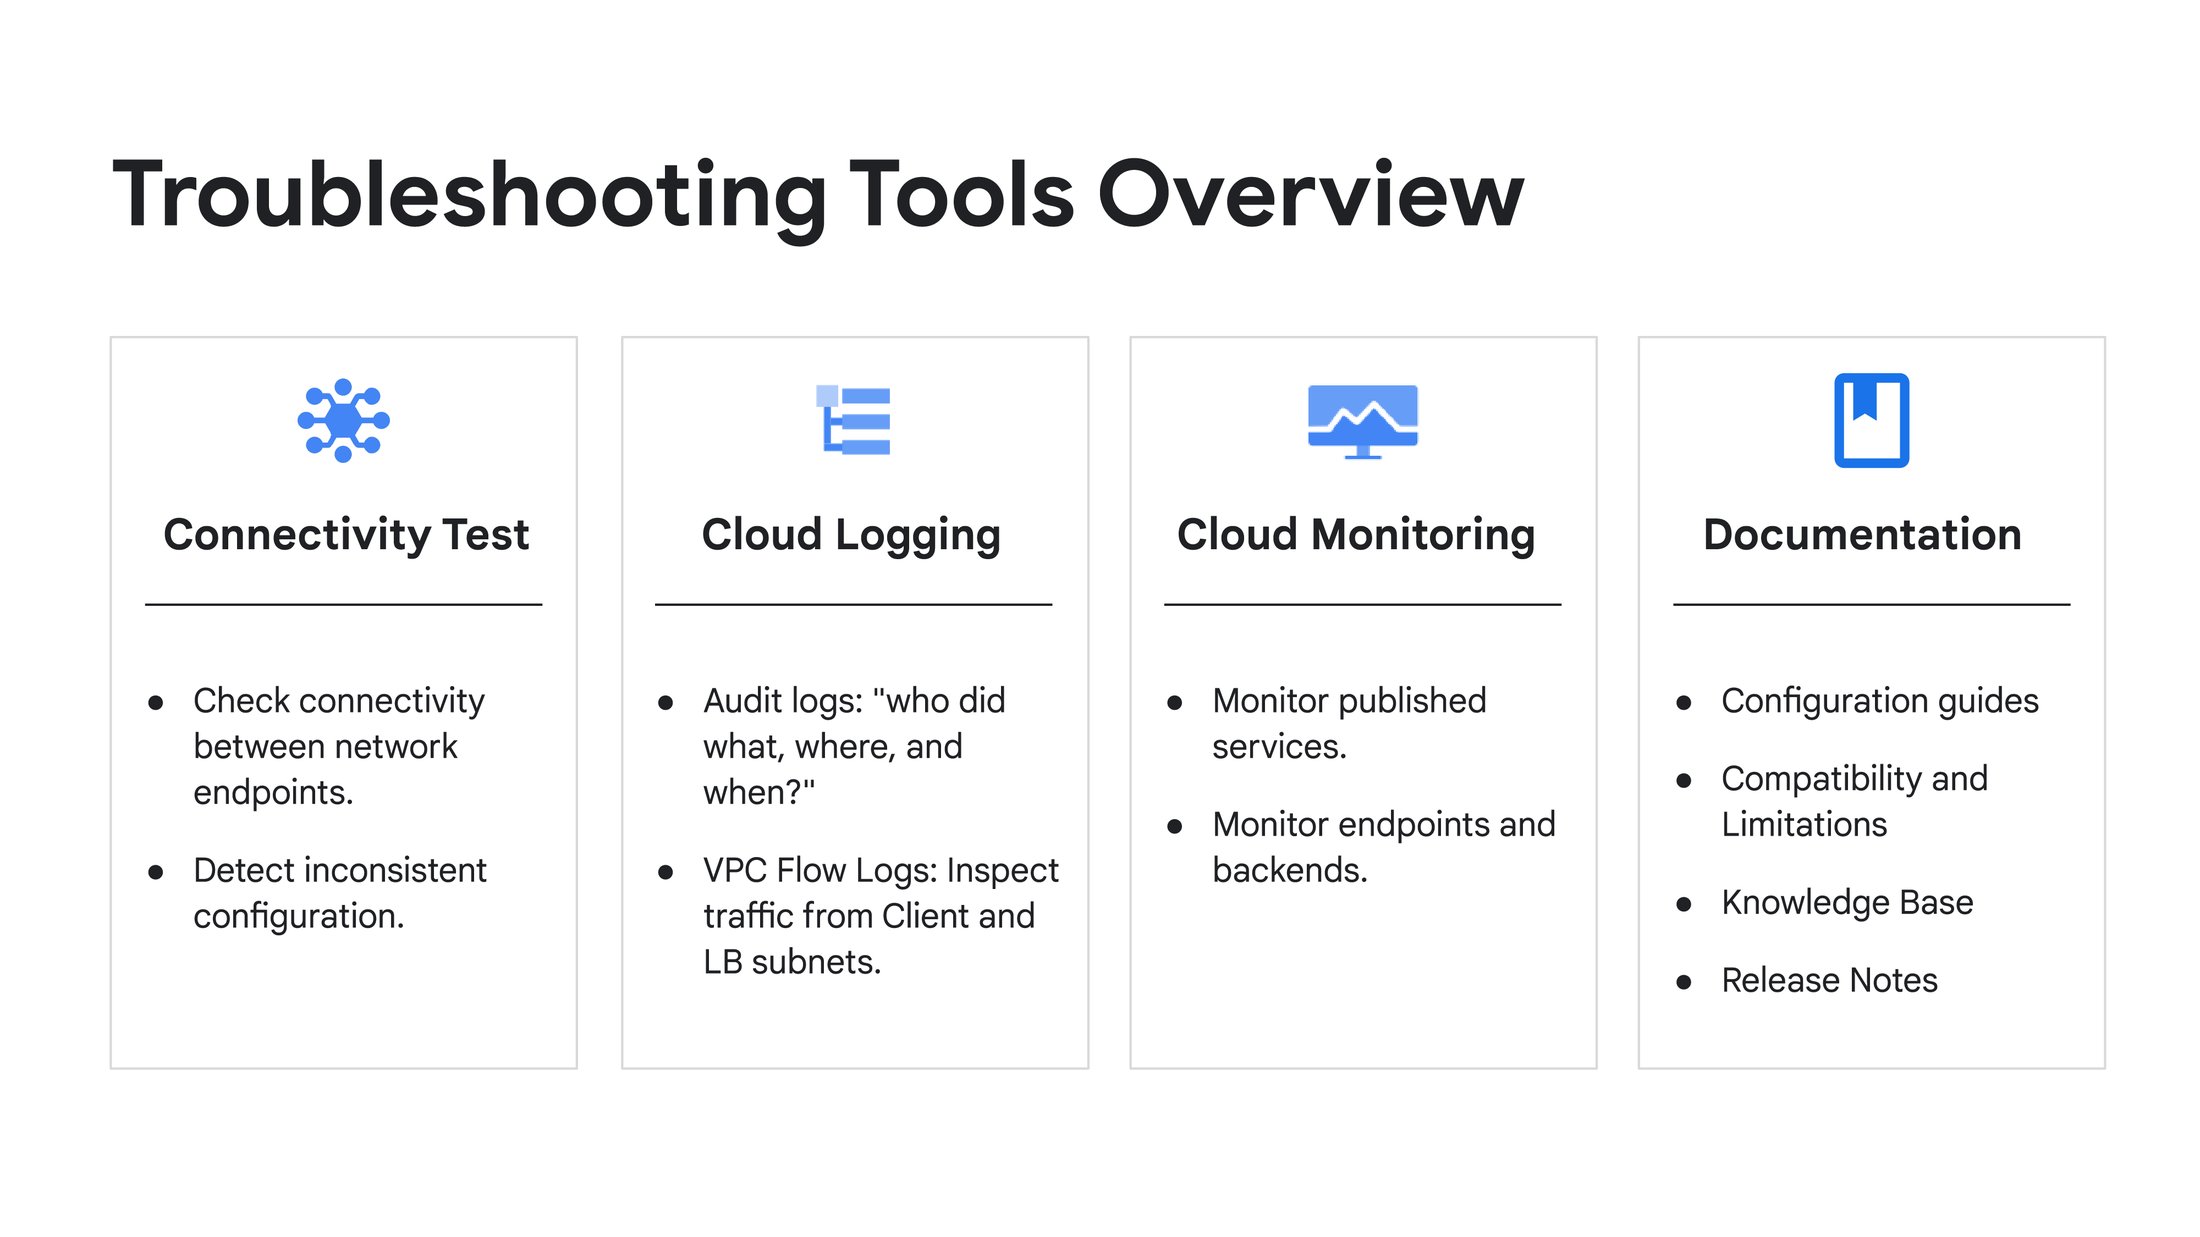
The Google Cloud console provides you with the following tools to troubleshoot most of the Private Service Connect issues that you might encounter.
Connectivity Test
Connectivity Tests is a diagnostics tool that lets you check connectivity between network endpoints. It analyzes your configuration and, in some cases, performs live data-plane analysis between the endpoints.
-
Configuration Analysis supports Private Service Connect: Consumers can check connectivity from their source systems to PSC endpoints (or consumer load balancers using PSC NEG backends), while producers can verify that their service is operational for consumers.
-
Live Data Plane Analysis supports both Private Service Connect endpoints for published services and Google APIs: Verify reachability and latency between hosts by sending probe packets over the data plane. This feature provides baseline diagnostics of latency and packet loss. In cases where Live Data Plane Analysis is not available, consumers can coordinate with a service producer to collect simultaneous packet captures at the source and destination using tcpdump.
Cloud Logging
Cloud Logging is a fully managed service that allows you to store, search, analyze, monitor, and alert on logging data and events.
-
Audit logs allow you to monitor Private Service Connect activity.
Use them to track intentional or unintentional changes to Private Service Connect resources, find any errors or warnings and monitor changes in connection status for the endpoint.
These are mostly useful when troubleshooting issues during the setup or updates in the configuration.
In this example, you can track endpoint connection status changes (pscConnectionStatus) by examining audit logs for your GCE forwarding rule resource:
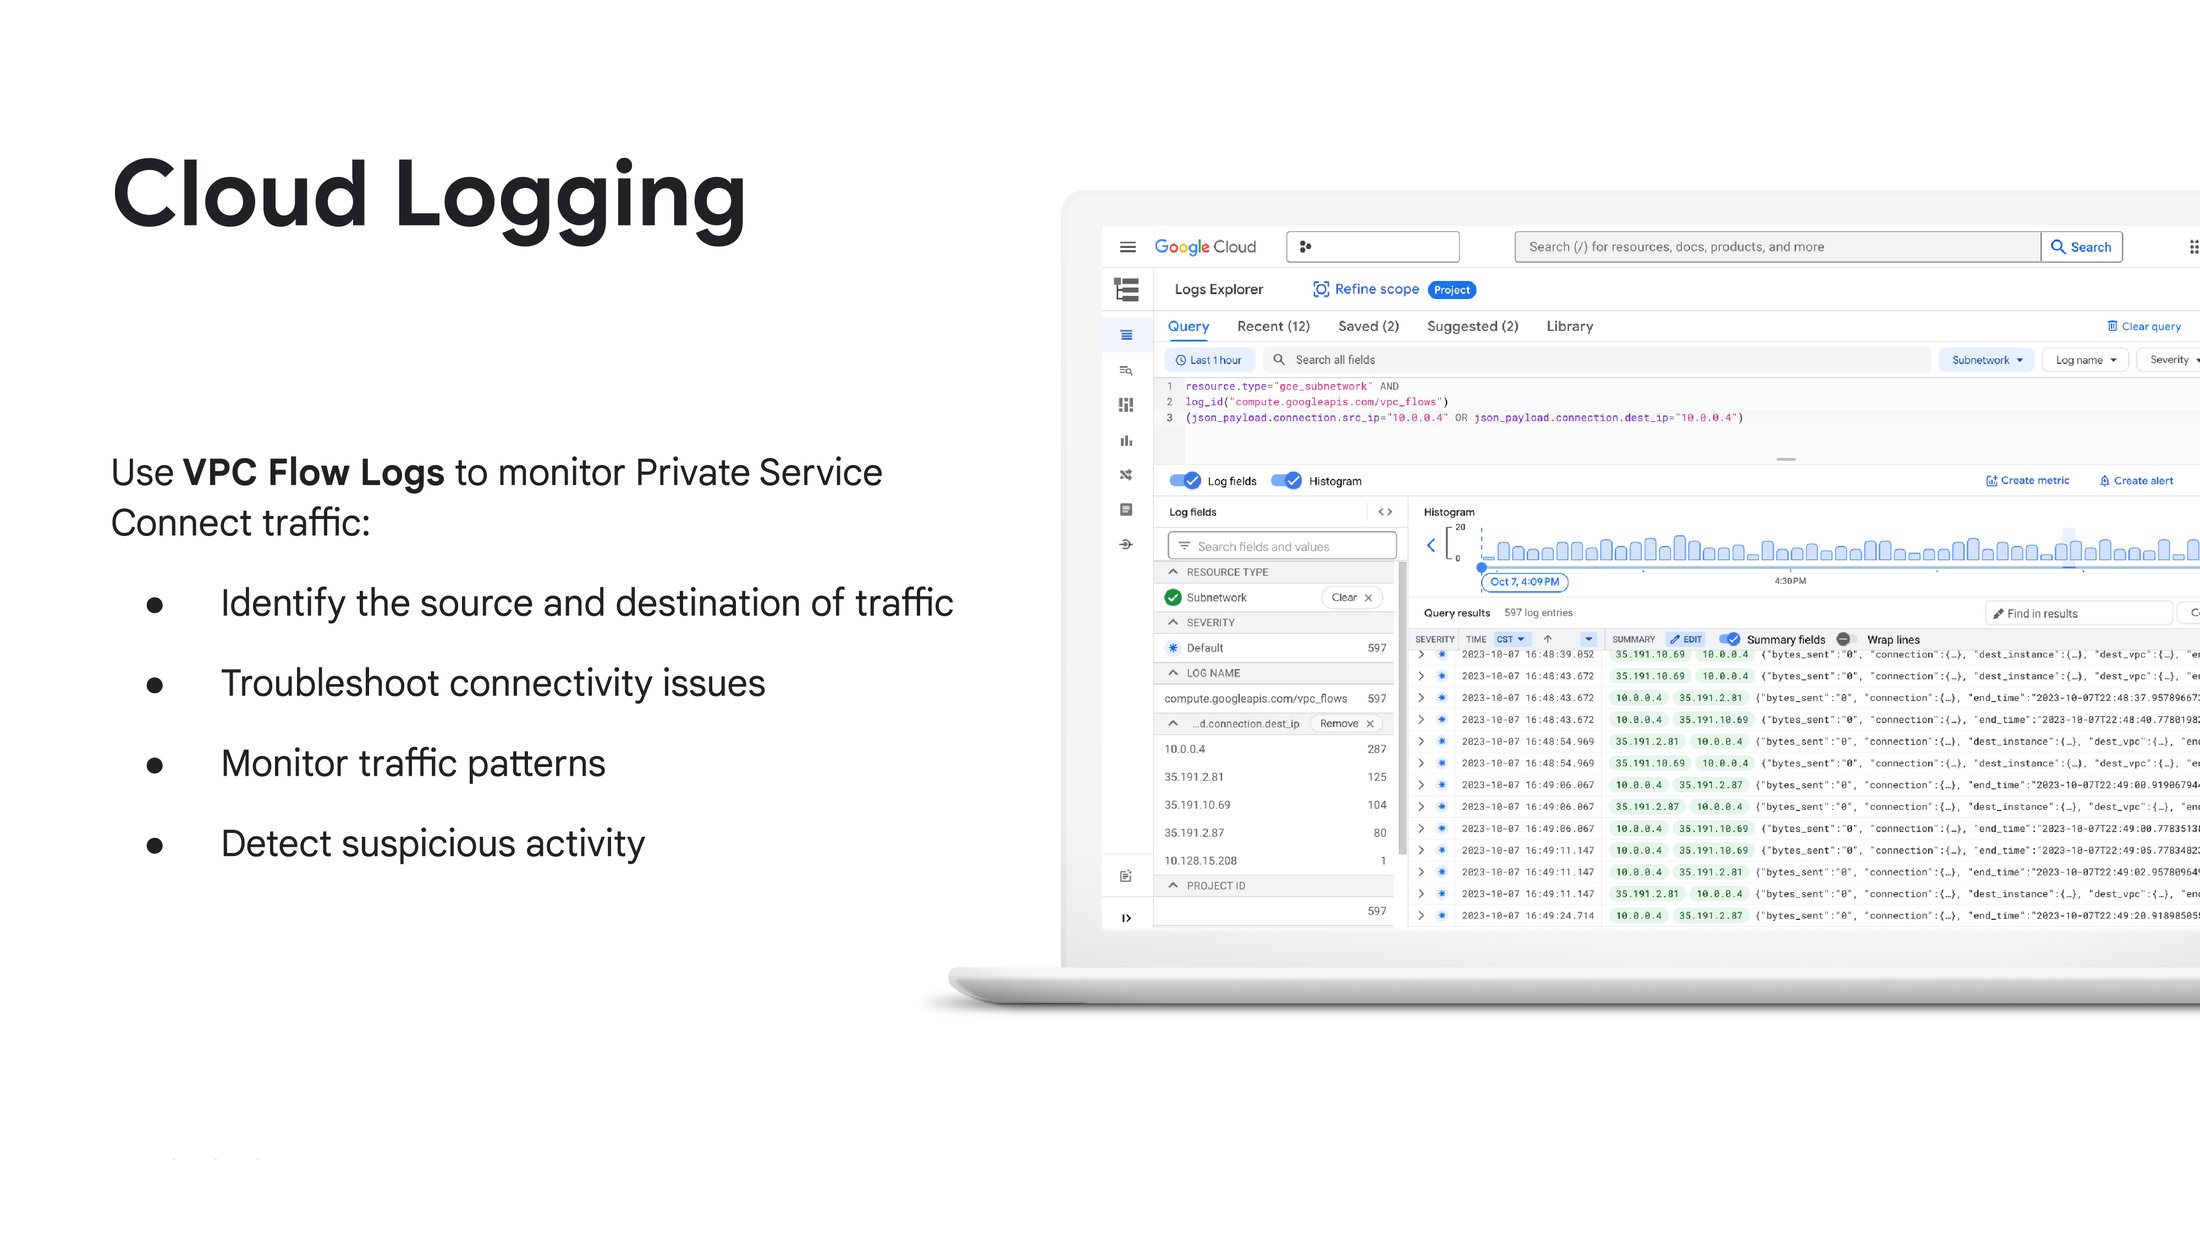
- VPC Flow Logs to monitor Private Service Connect traffic.
Consumers can enable VPC Flow Logs at the client subnet to monitor traffic flow directed to the Private Service Connect endpoint. This allows the consumer to validate traffic egressing the VM instance.
Producers can enable VPC Flow Logs at the target load balancer subnet to monitor traffic ingressing their VM instances backends.
Consider that VPC Flow Logs are sampled and may not capture short-lived connections. To get more detailed information, run a packet capture using tcpdump.
Cloud Monitoring
Another member of the observability stack, Cloud Monitoring can help you to gain visibility into the performance of Private Service Connect.
- Producer metrics to monitor Published services.
Take a look at the utilization of service attachment resources like NAT ports, connected forwarding rules and connections by service attachment ID to correlate with connectivity and performance issues.
See if there are any dropped packets at the producer side (Preview feature).
-
- Received packets dropped count are related to NAT resource exhaustion.
- Sent packets dropped count indicate that a service backend is sending packets to a consumer after the NAT translation state has expired.
When this occurs, make sure you are following the NAT subnets recommendations. A packet capture could bring more insights on the nature of the dropped packets.
Using this MQL query, producers can monitor NAT subnet capacity for a specific service attachment:
- Consumer metrics to monitor endpoints.
You can track the number of connections created, opened and closed from clients to the Private Service Connect endpoint. If you see packet drops, take a look at the producer metrics as well.
For more information, see Monitor Private Service Connect connections.
TIP: Be proactive and set alerts to inform you when you are close to exhausting a known limit (including Private Service Connect quotas).
In this example, you can use this MQL query to track PSC Internal LB Forwarding Rules quota usage.
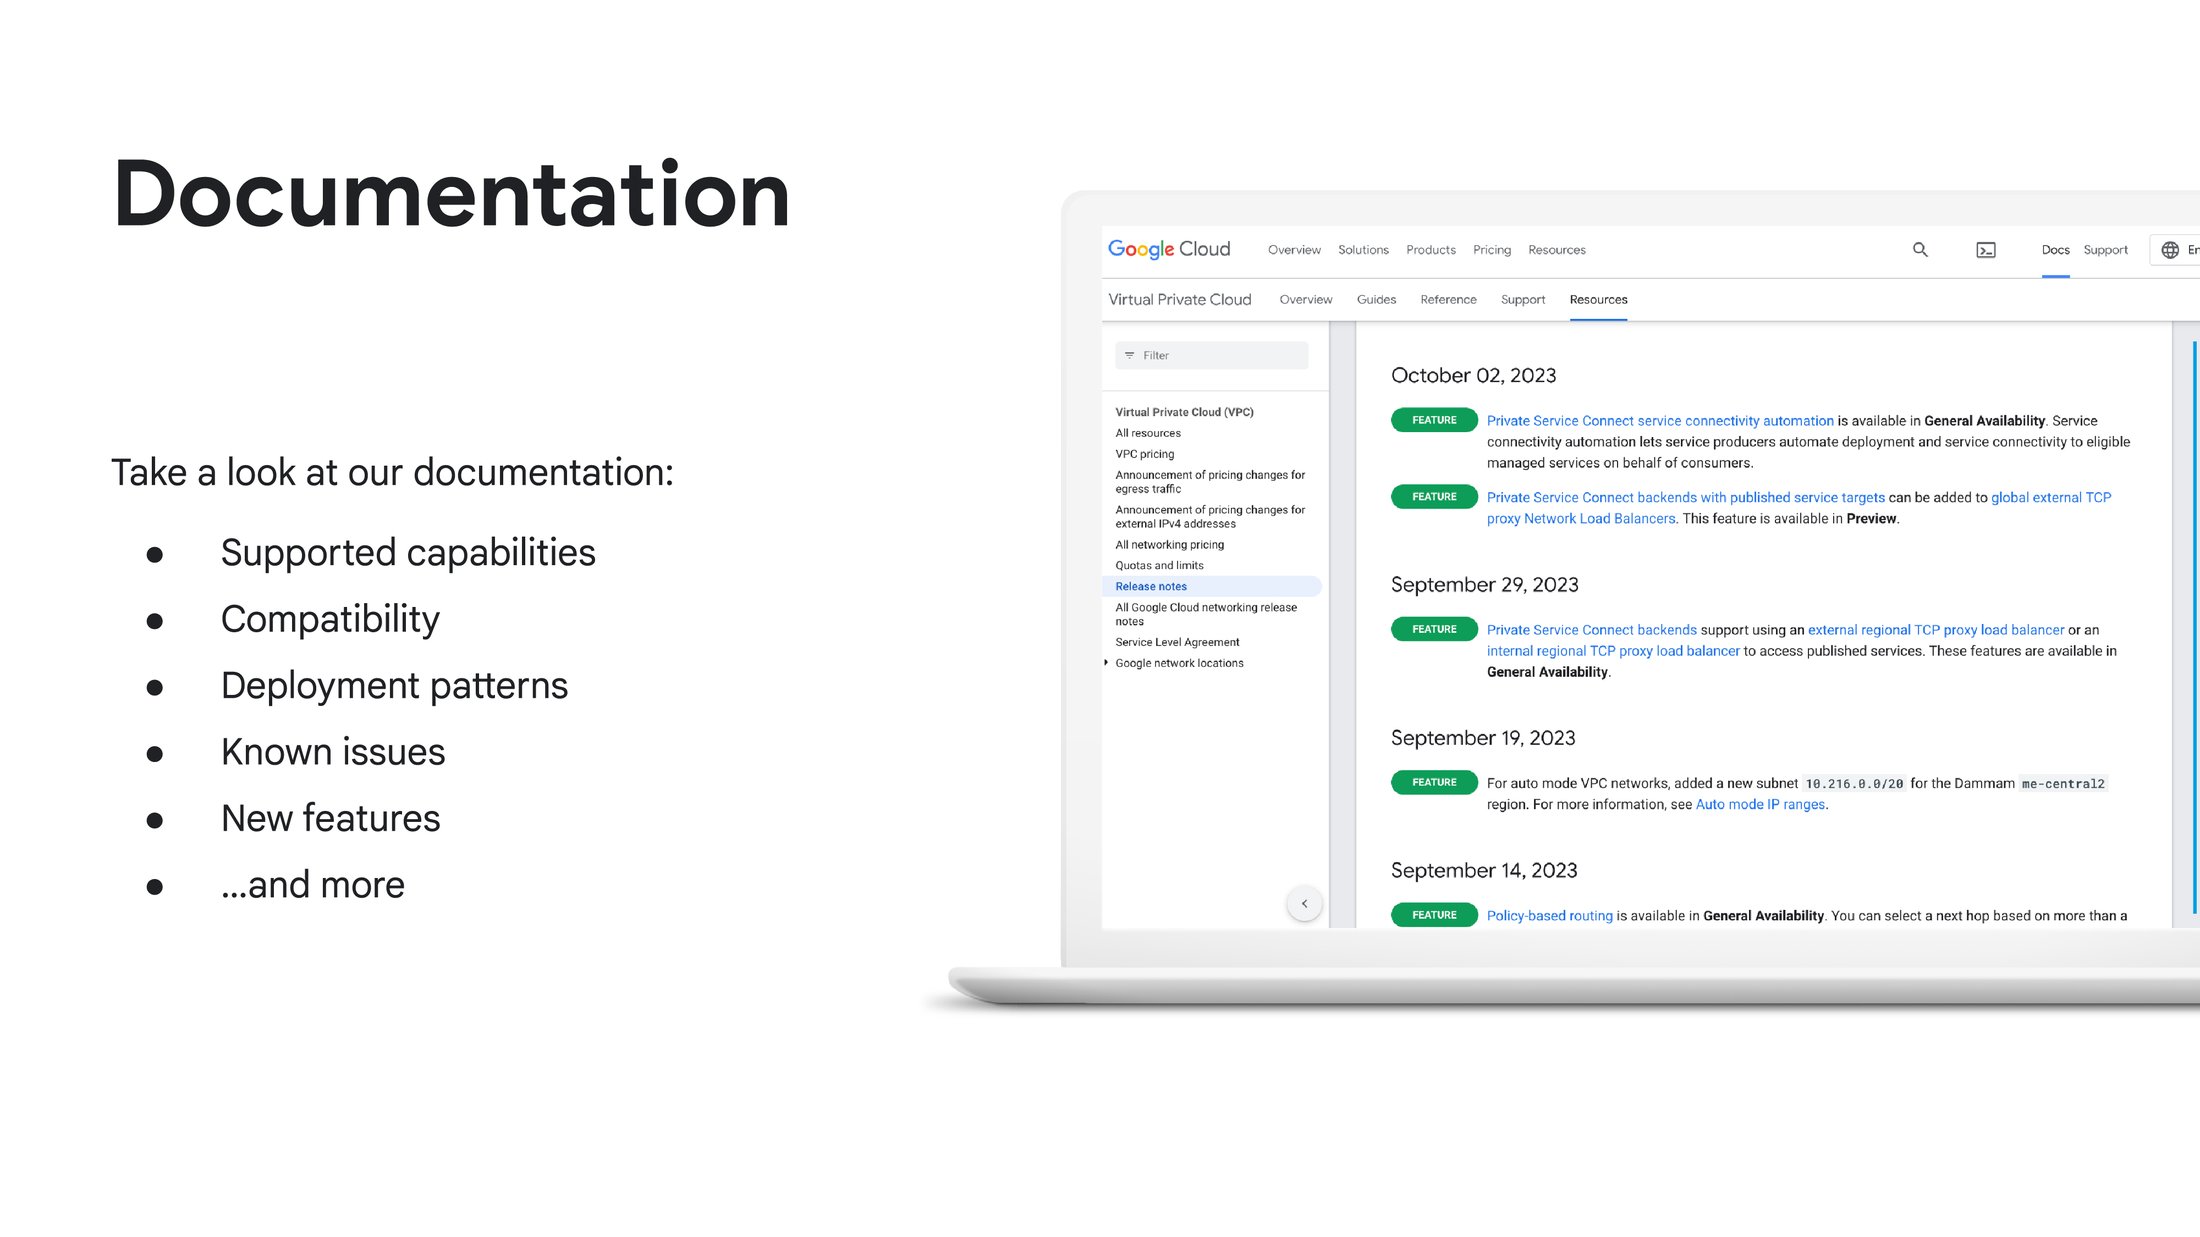
Read the manual
Consult the Google Cloud documentation to learn about the limitations and supported configurations.
- Follow the Private Service Connect guides.
Especially for new deployments, it is common to misconfigure a component or find that it is not compatible or supported yet. Ensure that you have gone through the right configuration steps, and go through the limitations and compatibility matrix. - Take a look at the VPC Release notes.
See if there are any known issues related to Private Service Connect, and look for any new features that could have introduced unwanted behavior.
Common issues
Selecting the right tool depends on the specific situation you encounter and where you are in the life cycle of your Private Service Connect journey. Before you start, gather consumer and producer project details, and that in fact, this is a Private Service Connect issue, and not a Private services access problem.
Generally, you can face issues during setup or update of any related component or additional capability, or the issues could be present during runtime, when everything is configured but you run into connectivity or performance issues.
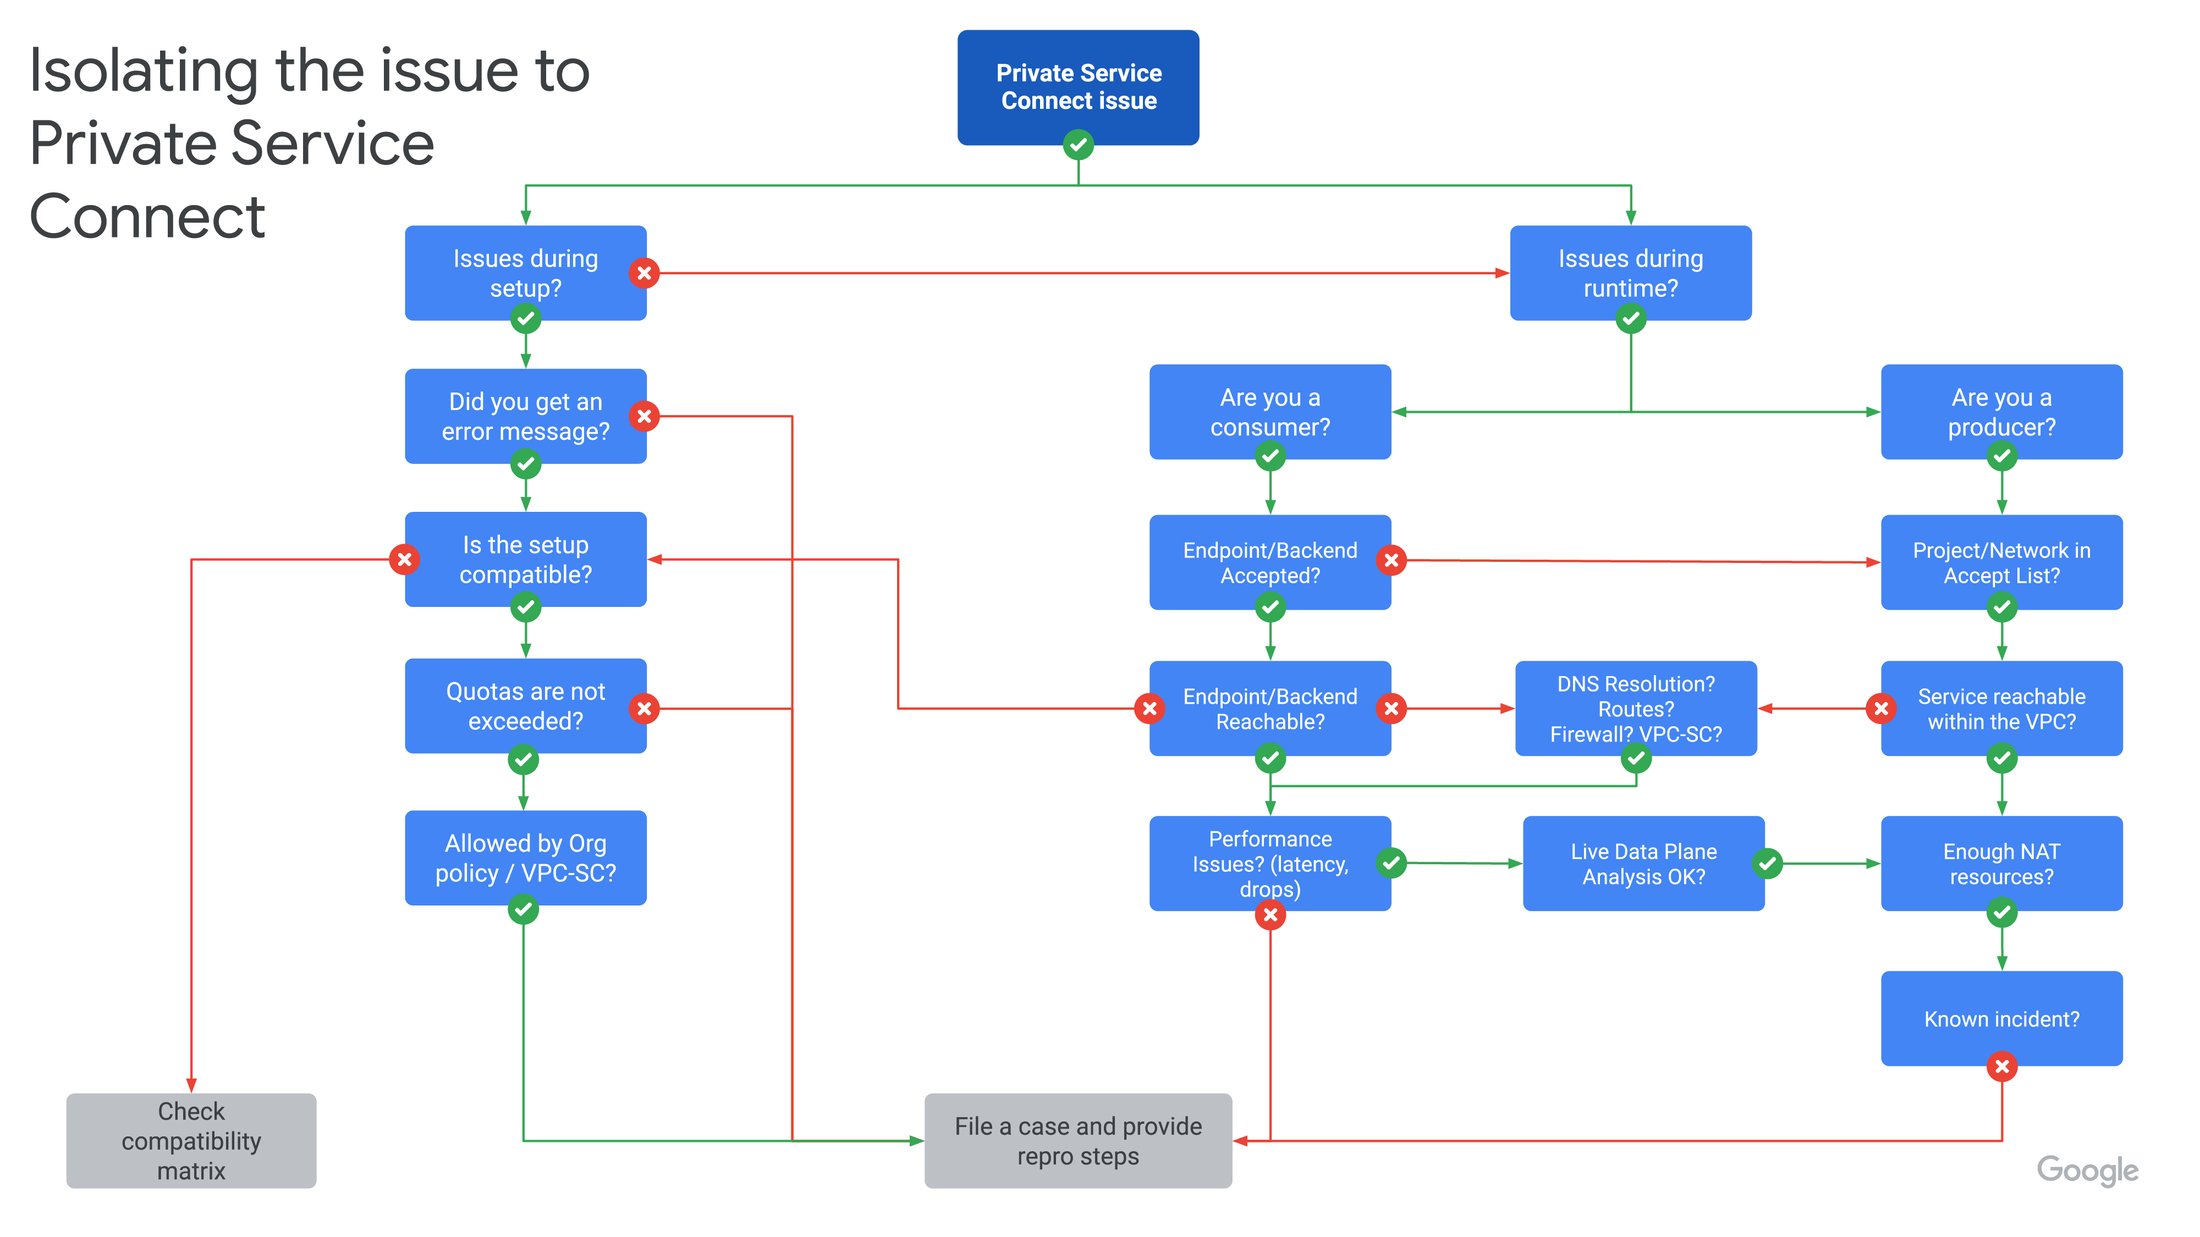
Issues during setup
Make sure that you are following the configuration guide and you have an understanding of the scope and limitations.
- Check for any error message or warning in the Logs Explorer.
- Verify that the setup is compatible and supported as per the configuration guides.
- See if there is any related quota exceeded like the Private Service Connect forwarding rules.
- Confirm whether there is an organization policy that could prevent the configuration of Private Service Connect components.
Issues during runtime
Isolate the issue to the consumer or the producer side of the connection.
- If you are on the consumer side, check if your endpoint or backend is accepted in the connection status at the Private Service Connect page. Otherwise, review in the producer side the accept/reject connection list and the connection reconciliation setup.
- If your endpoint is unreachable, check bypassing DNS resolution and run a Connectivity Test to validate routes and firewalls from the source endpoint IP address to the PSC endpoint as destination. On the service producer side, check if the producer service is reachable within the producer VPC network, and from an IP address in the Private Service Connect NAT subnet.
- If there is a performance issue like network latency or packet drops, check if Live Data Plane Analysis is available to determine a baseline and isolate an issue with the application or service. Also, check the Metrics Explorer for any connections or port exhaustion and packet drops.
Working with Cloud Support
Once that you have pinpointed the issue and you have analyzed the problem, you may need to reach out to Cloud Support for further assistance. To facilitate a smooth experience, be sure to explain your needs, clearly describe the business impact and give enough context with all the information collected.