Leveraging Network Telemetry for Forensics in Google Cloud
Iman Ghanizada
Global Head of Security Operations Solutions, Google Cloud
David Tu
Networking Specialist Customer Engineer, Google
Try Google Cloud
Start building on Google Cloud with $300 in free credits and 20+ always free products.
Free trialWhen it comes to detecting threat actors in your cloud infrastructure, Security Operations teams often need to be able to stitch together various bits of data from logs to help tell a story and validate the presence of an attacker. The three core data sources that help identify patterns of attackers in the cloud are cloud logs, endpoints logs, and network logs. Network monitoring matters because it can provide agentless threat detection capabilities in areas where endpoint logs can not (e.g. monitoring unmanaged devices) and provide context that can validate the presence of an attacker.
Moreover, in legacy environments it was significantly more complicated to place sensors across much of the technology stack to capture network data, encrypted or not. In the cloud, with powerful technologies like Google Cloud’s Packet Mirroring service, capturing network traffic across your infrastructure is much simpler and more streamlined. Capturing full network traffic is still a very costly activity, but for many organizations, especially highly regulated companies, capturing network traffic is a compliance requirement.
The issue that many organizations face is the uncertainty of how to retrieve and correlate this data. Some look at VPC Flow Logs to give them network monitoring. VPC Flow logs provide general connection details, such as 5-tuple (protocol, source address, source port, destination address, destination port) information, but do not provide the additional details beyond the connection and relevant Google Cloud metadata. The biggest reasons why VPC Flow Logs alone may not work for you, is it only provides sampled data (roughly 1 out of every 10 packets is logged), and might lack relevant data for forensics purposes. Users usually deploy VPC Flow Logs to cast a wider net, while deploying Packet Mirroring for in-depth monitoring. Packet Mirroring ensures that all information, including packet contents, is captured, enabling pinpoint precise attack payloads and patterns. On the flipside, deploying Packet Mirroring across your entire cloud infrastructure can be costly, and users often opt for a combination of VPC Flow Logs on a wider scale, with Packet Mirroring on higher sensitivity resources
The Network Forensics and Telemetry blueprint provides extensive network visibility, allowing customers to easily deploy via Terraform and gain network visibility which could be used for network monitoring and forensics with Chronicle or any SIEM. This blueprint is leveraged within our Autonomic Security Operations solution, but can also be leveraged in any other capacity as needed. For organizations that prefer a managed approach to network detection, we’ve also recently announced the launch of Cloud IDS. In this blog, we’re diving deeper into what this blueprint offers.
Blueprint Core Concepts
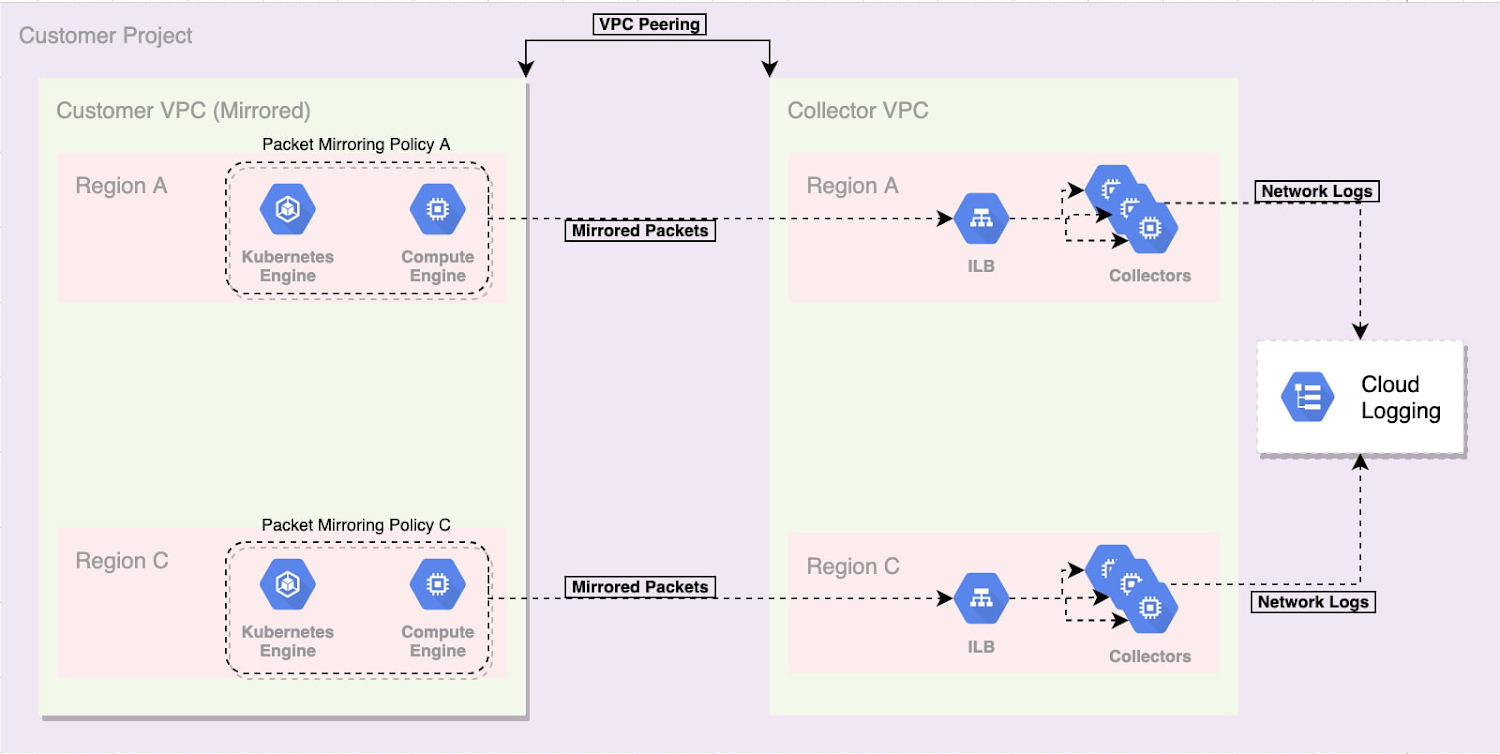

Before diving into how everything works, we’ll cover the basic components of this blueprint.
VPC Peering - Peering is leveraged to connect your VPC to a VPC called the “Collector” VPC. The “Collector” VPC holds your Load Balancers and backend collector Virtual Machines.
Packet Mirroring - This service provides the ability to create policies to mirror traffic from your VPC to the collector VMs for network inspection and transaction logs.
Internal L4 Load Balancer - This load balancer front-ends your Backend Virtual Machines. It is the destination for Packet Mirroring policy so that load can be distributed to multiple collectors.
Zeek - Zeek is an open source network security sensor installed on the collector VMs. It takes the network packets and creates rich transaction logs.
Google-fluentd - This is a logging agent that sits on the collector VMs. This logging agent will send the logs generated by Zeek to Cloud Logging, which is natively ingested by Chronicle.
For a complete description of core components, please refer to the Terraform core concepts document.
The blueprint provides two components.
A packer script to create a “golden image”.
A Terraform script to automate the creation and deployment of all necessary components for the blueprint.
Blueprint Golden Image and Packer Script
The blueprint provides a “golden image” for the collector VMs. This image has the necessary software and service packages of Zeek and Google-fluentd. The blueprint also provides the packer script used to create the golden image. The packer script can be used to create a custom image if required.
Blueprint Terraform Script
The blueprint consists of a Terraform script to automate the creation and deployment of all necessary components to generate network transaction logs for forensics and telemetry.
The Terraform script requires a service account with various IAM permissions. This service account will then perform the following tasks with the provided user inputs.
Create the “Collector” VPC
Create the “Collector” subnets
Peer the “Collector” VPC with the customer “Mirrored” VPC
Create Cloud Firewall rules in the “Collector” VPC to allow traffic from “Mirrored” VPC
Create an instance template leveraging the “golden image” or custom image
Create a Managed Instance Group referencing the template, with auto scaling enabled
Create an Internal Load Balancer with Packet Mirroring enabled
Create a Packet Mirroring policy
As you can see, it could be tedious to manually provision everything. We’ve made it simple via Terraform to create and deploy everything in one go. We’ve also provided flexibility so you can define various components, such as VPC name, subnets to be used for the “Collector” VPC, and more importantly the ability to define unique Packet Mirroring policy settings.
Terraform Examples
The blueprint provides 4 examples to help you get started.
Basic Configuration - This example will demonstrate to you the default Packet Mirroring Policy which will mirror both ingress and egress traffic for all compute resources in the subnets defined.
Mirror Resource Filtering - This example will demonstrate the flexibility to define various Packet Mirroring Policy filtering configurations. Instead of mirroring all compute resources in a subnet, you can mirror only compute resources with a specific network tag. Or you can define individual compute resources.
Packet Mirroring Traffic Filtering - This example will demonstrate the flexibility to define what type of traffic should be mirrored. Are you looking for only ingress or egress traffic? Are you only looking for specific protocols such as TCP? Maybe you only care about traffic to/from a specific CIDR range.
Multiple VPC Support - This example will demonstrate how to configure multiple VPCs for the blueprint. The blueprint supports VPCs from the same project, but you can also connect to/from VPCs in a separate project (IAM permission required).
Once the Terraform script is deployed, your environment will generate network transaction logs for the mirrored compute resources defined. These logs are available in Cloud Logging.
Network Transaction Logs
To view the logs in Cloud Logging, we’ve made it simple by filtering by the log name. A simple query can be crafted by defining the type of logs you’re interested in. As mentioned previously, the Zeek configuration has been modified specifically for Google Cloud to include additional GCP related details. The collectors will generate various network transaction logs. Some of the more commonly generated logs would be:
Conn Logs - Connection logs are arguably one of the most important logs. They provide connection details such as time, IPs, ports, protocols, bytes, packet count, and connection duration.
HTTP Logs - Specific to HTTP traffic, HTTP Logs provide transactional details including connection information, HTTP request method, host header, uri, user-agent, response code, and mime types.
SSL Logs - Provides transactional details into SSL traffic. Provides connection information with SSL details such as ciphers, SNI, and certificate details.
SSH Logs - Provides transactional details into SSH traffic. Provides connection details as well as authentication status, lateral movement, inbound and outbound movement, and failed movement.
We make it easy to filter for specific logs by filtering by log file name. Each log type will follow the format “zeek_json_streaming_xxx”. For the four logs above, they would be:
zeek_json_streaming_conn
zeek_json_streaming_http
zeek_json_streaming_ssl
zeek_json_streaming_ssh
With the query structured as:logName="projects/<Project_ID>/logs/<Log_File_Name>"
Below is an example of the json contents from Cloud Logging for a curl request to my webserver. (Connection and HTTP logs)
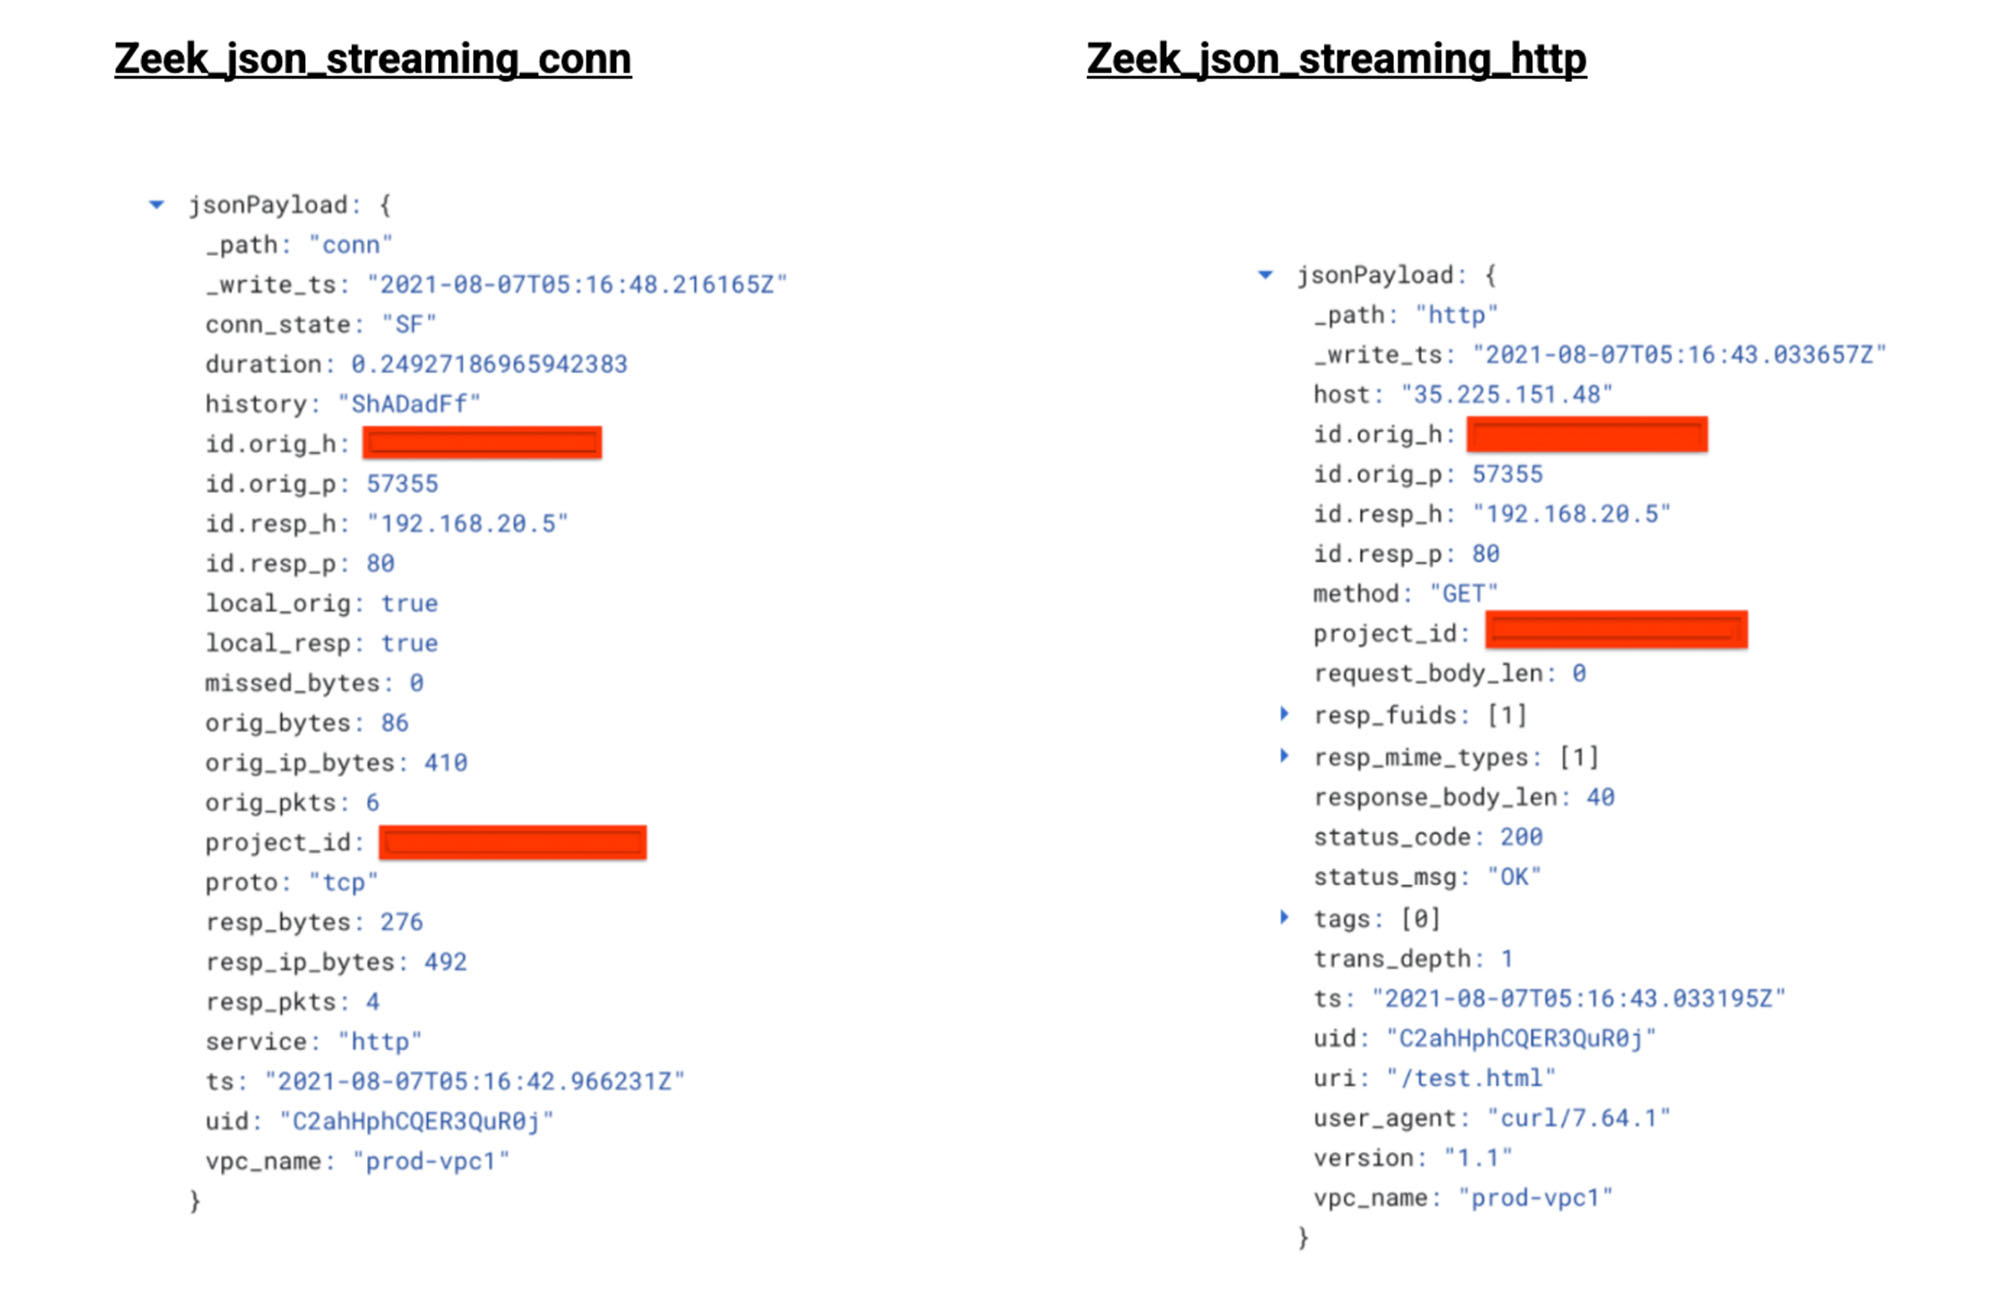

As you can see on the left, the connection logs provide additional metadata about the request. What’s also convenient, is that we’ve modified Zeek to include GCP related components, such as the project_id, and vpc_name.
When looking at the right, the HTTP logs provide layer 7 metadata about the request. We’re able to see additional HTTP details that are beyond what the connection logs provide. We can even verify that these are the same requests based on the same uid.
In the next example we’ll take a look at what VPC Flow Logs provides and then compare it to what this blueprint provides.
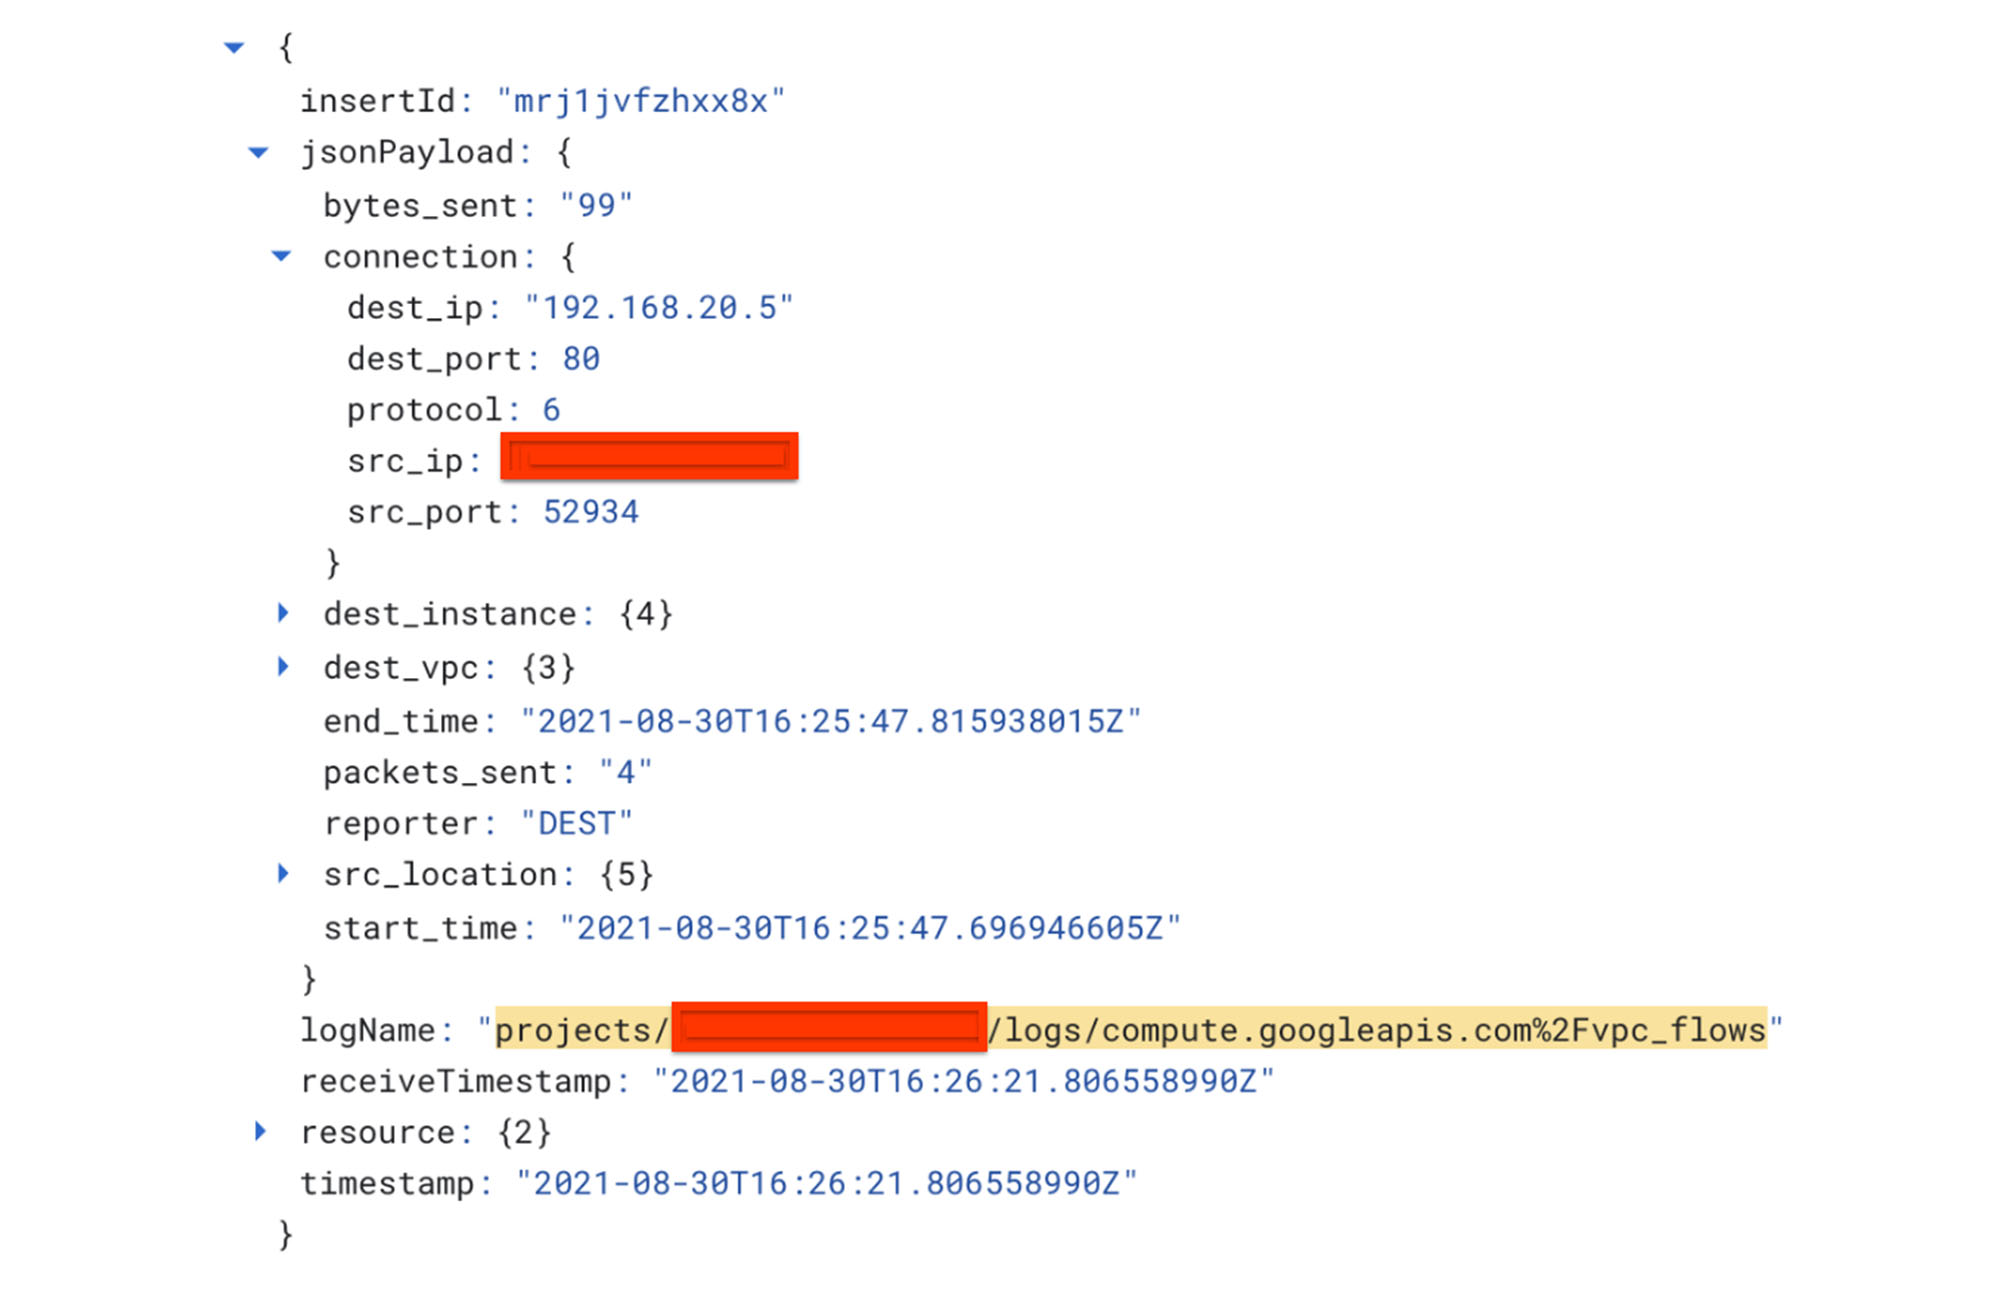

As you can see, VPC Flow Logs only show connection details. Now when looking at the blueprint HTTP Logs, you’re able to get additional information.
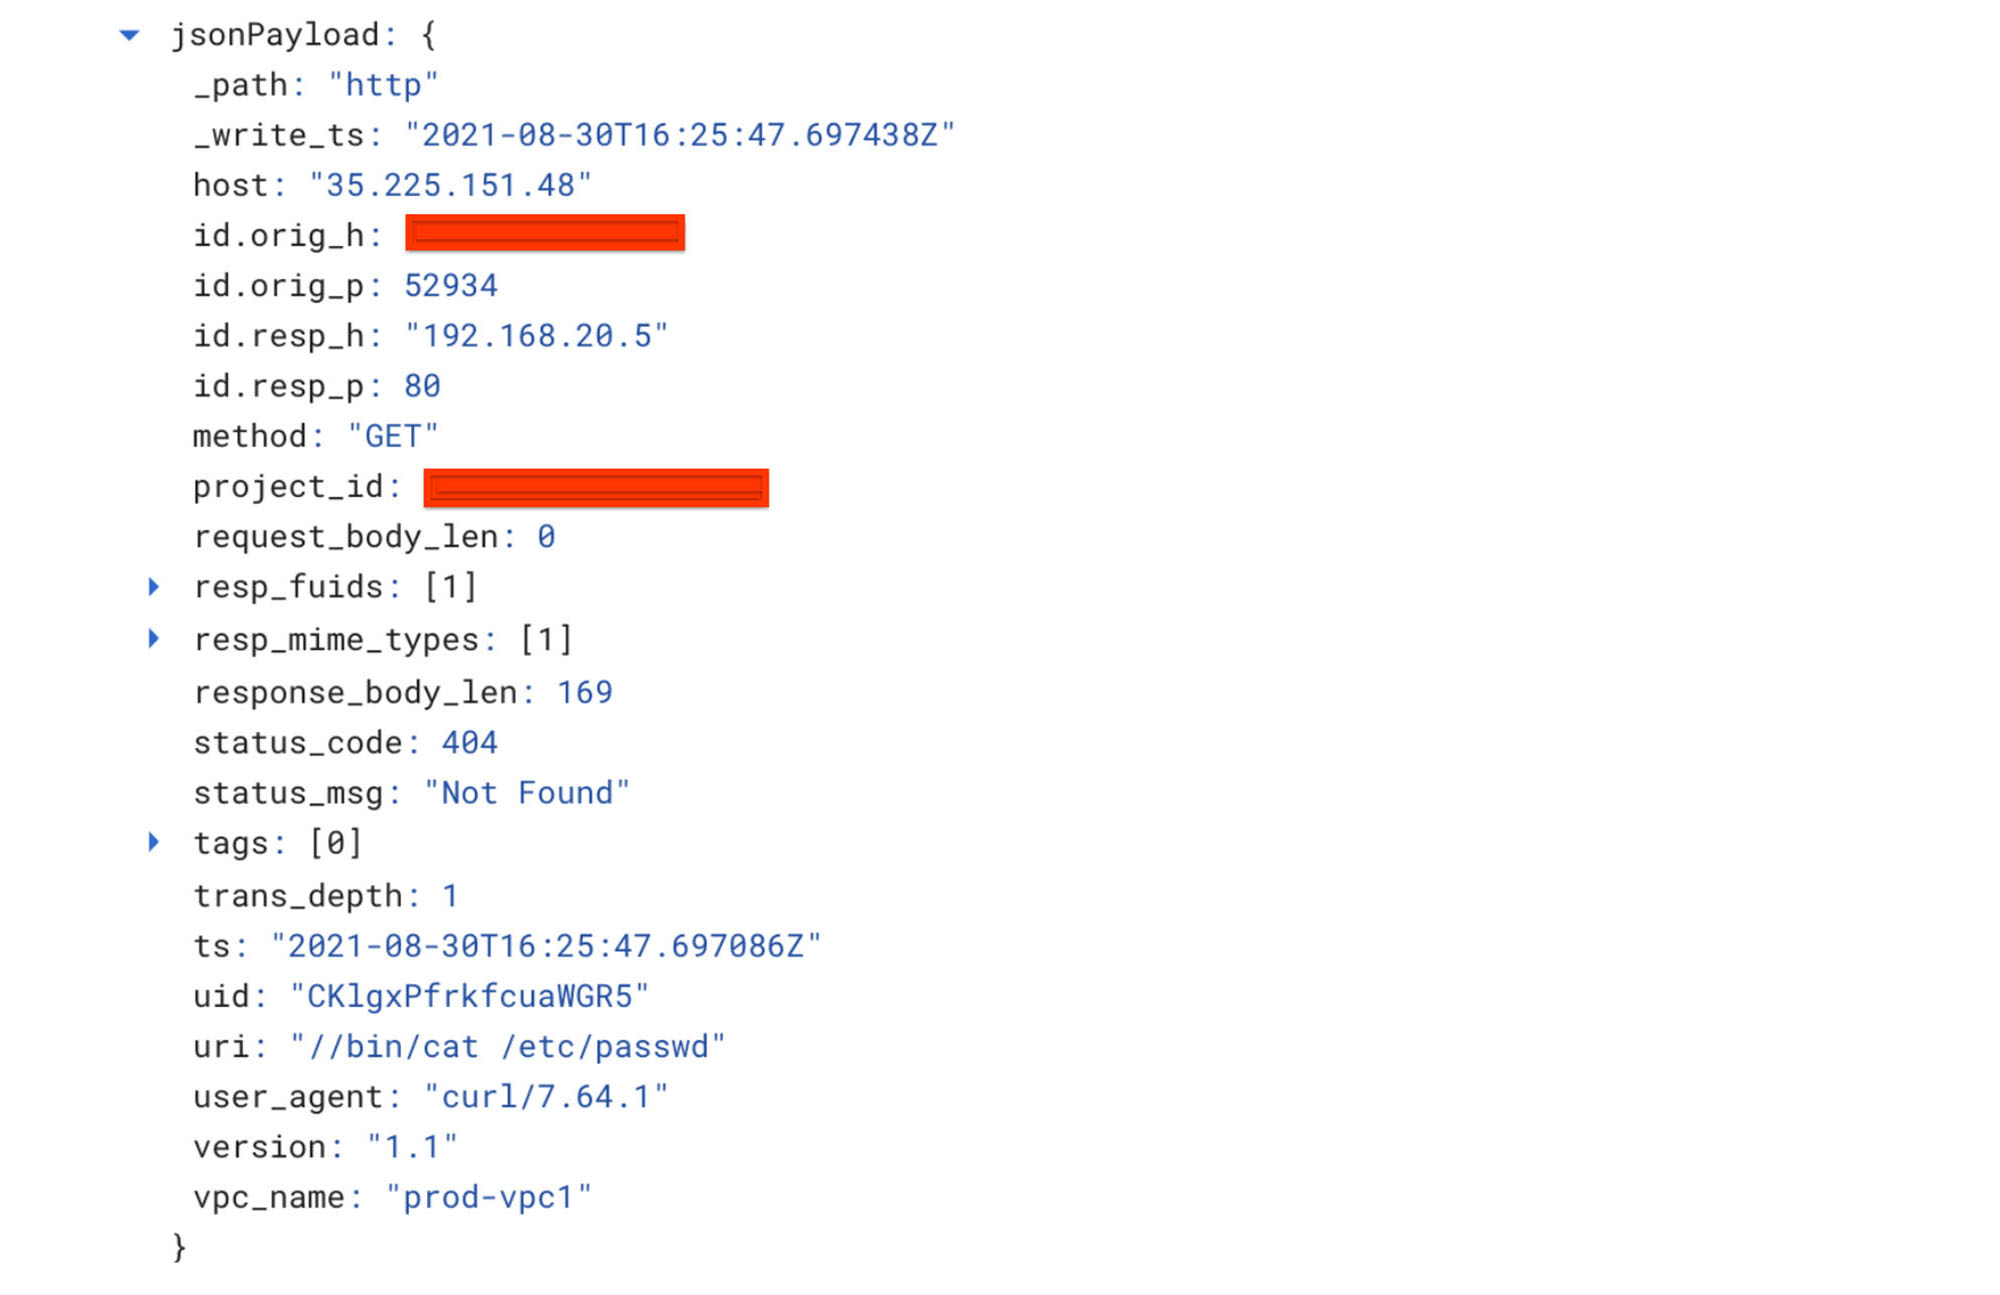

With this visibility, Chronicle or your SIEM of choice would be able to provide you with threat details and notify you that there was an HTTP /etc/passwd access attempt. This blueprint provides you with the information needed to detect threats. Implementing this blueprint is an important step for most Security Operations teams to be able to leverage network telemetry in their detection and response program.
Next Steps:
If you like to explore the solution, go to gitHub and download the open source repository holding the Terraform scripts and the golden image.
If you’re interested in learning more about why network security monitoring is important, take a look at this blog post.
To learn more about transforming Security Operations, take a look at our Autonomic Security Operations solution.

