Introducing Microservices observability
Feng Li
Software Engineer, Google
Editor’s note: Originally released to Public Preview for Go and Java in October 2022, Microservices observability became generally available for C++, Go, and Java on April 24, 2023. The feature is now named “Microservices observability” instead of the previous “gRPC Observability for microservices”.
gRPC is a modern open source high performance Remote Procedure Call (RPC) framework that can run in any environment. It plays a critical role in efficiently connecting microservices in and across data centers with pluggable support for load balancing, tracing, health checking, authentication and other cross-cutting features. It may also be applied in the last mile of distributed computing to connect devices, mobile applications and browsers to backend services hosted on the public cloud. This unique position in the software stack can provide a clear end-to-end view of the whole system. A new Microservices observability feature provides this clarity for workloads running on, and/or able to connect to, Google Cloud.
The kinds of observability data provided
Microservices observability provides three different types of data:
1. Logs for key RPC events, including:
When the client/server sends or receives the metadata of an RPC
When the client/server sends or receives the message payload of an RPC
When the client/server finishes an RPC with a final status (OK, or errors)
2. Metrics (or statistical data) for key RPC events, including:
How many bytes the client/server sent or received
How many RPCs the client/server started or completed
How long RPCs take to complete between the client and server (known as round trip latency)
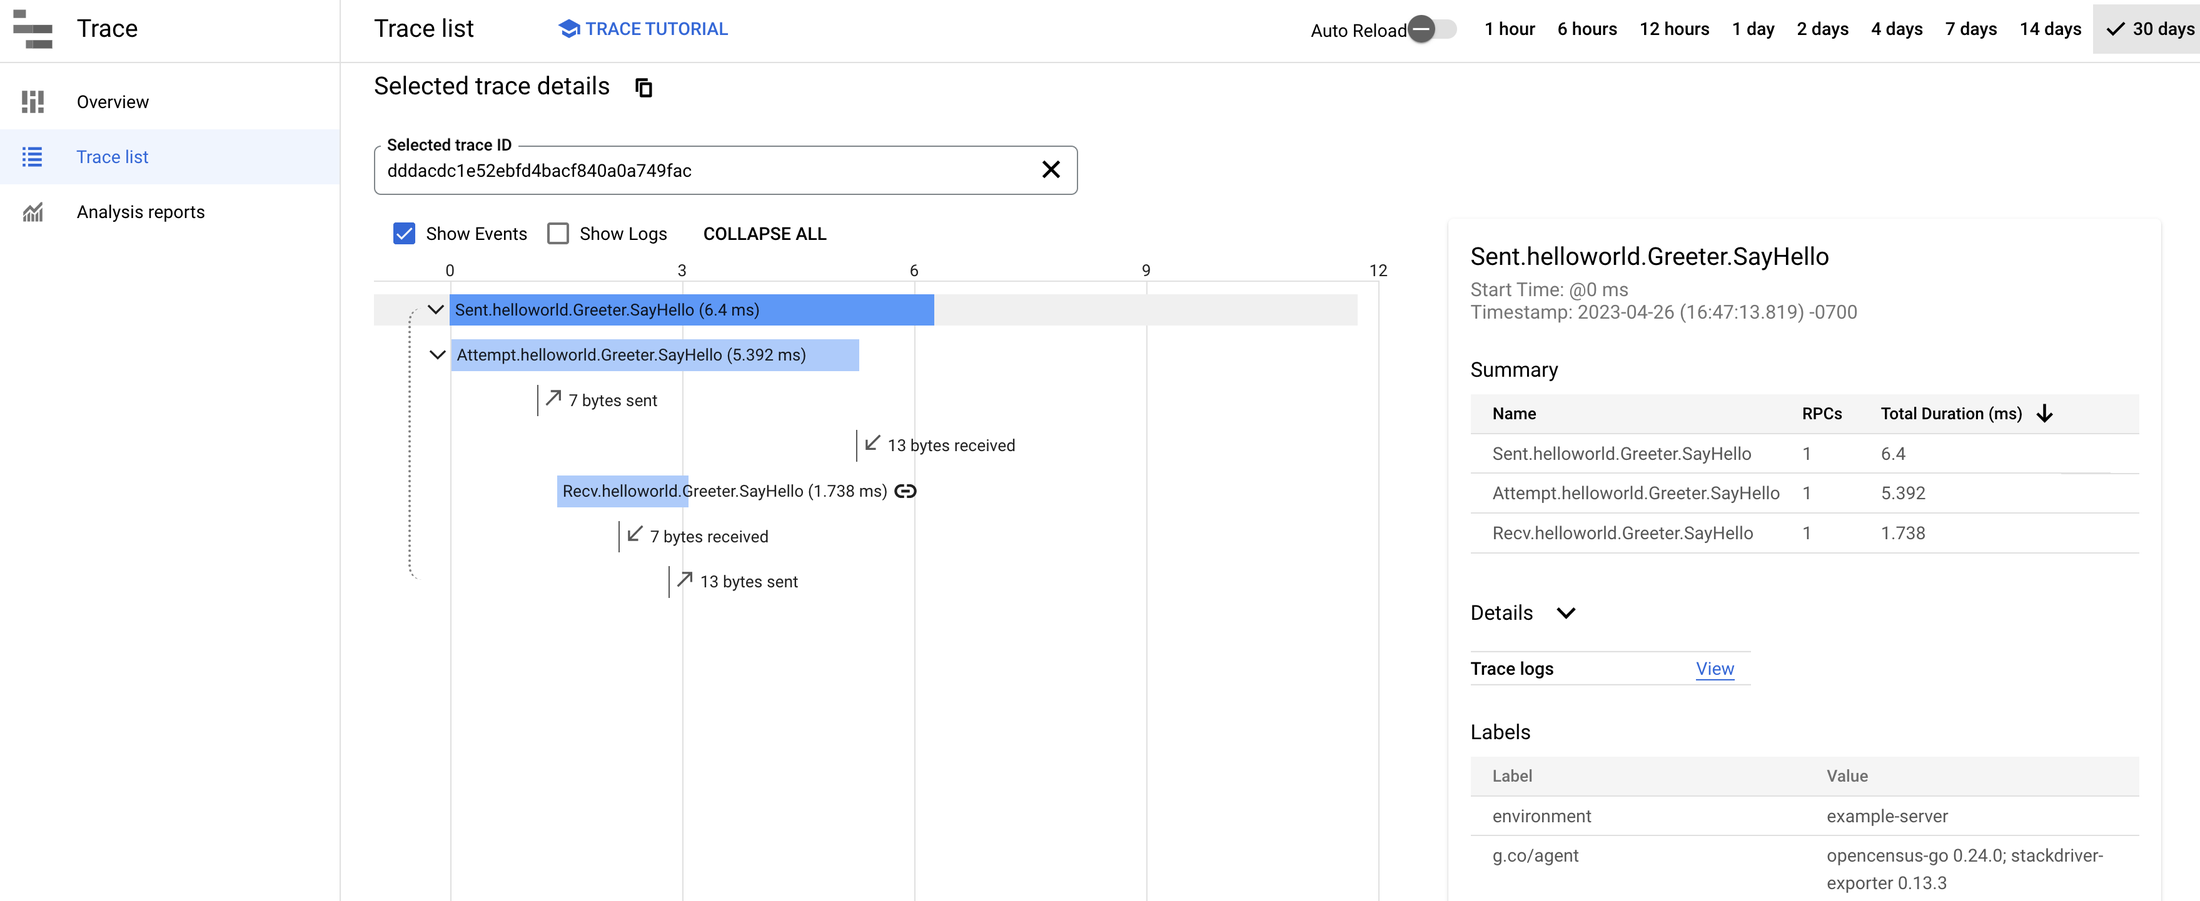
3. Distributed traces for RPCs and their fanout RPCs across the system. For example, when serving an RPC from upstream, a server may need to create multiple RPCs to its own backends. The distributed trace helps the user understand the relationships between these RPCs, the latency for each of them, and key events happening throughout the system.
How the observability data is produced and collected
When developers enable the Microservices observability feature in their binaries, the gRPC library will report the logging, metrics, and tracing data to Google Cloud’s operations suite. Once the observability data is collected, users can leverage the Google Cloud console to:
Visualize the observability data
Export the observability data out of the operations tools for further analysis with other tools.
Logging
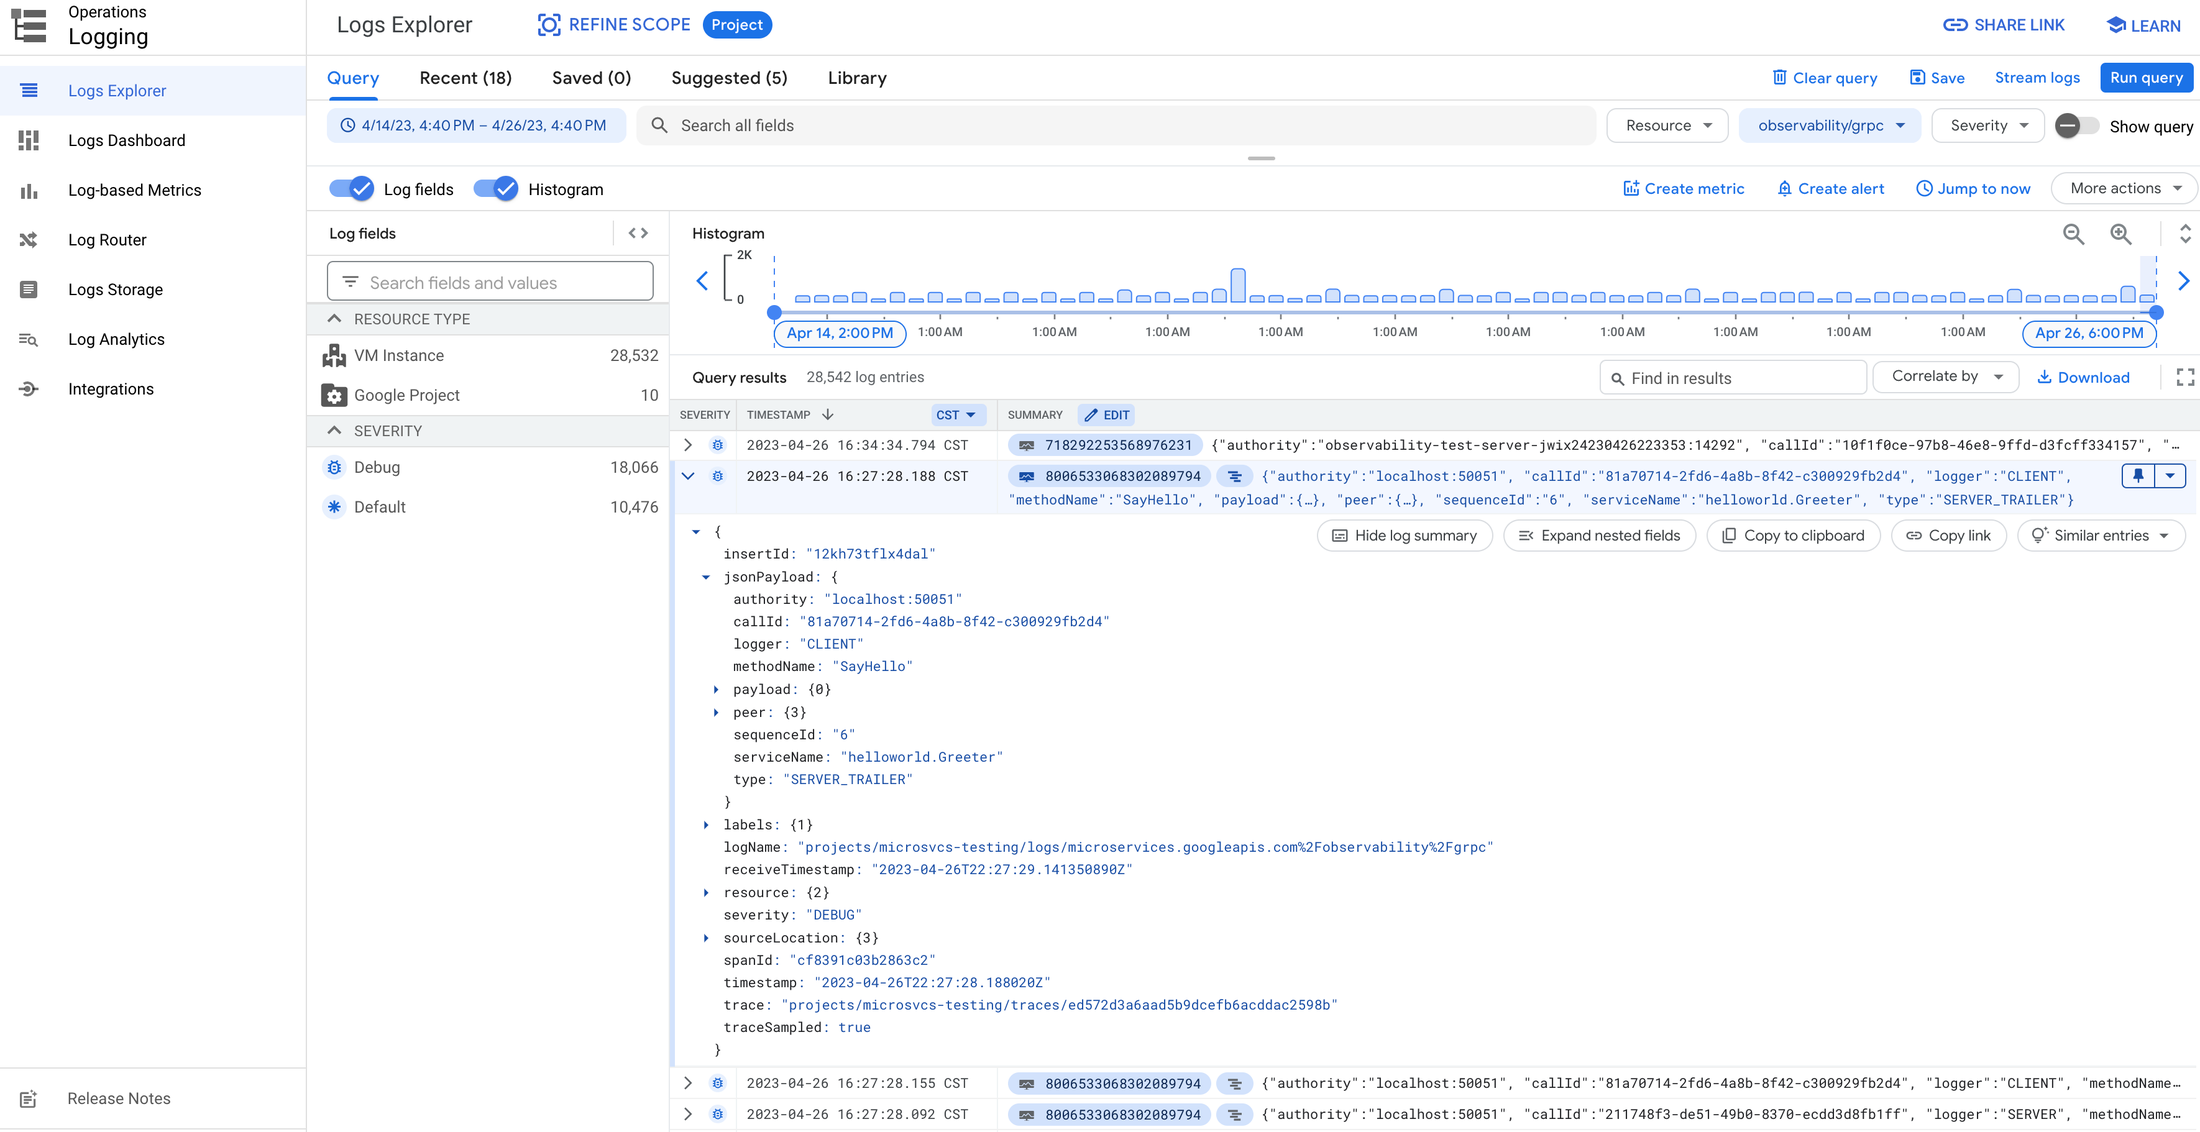
Microservices observability provides logs for key RPC events with information to help developers understand the context when these events occur. This contextual information can include which gRPC service/method is being invoked, whether the events happen on the client side or server side, whether it’s sending metadata or payloads, the size of the corresponding data, and even the concrete content of the metadata and/or payloads. These log entries are then presented in Cloud Logging with helpers to filter and even customize the query to search related logs.

Metrics
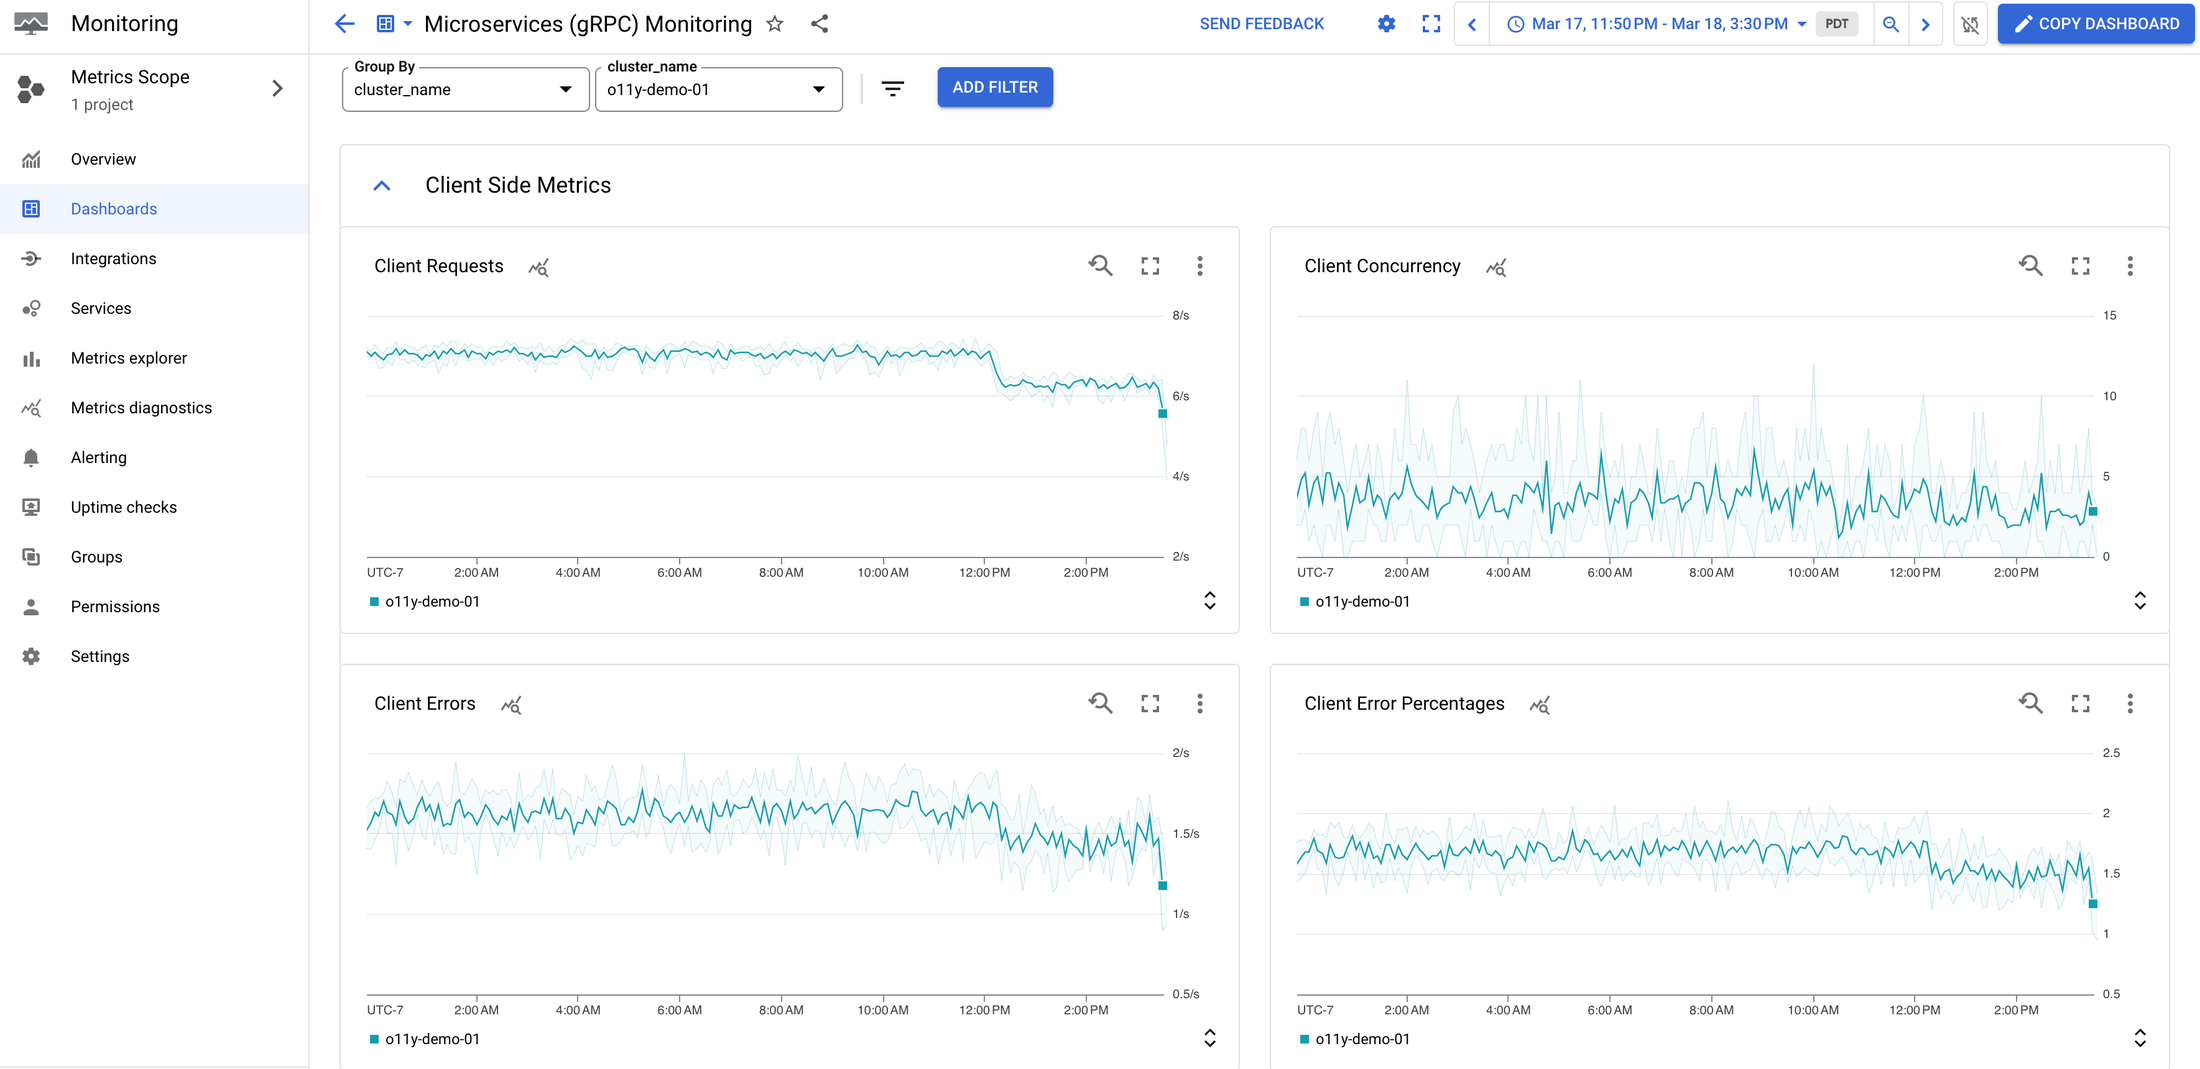
Microservices observability provides several metrics: the round trip latency of RPCs, how many RPCs were started and finished during a specific period of time, and even the number of bytes sent/received over the wire. All these metrics can be grouped by a few important parameters, including service/method name and final status. Platform-specific metrics can be included as well, depending on the Google Cloud environment and the gRPC payload actually running. For example, on the Google Kubernetes Engine (GKE) platform, developers can group/filter by namespace, container, and pod information fields to dig into more granular statistical data. With these metrics, Cloud Monitoring enables users to identify problems including:
Which container is having higher than normal latency
Which pod is having higher than normal error rates
And others.

Tracing
Microservices observability also allows developers to configure the sampling rate of RPCs. The sampling decision is propagated across the whole system, thus no matter where the RPCs actually happen, developers can always see a complete, end-to-end distributed trace for their processing logic. Sampled RPCs and any further RPCs triggered by them are displayed in Cloud Trace as parent/children spans.

Getting started
With Microservices observability, telemetry data (logs, metrics, traces) of gRPC workloads can be collected and reported to the Google Cloud operations suite. It helps developers get a better understanding of their systems and enables them to diagnose problems such as:
Which microservices have suddenly become abnormally slow (long processing latency on the server side)?
Which microservices suddenly process less QPS, and is there a pattern?
Whether there’s a potential network issue for a particular microservice, as high latency is measured on the client side, but normal latency on the server side? If so, can we locate the problem in a particular cluster, or even a particular node/pod?
To get started with Microservices observability, see our user guide.
