6 best practices for effective Cloud NAT monitoring
Edwin Chiu
Strategic Cloud Engineer
Ghaleb Al-Habian
Customer Engineer, Networking Specialist
For anyone building distributed applications, Cloud Network Address Translation (NAT) is a powerful tool: with it, Compute Engine and Google Kubernetes Engine (GKE) workloads can access internet resources in a scalable and secure manner, without exposing the workloads running on them to outside access using external IPs.
Cloud NAT features a proxy-less design, implementing NAT directly at the Andromeda SDN layer. As such, there’s no performance impact to your workload and it scales effortlessly to many VMs, regions and VPCs.
In addition, you can combine Cloud NAT with private GKE clusters, enabling secure containerized workloads that are isolated from the internet, but that can still interact with external API endpoints, download package updates, and engage in other use cases for internet egress access.
Pretty neat, but how do you get started? For example, monitoring is a crucial part of any infrastructure platform. When onboarding your workload onto Cloud NAT, we recommend that you monitor Cloud NAT to uncover any issues early on before it starts to impact your internet egress connectivity.
From our experience working with customers who use Cloud NAT, we’ve put together a few best practices for monitoring your deployment. We hope that following these best practices will help you use Cloud NAT effectively.
Best practice 1: Plan ahead for Cloud NAT capacity
Cloud NAT essentially works by “stretching” external IP addresses across many instances. It does so by dividing the available 64,512 source ports per external IP (equal to the possible 65,536 TCP/UDP ports minus the privileged first 1,024 ports) across all in-scope instances. Thus, depending on the number of external IP addresses allocated to the CloudNAT gateway, you should plan ahead for CloudNAT’s capacity in terms of ports and external IPs.
Whenever possible, try to use the CloudNAT external IP auto-allocation feature, which should be adequate for most standard use cases. Keep in mind that Cloud NAT’s limits and quotas, might limit you to using manually-allocated external IP addresses.
There are two important variables that dictate your CloudNAT capacity planning:
How many instances will utilize the CloudNAT gateway
How many ports you allocate per instance
The product of the two variables, divided by 64,512, gives you the number of external IP addresses to allocate to your Cloud NAT gateway:
The number of external IP addresses you come up with is important should you need to use manual allocation (it’s also important to keep track of in the event you exceed the limits of auto-allocation).
A useful metric to monitor your external IP capacity is the nat_allocation_failed NAT GW metric This metric should stay 0, denoting no failures. If this metric registers 1 or higher at any point, this indicates a failure, and that you should allocate more external IP addresses to your NAT gateway.
Best practice 2: Monitor port utilization
Port utilization is a very important metric to track. As detailed in the previous best practice, Cloud NAT’s primary resource is external IP:port pairs. If an instance reaches its maximum port utilization, its connections to the internet could be dropped (for a detailed explanation of what consumes Cloud NAT ports from your workloads, please see this this explanation).
Using Cloud Monitoring, you can use the following sample MQL query to check port utilization in Cloud NAT:
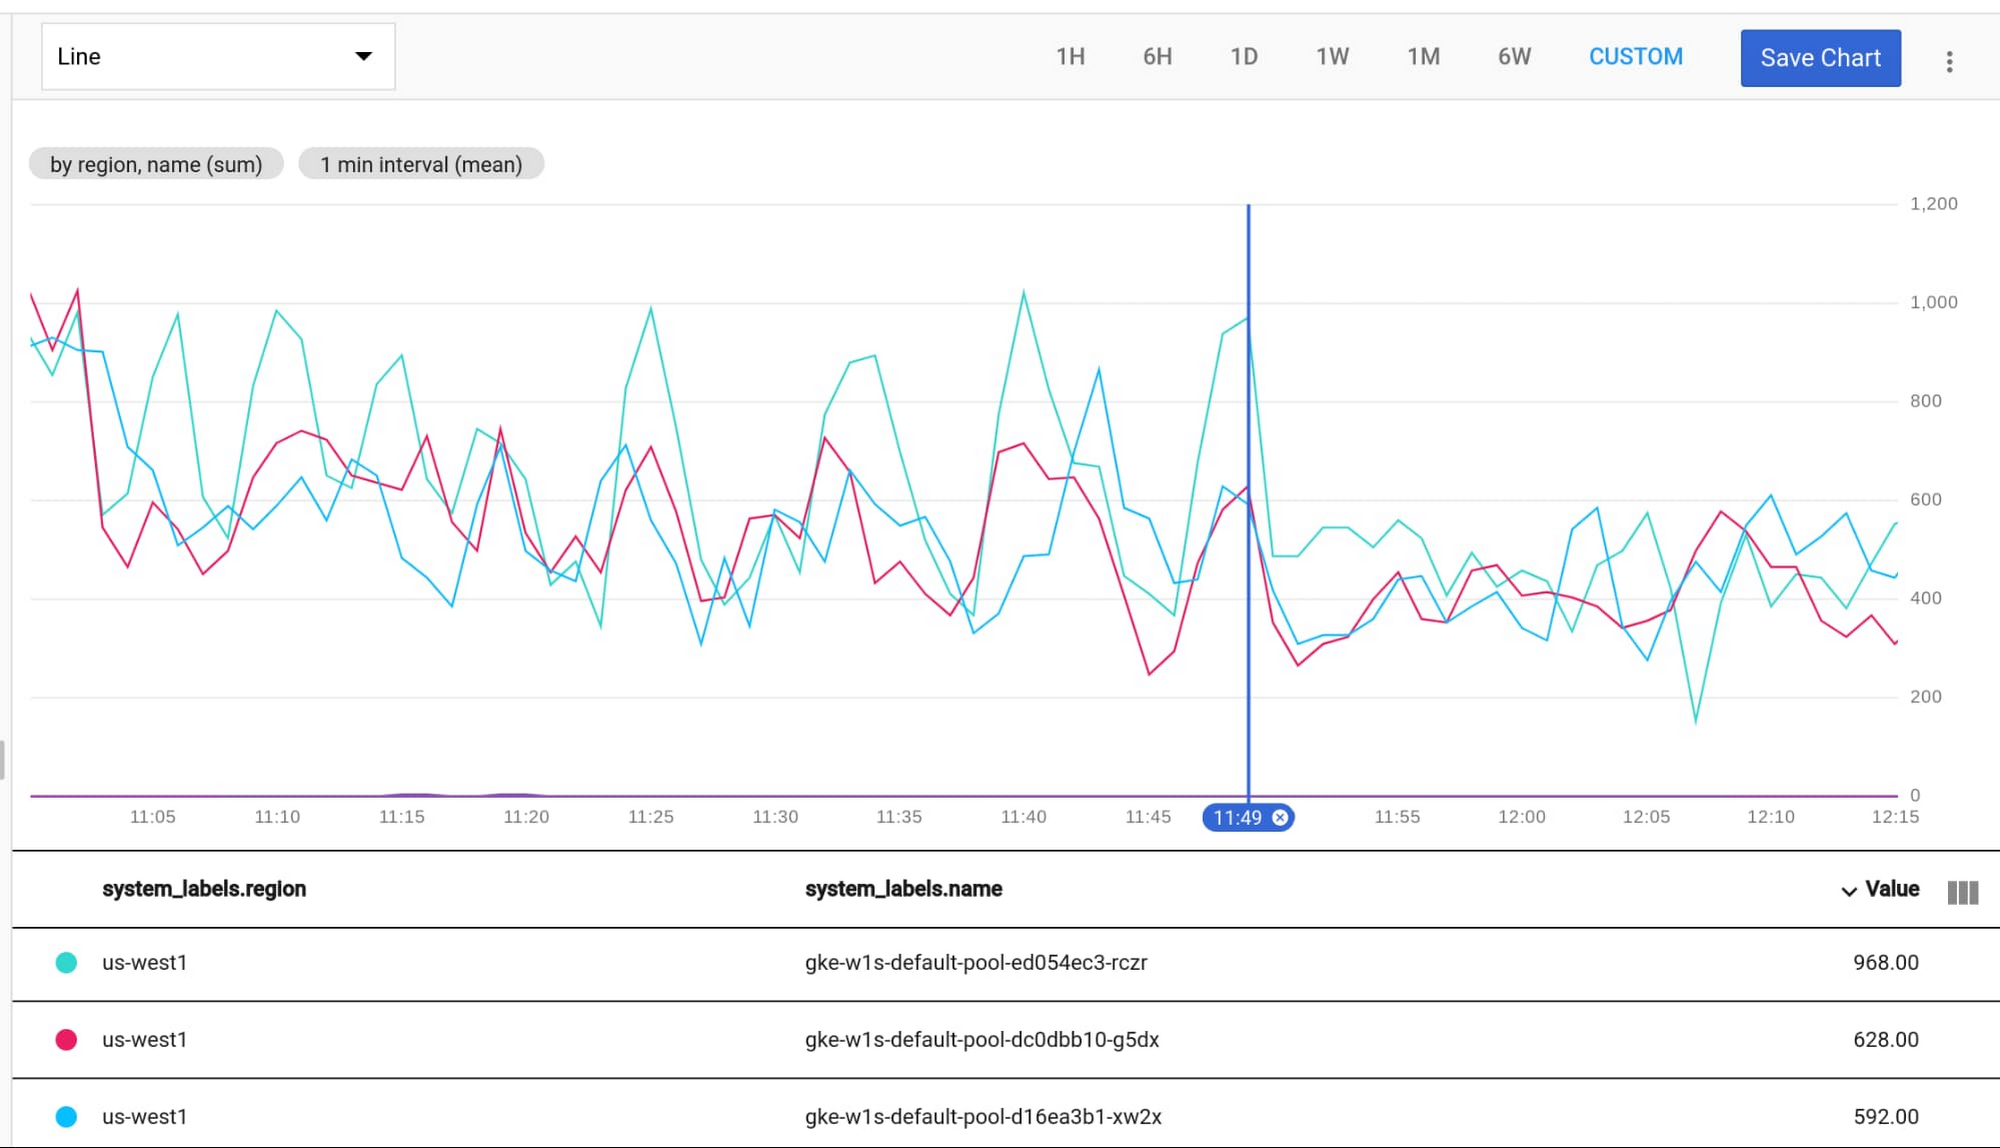
If the maximum port utilization is nearing your per-instance port allocation, it’s time to think about increasing the numbers of ports allocated per instance.
Best practice 3: Monitor the reasons behind Cloud NAT drops
In certain scenarios, Cloud NAT might fail to allocate a source port for a connection. The most common of these scenarios is that your instance has run out of ports. This shows up as “OUT_OF_RESOURCES” drops in the dropped_sent_packets_count metric. You can address these drops by increasing the numbers of ports allocated per instance.
The other scenario is endpoint independence drops, when Cloud NAT is unable to allocate a source port due to endpoint independence enforcement. This shows up as “ENDPOINT_INDEPENDENCE_CONFLICT” drops.
To keep track of these drops, you can add the following MQL query to your Cloud Monitoring dashboard.
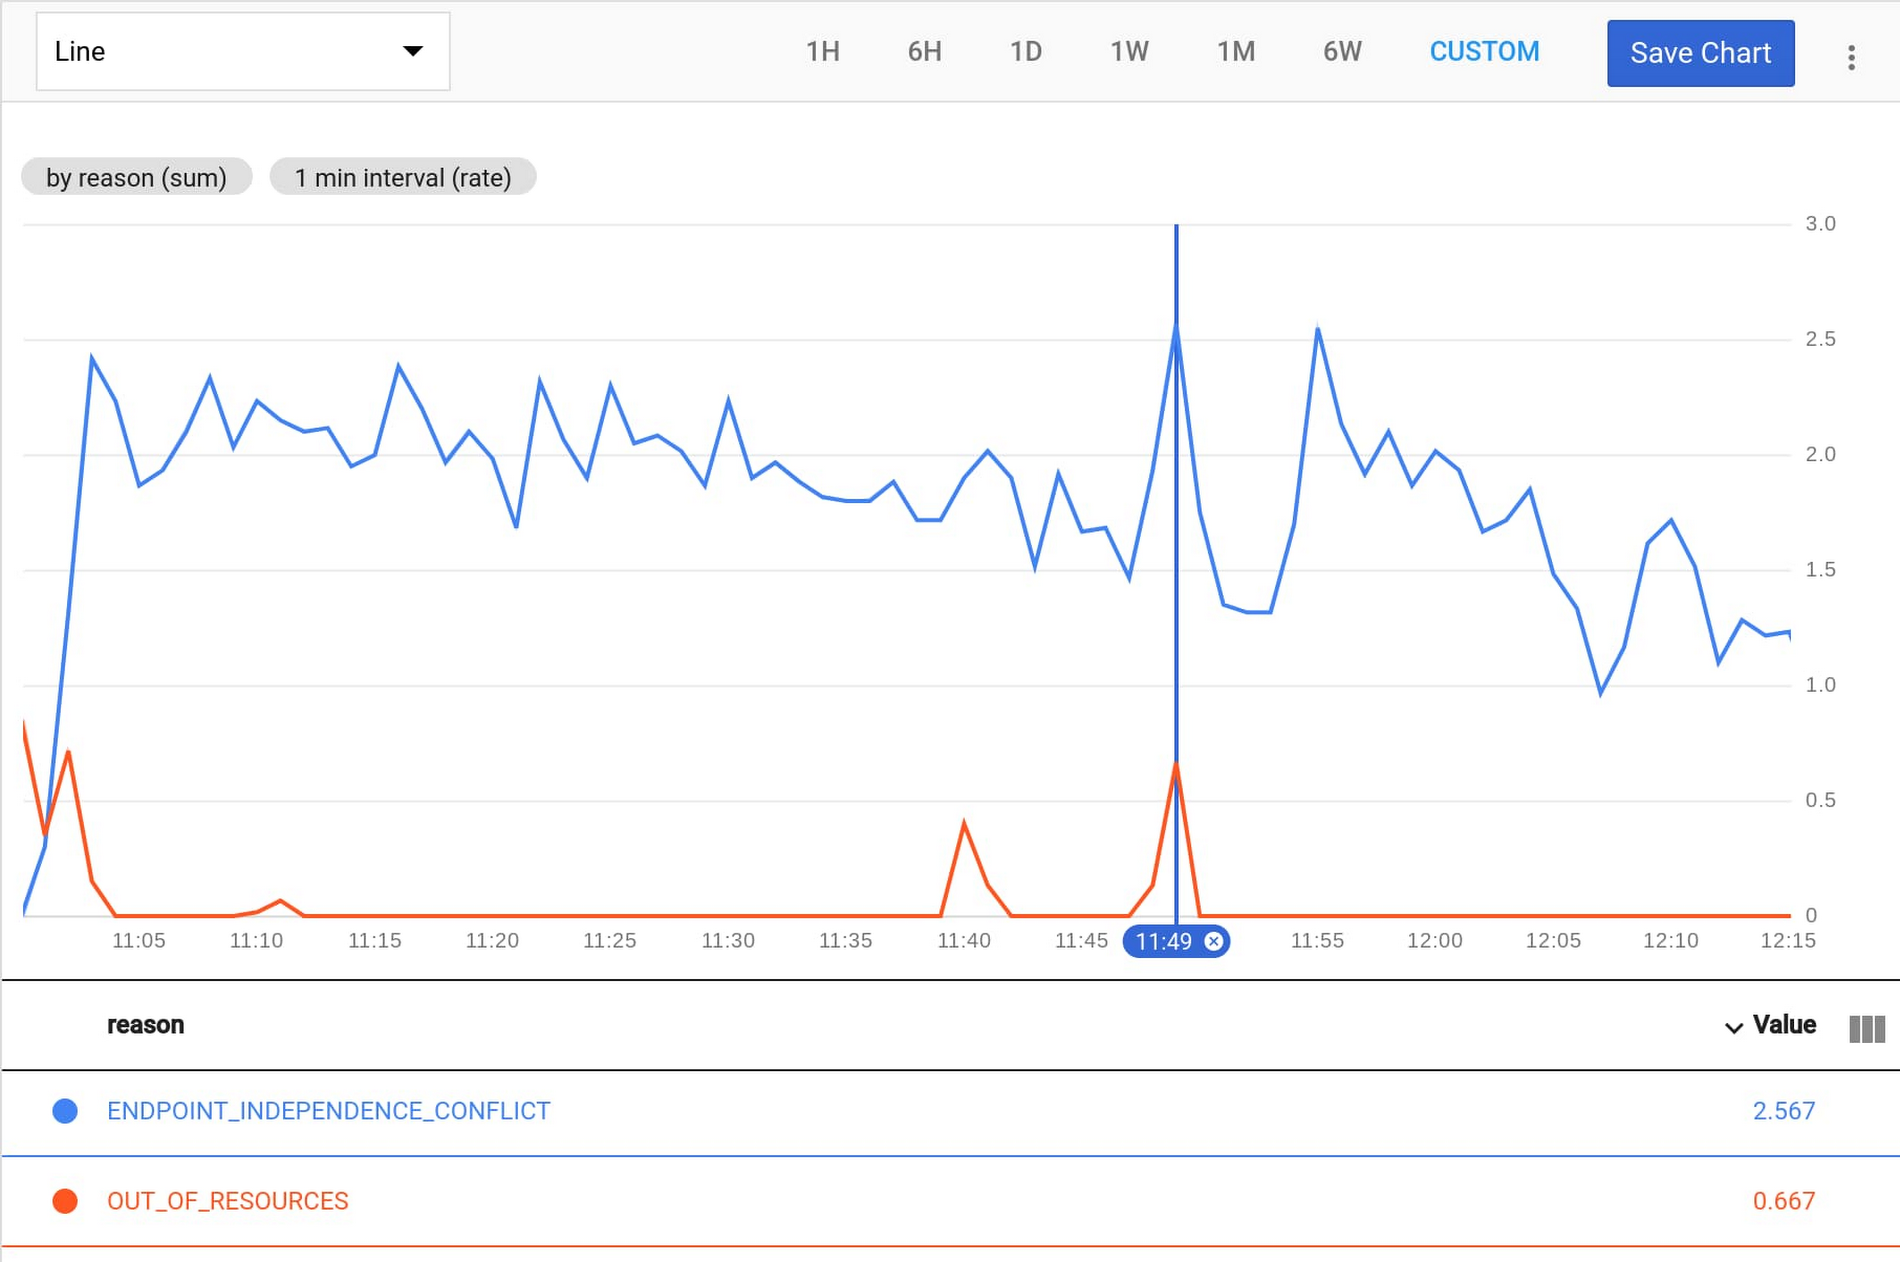
If you have an increasing number of drops of type “ENDPOINT_INDEPENDENCE_CONFLICT”, consider turning off Endpoint-Independent Mapping, or try one of these techniques to reduce their incidence.
Best practice 4: Enable Cloud NAT logging and leverage log-based metrics
Enabling Cloud Logging for Cloud NAT lets you proactively detect issues as well as provides additional context for troubleshooting. Please see these instructions to learn how to enable logging.
Once you have enabled logging, you can create powerful metrics with these logs by creating log-based metrics.
For example, use the following command and YAML definition file to expose NAT allocation events as metrics grouped by source/destination, ip/port/protocol as well as gateway name. We will explore ways to use these metrics in the next best practice.
metric.yaml
Best practice 5: Monitor top endpoints and their drops
Both types of Cloud NAT drops (“ENDPOINT_INDEPENDENCE_CONFLICT” and “OUT_OF_RESOURCES”) are exacerbated by having many parallel connections to the same external IP:port pair. A very useful troubleshooting tool is to identify which of these endpoints are causing more drops than usual.
To expose this data, you can use the log-based metric discussed in the previous best practice. The following MQL query graphs the top destination IP and ports causing drops.
Here’s an example of a resulting graph:
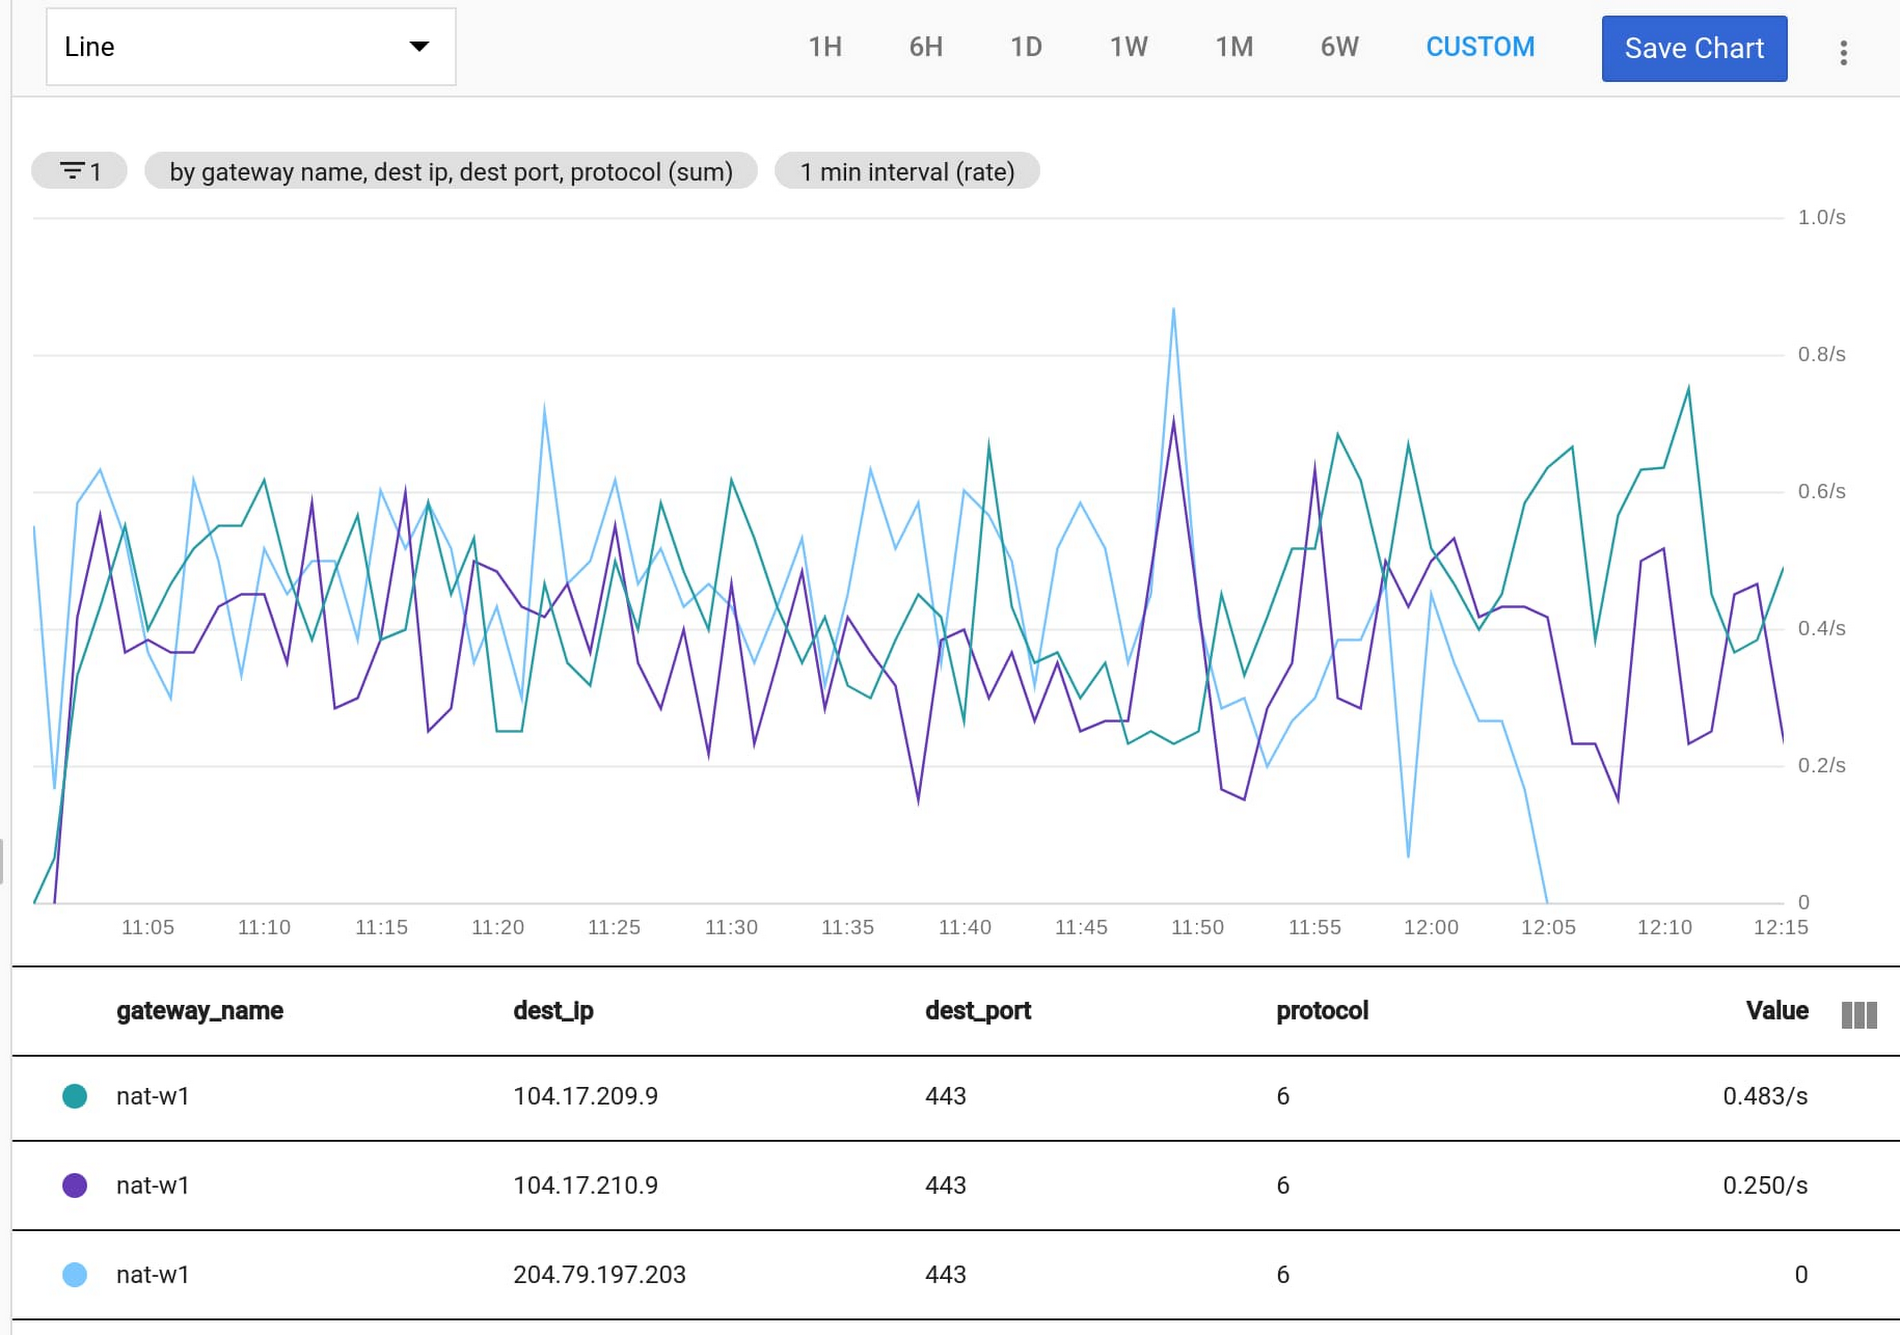
What should you do with this information? Ideally you would try to spread out connections to these concentrated endpoints across as many instances as possible.
Failing that, another mitigation step could be to route traffic to these endpoints through a different Cloud NAT gateway by placing it in a different subnet and associating it with a different gateway (with more port allocations per instance).
Finally, you can mitigate these kinds of Cloud NAT drops by handling this kind of traffic through instances that attach external IPs.
Please note that if you’re using GKE, ip-masq-agent can be tweaked to disable Source NATing traffic to only to certain IPs which will reduce the probability of a conflict.
Best practice 6: Baseline a normalized error rate
All the metrics we’ve covered so far show absolute numbers that may or may not be meaningful to your environment. Depending on your traffic patterns, 1000 drops per second could be a cause for concern or could be entirely insignificant.
Given your traffic patterns, some level of drops might be a normal occurrence that don’t impact your users’ experience. This is especially relevant for endpoint independence drops incidents, which can be random and rare.
Leveraging the same log-based metric created in best practice 4, you can normalize the numbers by the total number of port allocations using the following MQL query:

Normalizing your drop metrics help you account for traffic level scaling in your drop numbers. It can also baseline “normal” levels of drops and make it easier to detect abnormal levels of drops when they happen.
Monitor Cloud NAT FTW
Using Cloud NAT lets you build distributed, hybrid and multi-cloud applications without exposing them to the risk of outside access from external IPs. Follow these best practices for a worry-free Cloud NAT experience; keeping your pager silent and your packets flowing. To learn more, check out our Cloud NAT overview, review all Cloud NAT logging and metrics options, or take Cloud NAT for a spin in our Compute Engine and GKE tutorials!