Using Stackdriver Workspaces to help manage your hybrid and multicloud environment

Mary Koes
Product Manager, Google Cloud
Charles Baer
Product Manager, Google Cloud
At Google, we believe strongly in an open cloud. We’re continually working to bring you tools for understanding how your applications are performing, whether they run in different projects, organizations, clouds, or even on prem. Monitoring tools like Stackdriver Kubernetes Monitoring, OpenCensus, and Stackdriver APM are designed to help you get visibility into your workloads wherever they run—on Google Cloud Platform (GCP), on-premises or on another cloud platform. But organizing and making sense out of the data from all these sources can be a real challenge, especially with a modern distributed microservices architecture.
That’s why we’re announcing Stackdriver Workspaces, which we’ve renamed from “Stackdriver Accounts” to better reflect their purpose: a place for you to organize all the Stackdriver resources you care about in ways that match your needs. You can access Workspaces now through Stackdriver Monitoring.
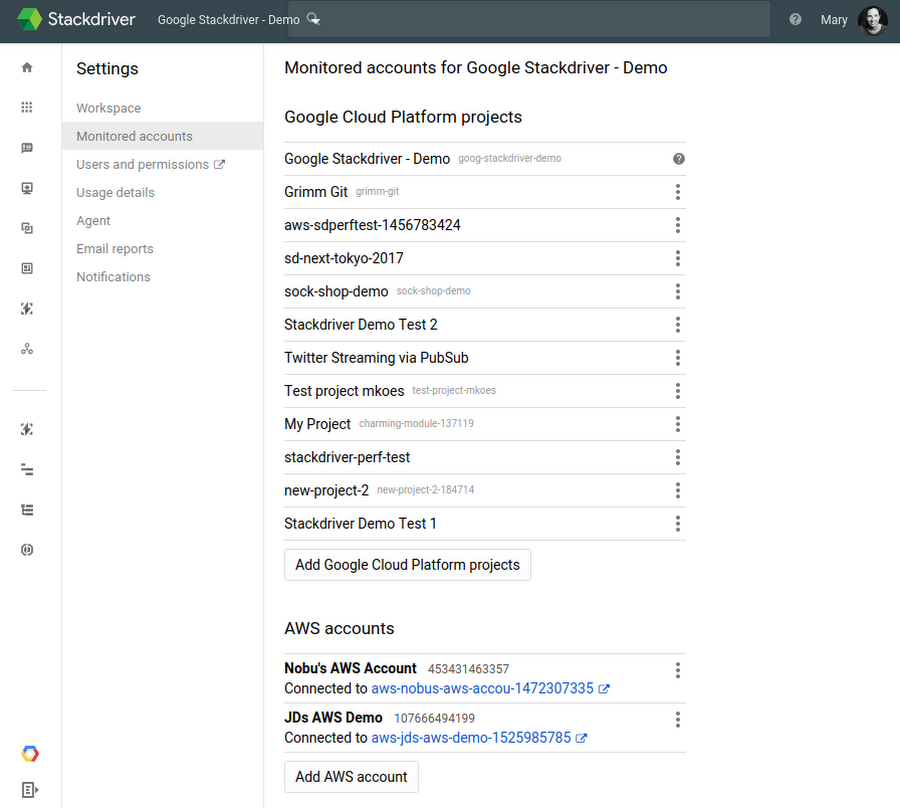
Workspaces can track your existing GCP projects, which form the basis for managing permissions and resources within GCP, as well as any Amazon Web Services (AWS) accounts that you want to monitor. Many of our users define an organization in GCP that includes many projects and AWS accounts. For example, suppose your site reliability engineering (SRE) team is responsible for managing an application that’s split across a dozen different projects in GCP as well as some legacy code running in a couple of AWS accounts. You can set up a Stackdriver Workspace to monitor all the resources in your GCP projects and AWS accounts without having to grant access to each individual project/account. Within a Workspace, you can use Stackdriver Groups to organize a subset of the resources your team cares about, such as one microservice. Users within a Workspace all have common view permissions, so that everyone on the team collaborating on an application’s dashboard or debugging an incident generated from an alerting policy will have the same view. You can see here what this common view might look like:

Organizing Workspaces
There are three common scenarios to organize access to Workspaces that we consistently hear about from our customers:
by team function
by organization
by environment
Let’s talk about each of them in turn.
Organizing Workspaces by team function
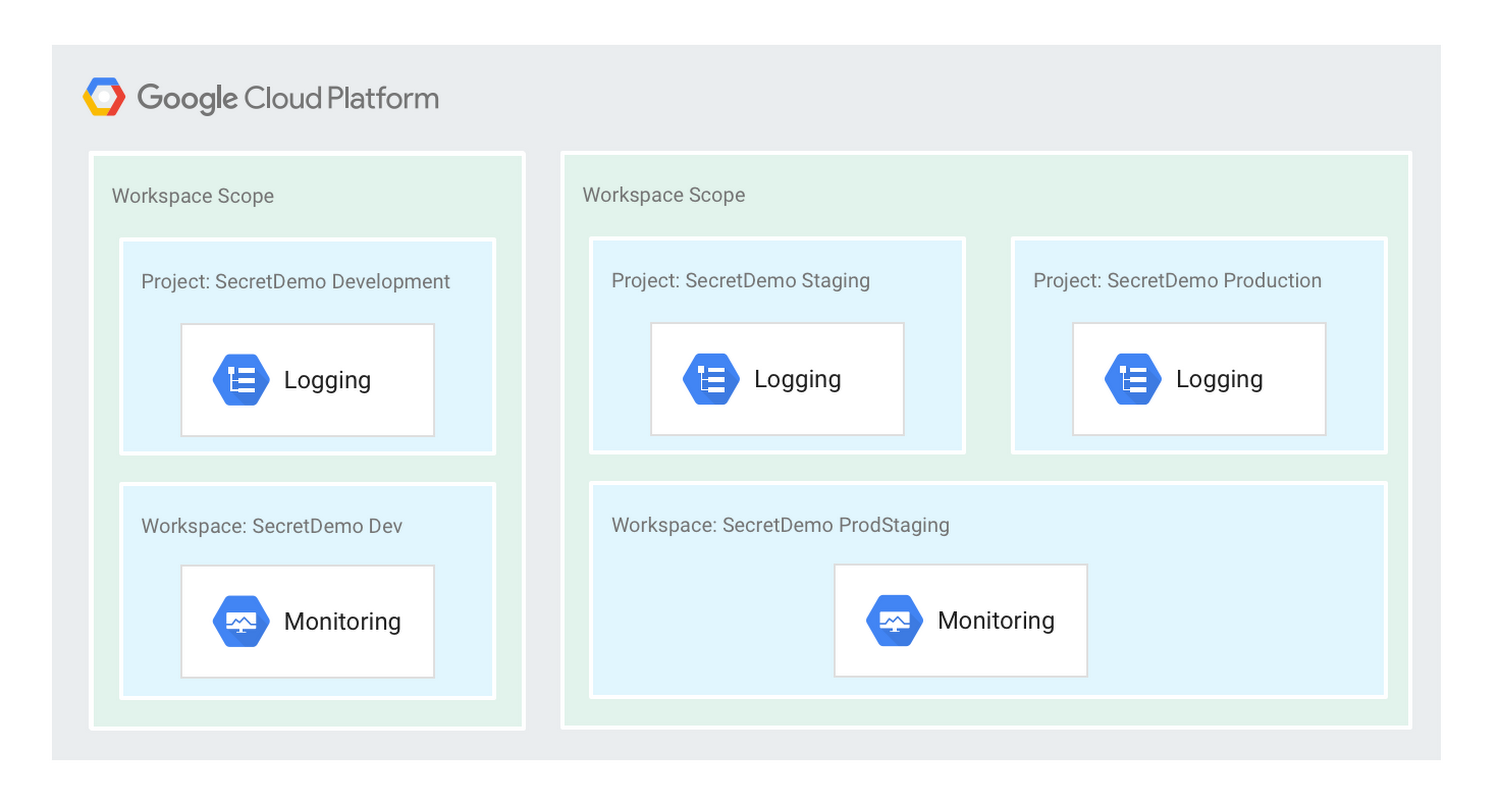
Providing monitoring access based on team function means that separate teams, such as testing and operations, may each have a separate Workspace to monitor environments. You can assign projects to separate Workspaces based on team function. For example, the SecretDemo team uses two different workspaces, one for the development team and another for the operations teams. The development team has access to the SecretDemoDev workspace and the operations team has access to the SecretDemo Staging and Production environments, as shown here:

Organizing Workspaces by organization
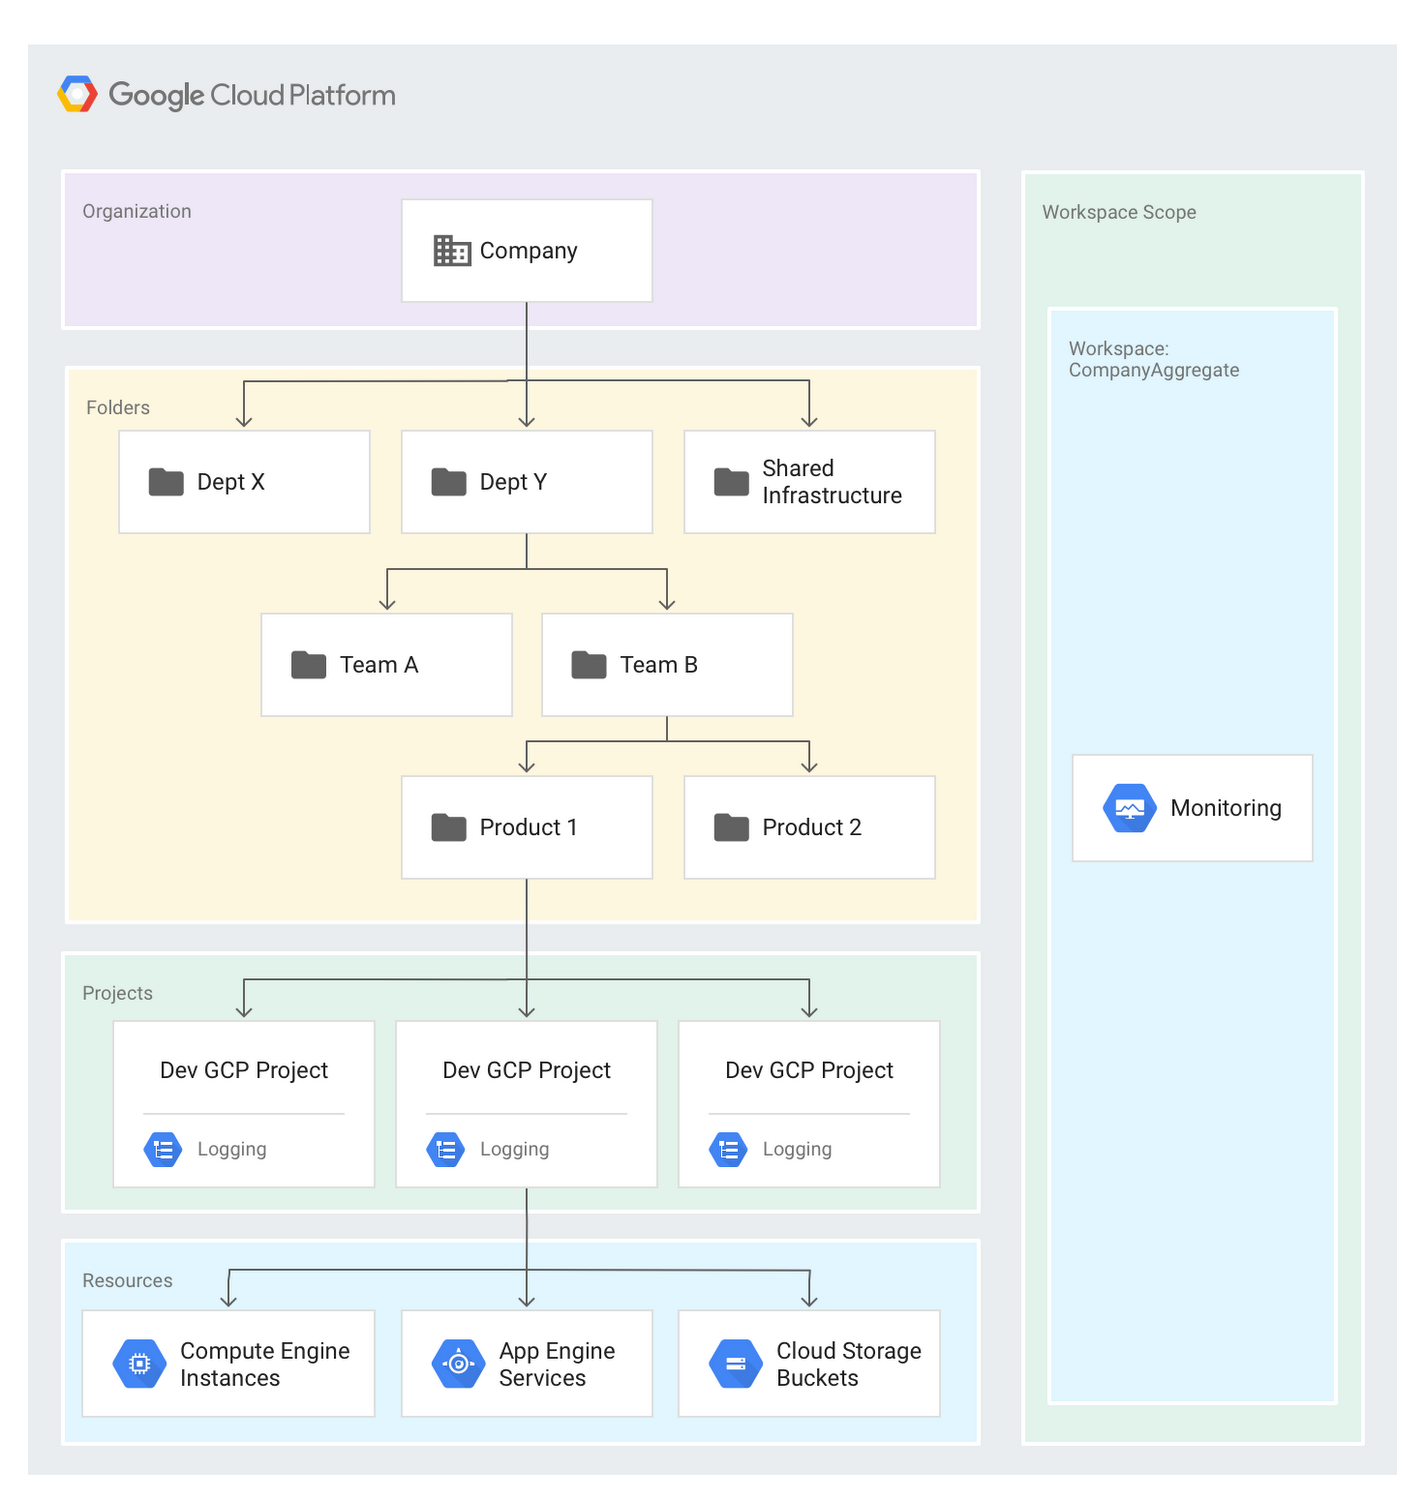
Centralized logging and monitoring is another common requirement that we hear about from our customers. In this case, customers use a GCP organization (the root node of the GCP resource manager hierarchy) and a single Workspace to monitor all projects within that organization. This approach provides a single Workspace to aggregate, filter and alert on all the monitoring metrics, as shown here:

Organizing Workspaces by environment
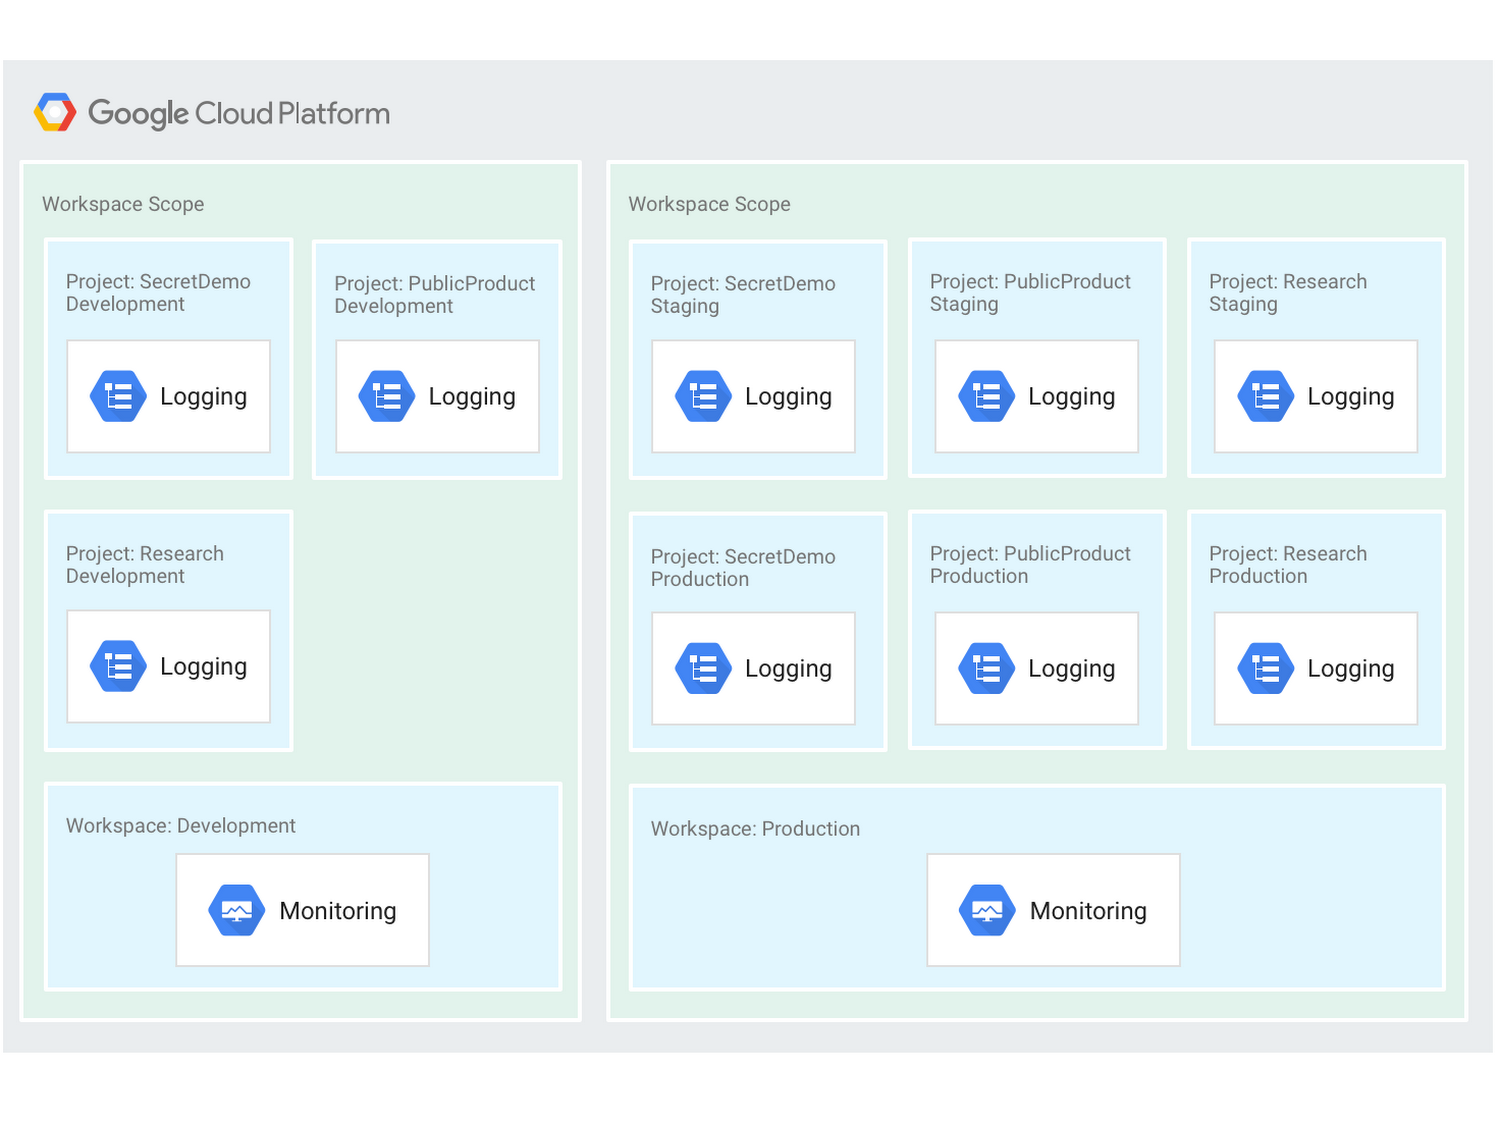
Organizing by environment means that Workspaces are aligned to environments such as development, staging, and production. In this case, projects are included in separate Workspaces based on their function in the environment. For example, splitting the projects along development and staging/production environments would result in two Workspaces: one for development and one for staging/production, as shown here:

Stackdriver Groups
Stackdriver Groups can also help you organize your GCP resources. While Workspaces allow you to organize which projects to monitor, our Groups tool provides a way to organize groups of resources such as virtual machine (VM) instances, databases, and load balancers inside a Workspace so that you can monitor them as a single entity. Groups can be based on names, tags, regions, applications, and other criteria.
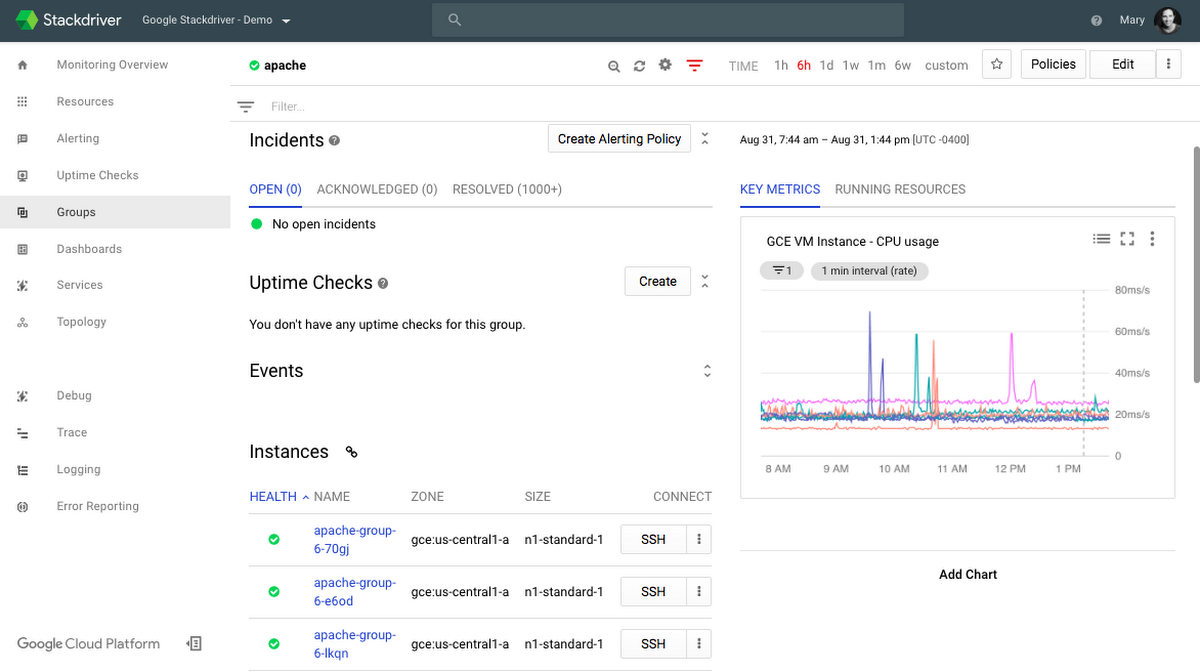
In the example at the start, we had a single Workspace that included 12 GCP projects and two AWS accounts for centralized monitoring by the SRE team. We could use Groups to logically group applications, resources in our infrastructure, or specific environments. For example, the team responsible for the front-end application running on VMs using Apache across GCP and AWS might want to monitor the health of their service. We could define a Group that consists just of the resources within that microservice. Defining a Group with “Name starts with Apache” would automatically create a dashboard, shown below, that includes just the group’s members, making it easy to track the health of that front-end application across both clouds.

Used together, Stackdriver Groups and Workspaces provide flexibility to choose your monitoring scope and quickly assess the health of all the services you care about.
