Announcing Log Analytics charts and dashboards in Cloud Logging in public preview
Charles Baer
Product Manager, Google Cloud
At Google Cloud, we know that developer time is precious. Finding insight from logs can be critical for troubleshooting problems, optimizing performance, and making informed decisions about your cloud infrastructure.
Today, we’re pleased to announce integrated Log Analytics charts in Cloud Logging and the ability to save your charts to a dashboard in Cloud Monitoring – both available now in preview.
With this launch, you can now create a chart for your Log Analytics query results and then save that chart to a Cloud Monitoring dashboard.
Here are a few examples to get you started.
Troubleshooting
Log Analytics can help resolve issues more quickly both through dashboards and ad hoc queries. Cloud Logging collects application logs from GCP services including Google Kubernetes Engine (GKE) by default. When something goes wrong, it’s critical to find the root cause and resolve the issue quickly.
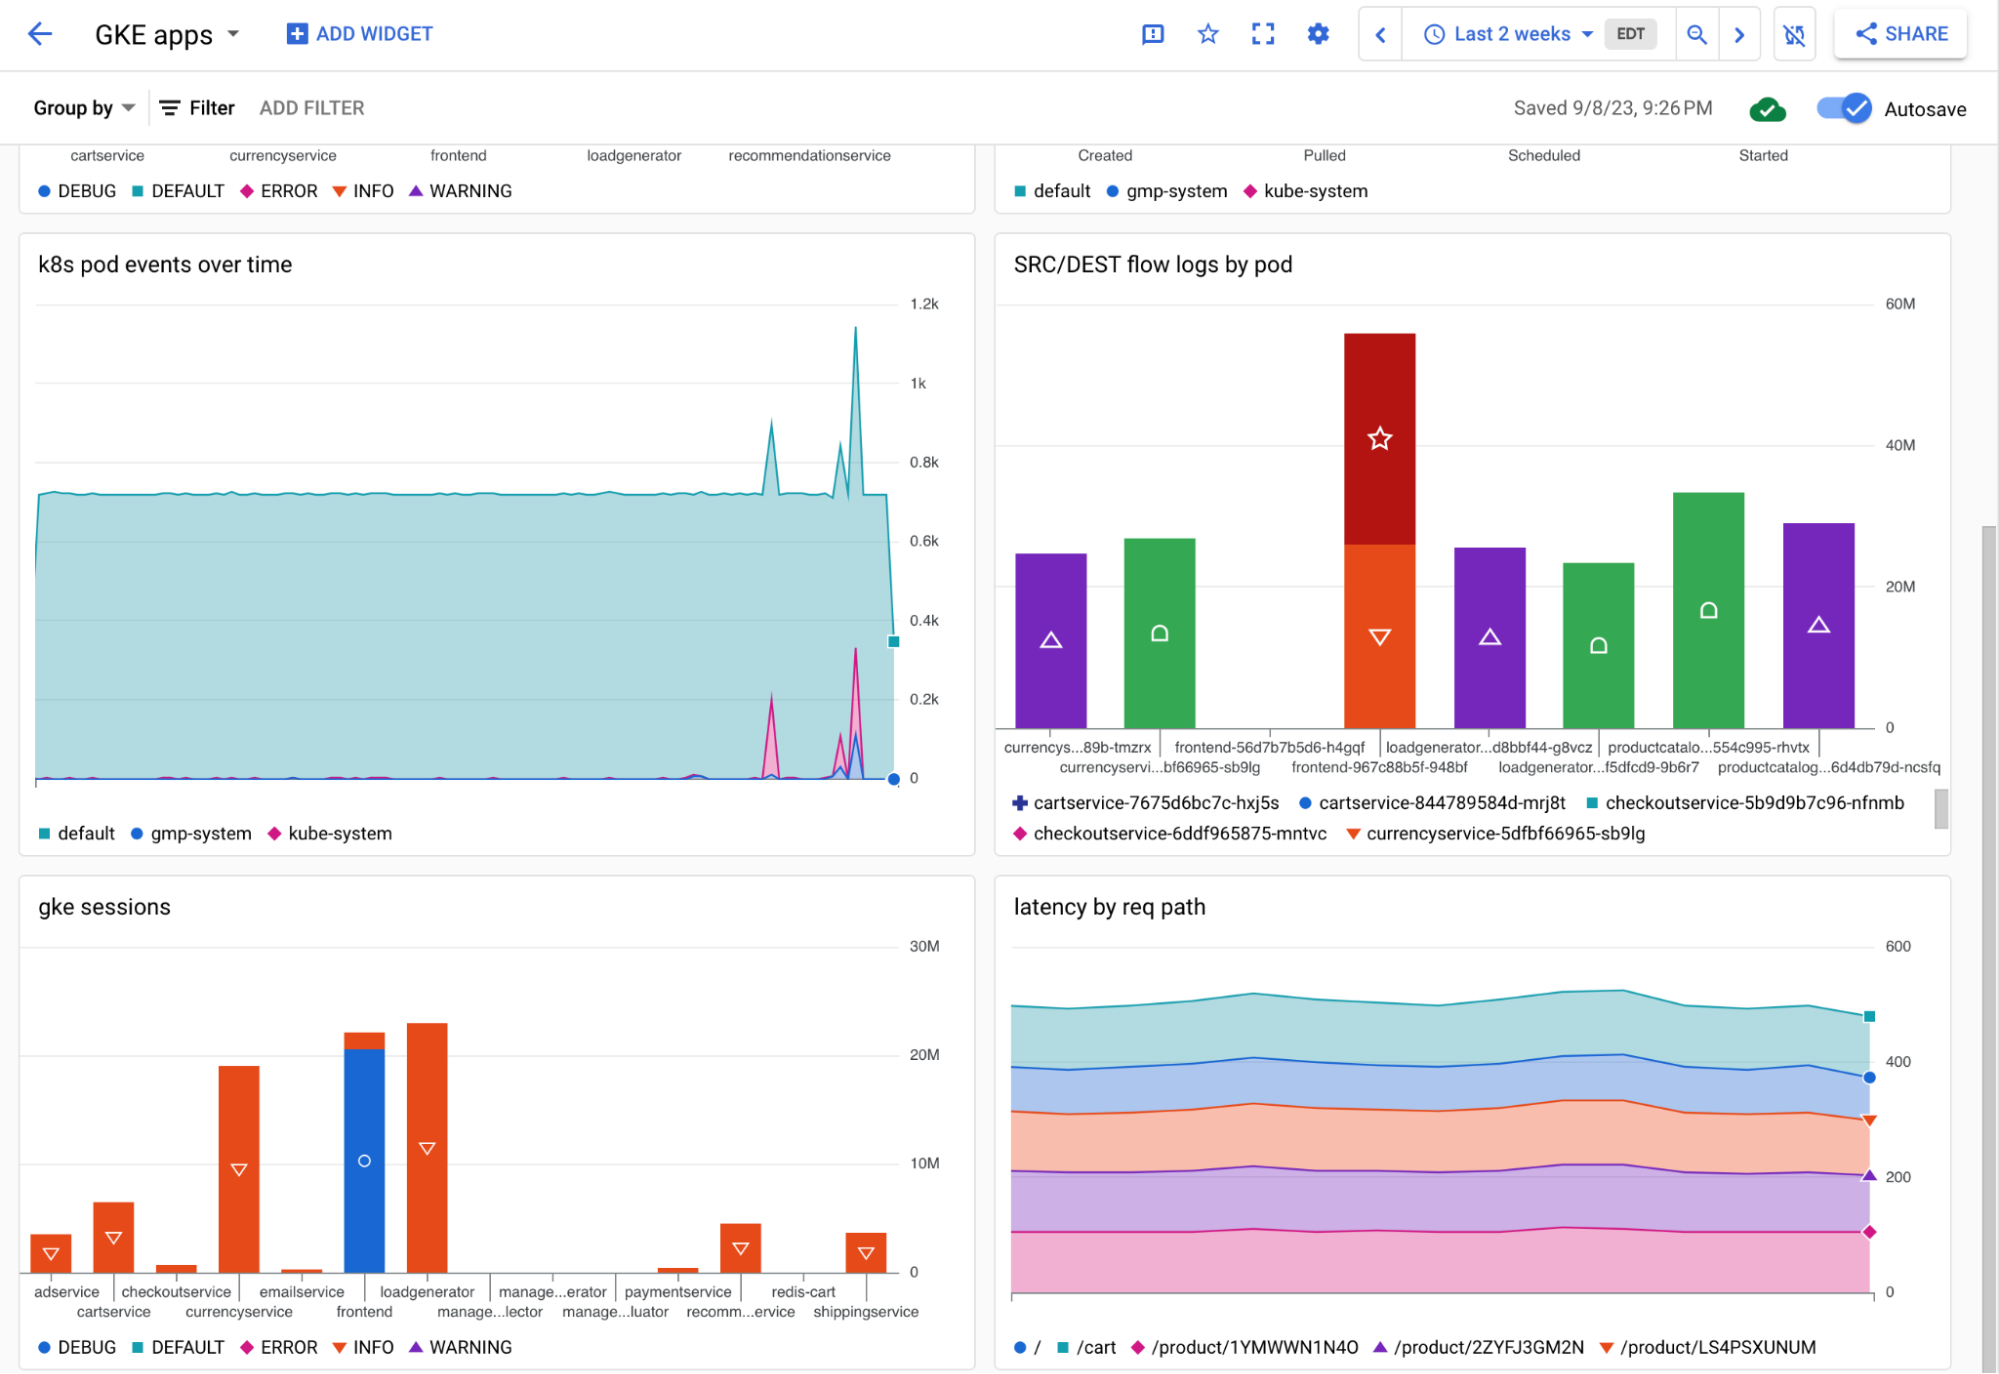
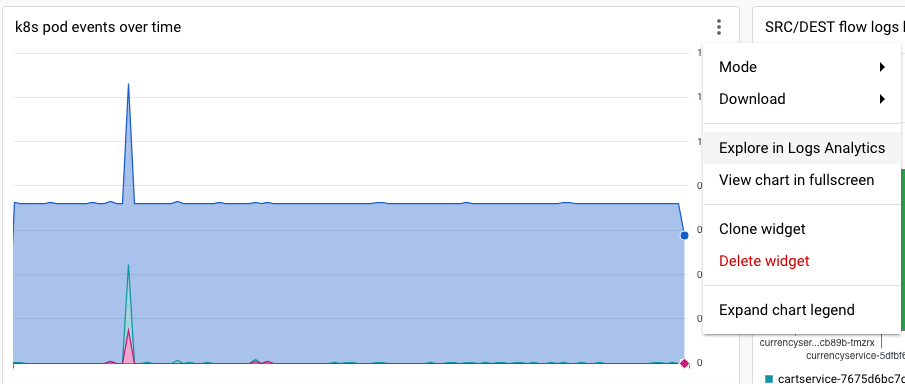
The dashboard below provides four different Log Analytics charts relevant monitoring and troubleshooting an application. In all four of the charts, you can clearly see that an event occurred which caused a spike in volume, errors and latency along with a corresponding decrease in availability.
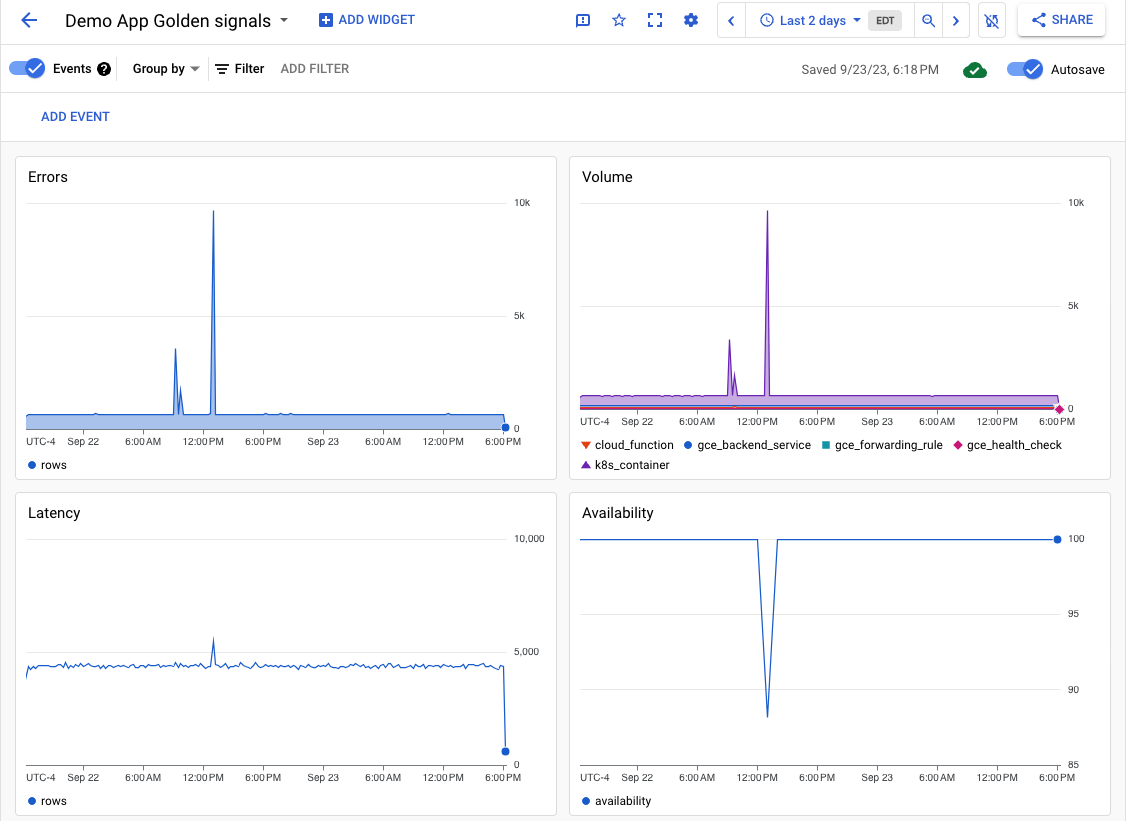
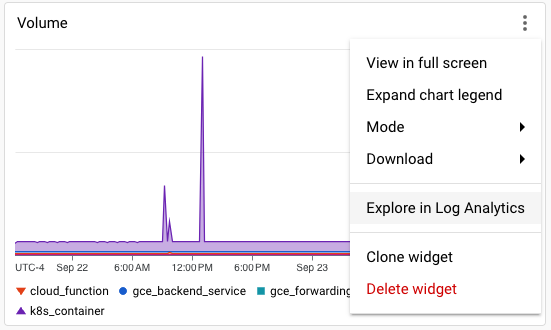
To dig into the issue, you can click the 3-dot menu and Explore in Log Analytics which will open the chart in the Log Analytics page.
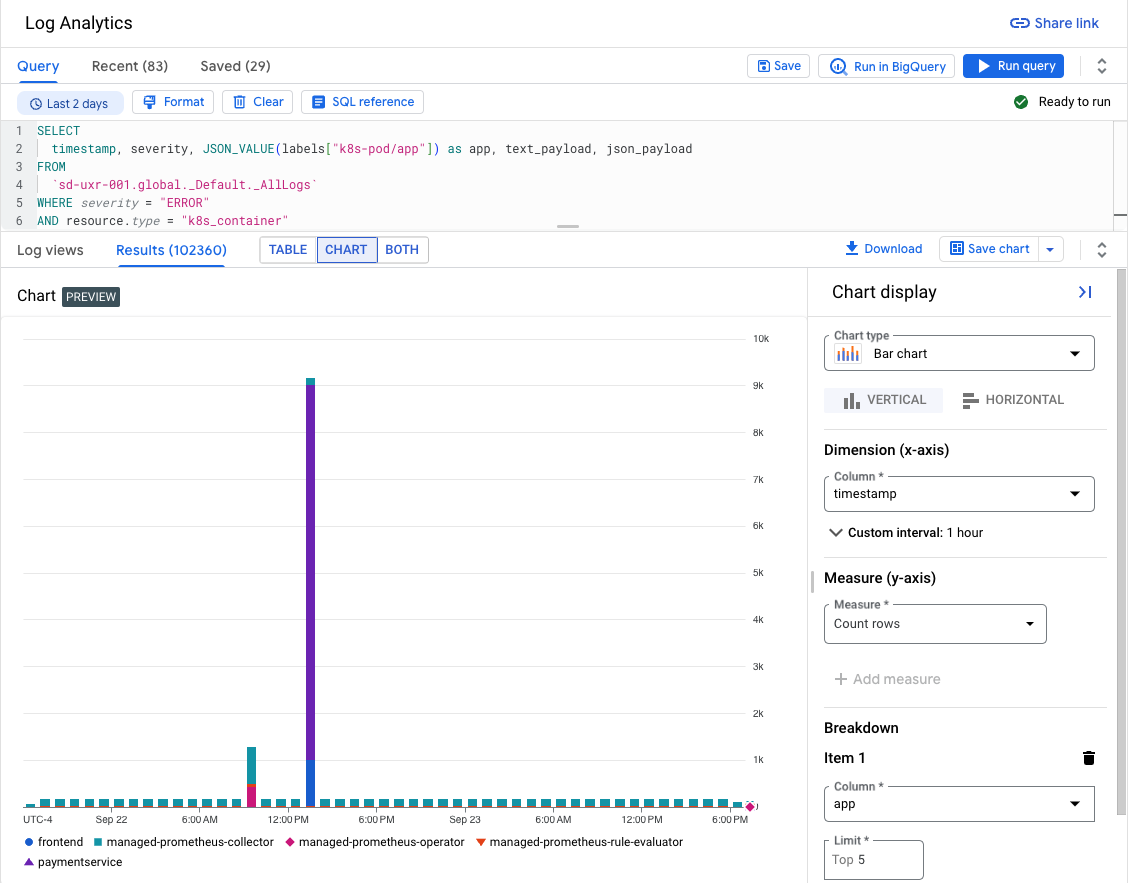
From here, you can see that it’s the container type generating the log volume and then refine the query to identify the service. In this case, by grouping by the Google Kubernetes Enging (GKE) label, it’s easy to tell that the frontend and payment service are the services generating the most errors. Armed with this information, you can investigate the details of the logs for the services in Logs Explorer and move to the root-cause phase of troubleshooting.
Audit logs example
Cloud Audit logs provide detailed information about events happening in your cloud environment, and more specifically, data access logs provide details about usage of cloud resources such as Cloud Storage buckets. Audit logs are useful both for troubleshooting access issues and to understand what’s happening in your projects.
Log Analytics provides a way to analyze data access logs over time or grouped in other useful ways. For example, if you need to understand which users are accessing Cloud Storage buckets as a part of an incident, Log Analytics can help you find all the user access.
The results are returned as a table.
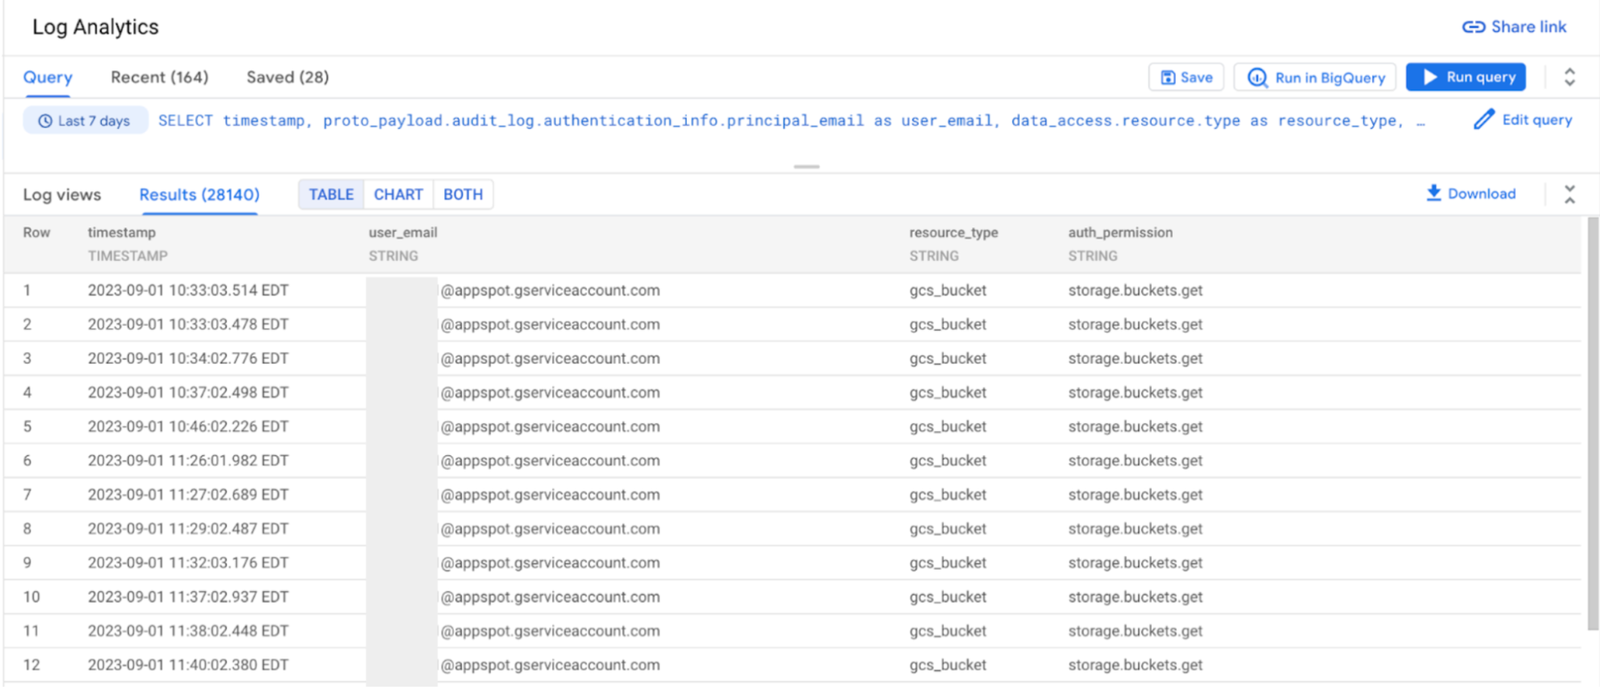
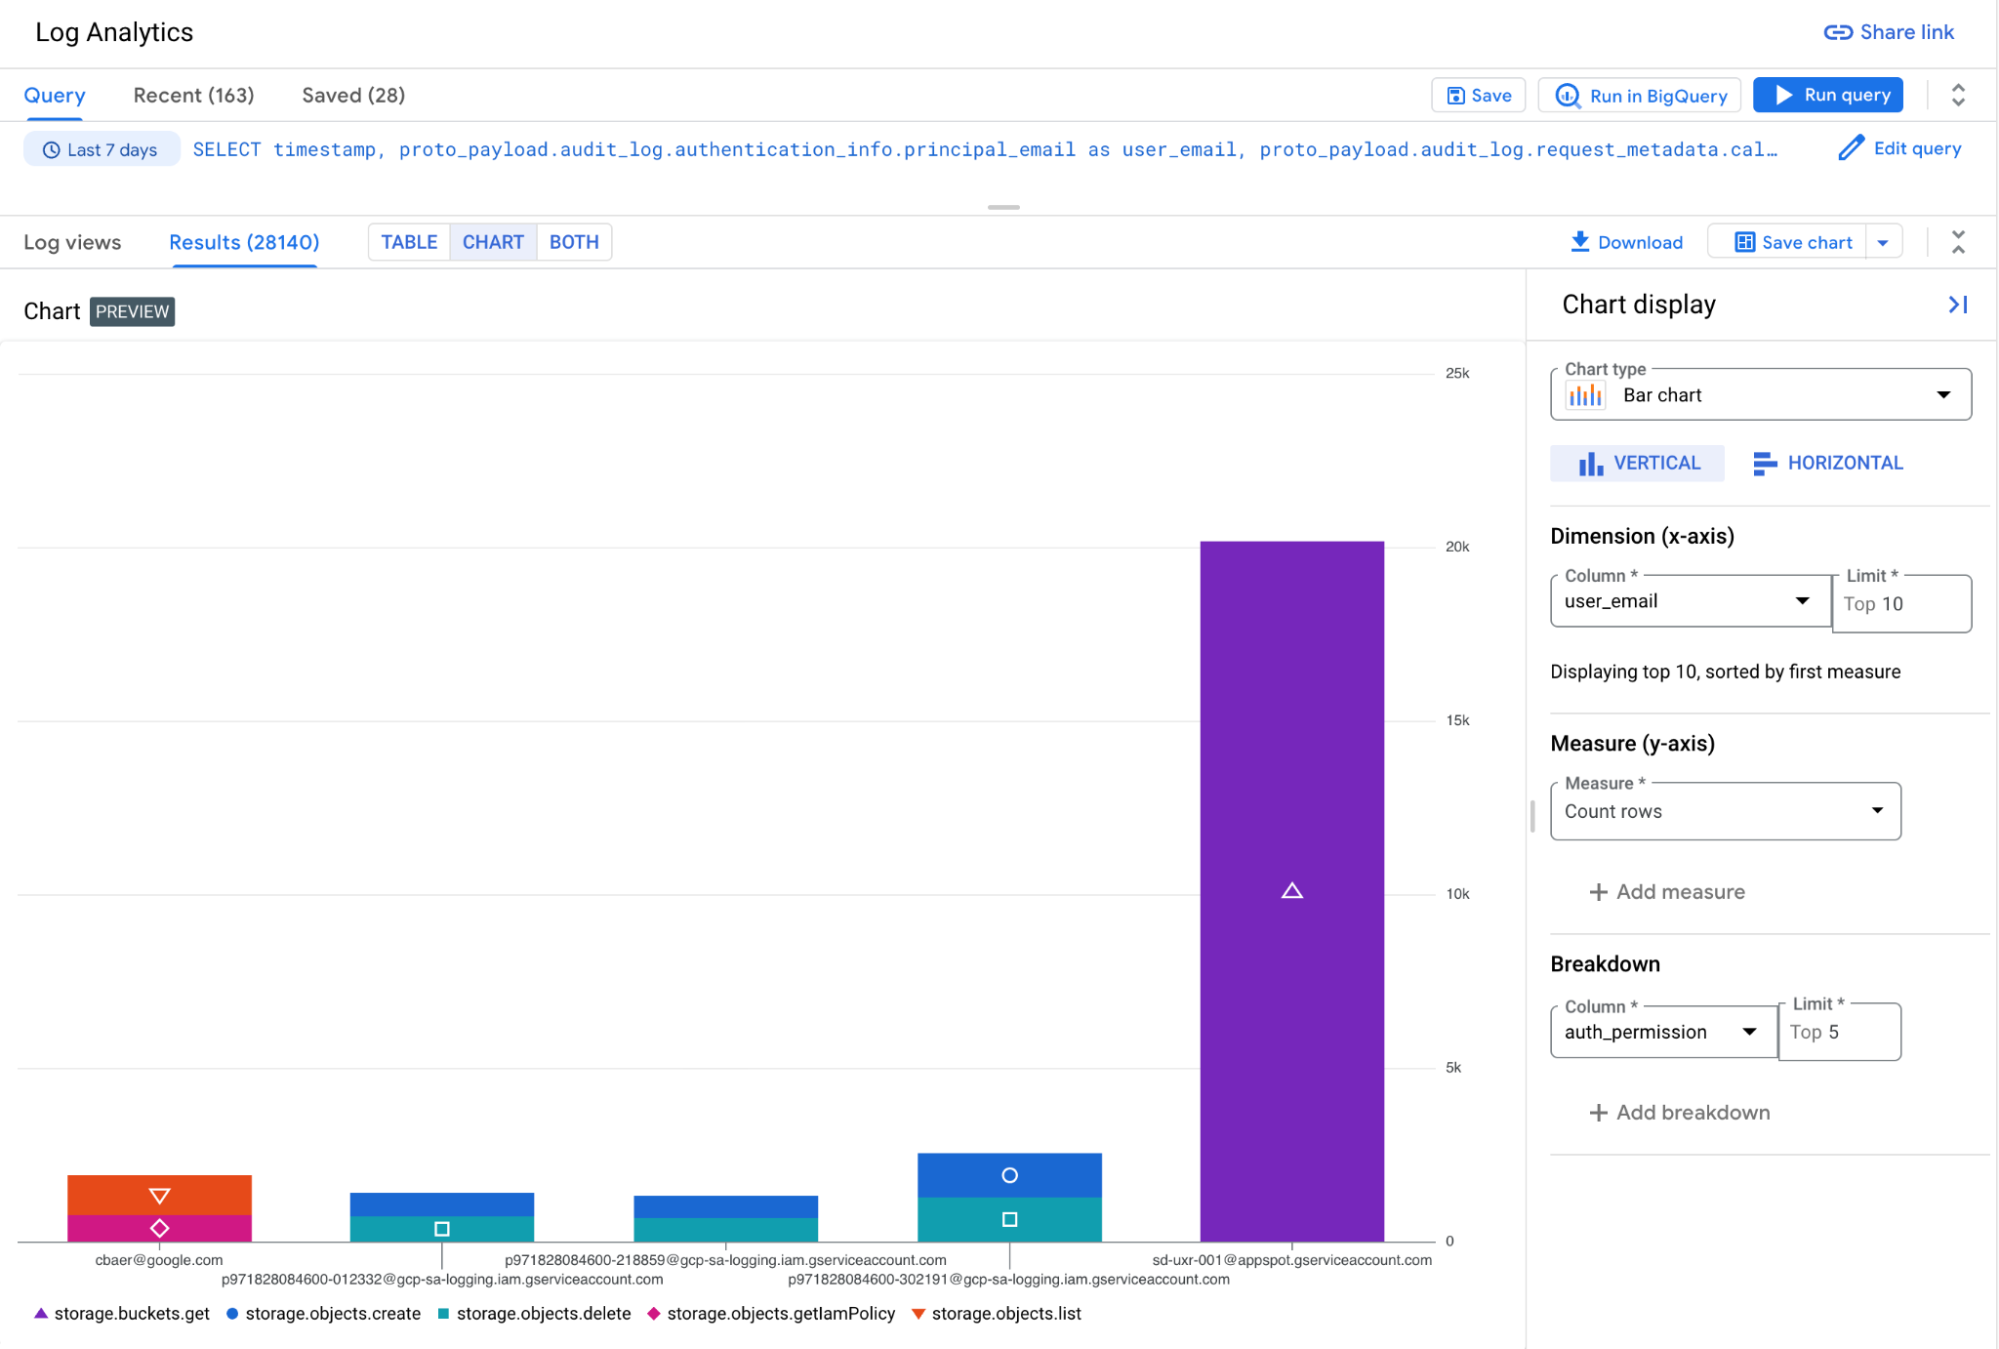
Switching to the chart mode makes it very easy to see the users with the most access. Using the auth_permission field in the breakdown option shows the permissions for each user, making it easy to see which users accessed the most Cloud Storage objects. In this case, most of the access is from an App Engine app user, though there are individual users who have access logs as well.
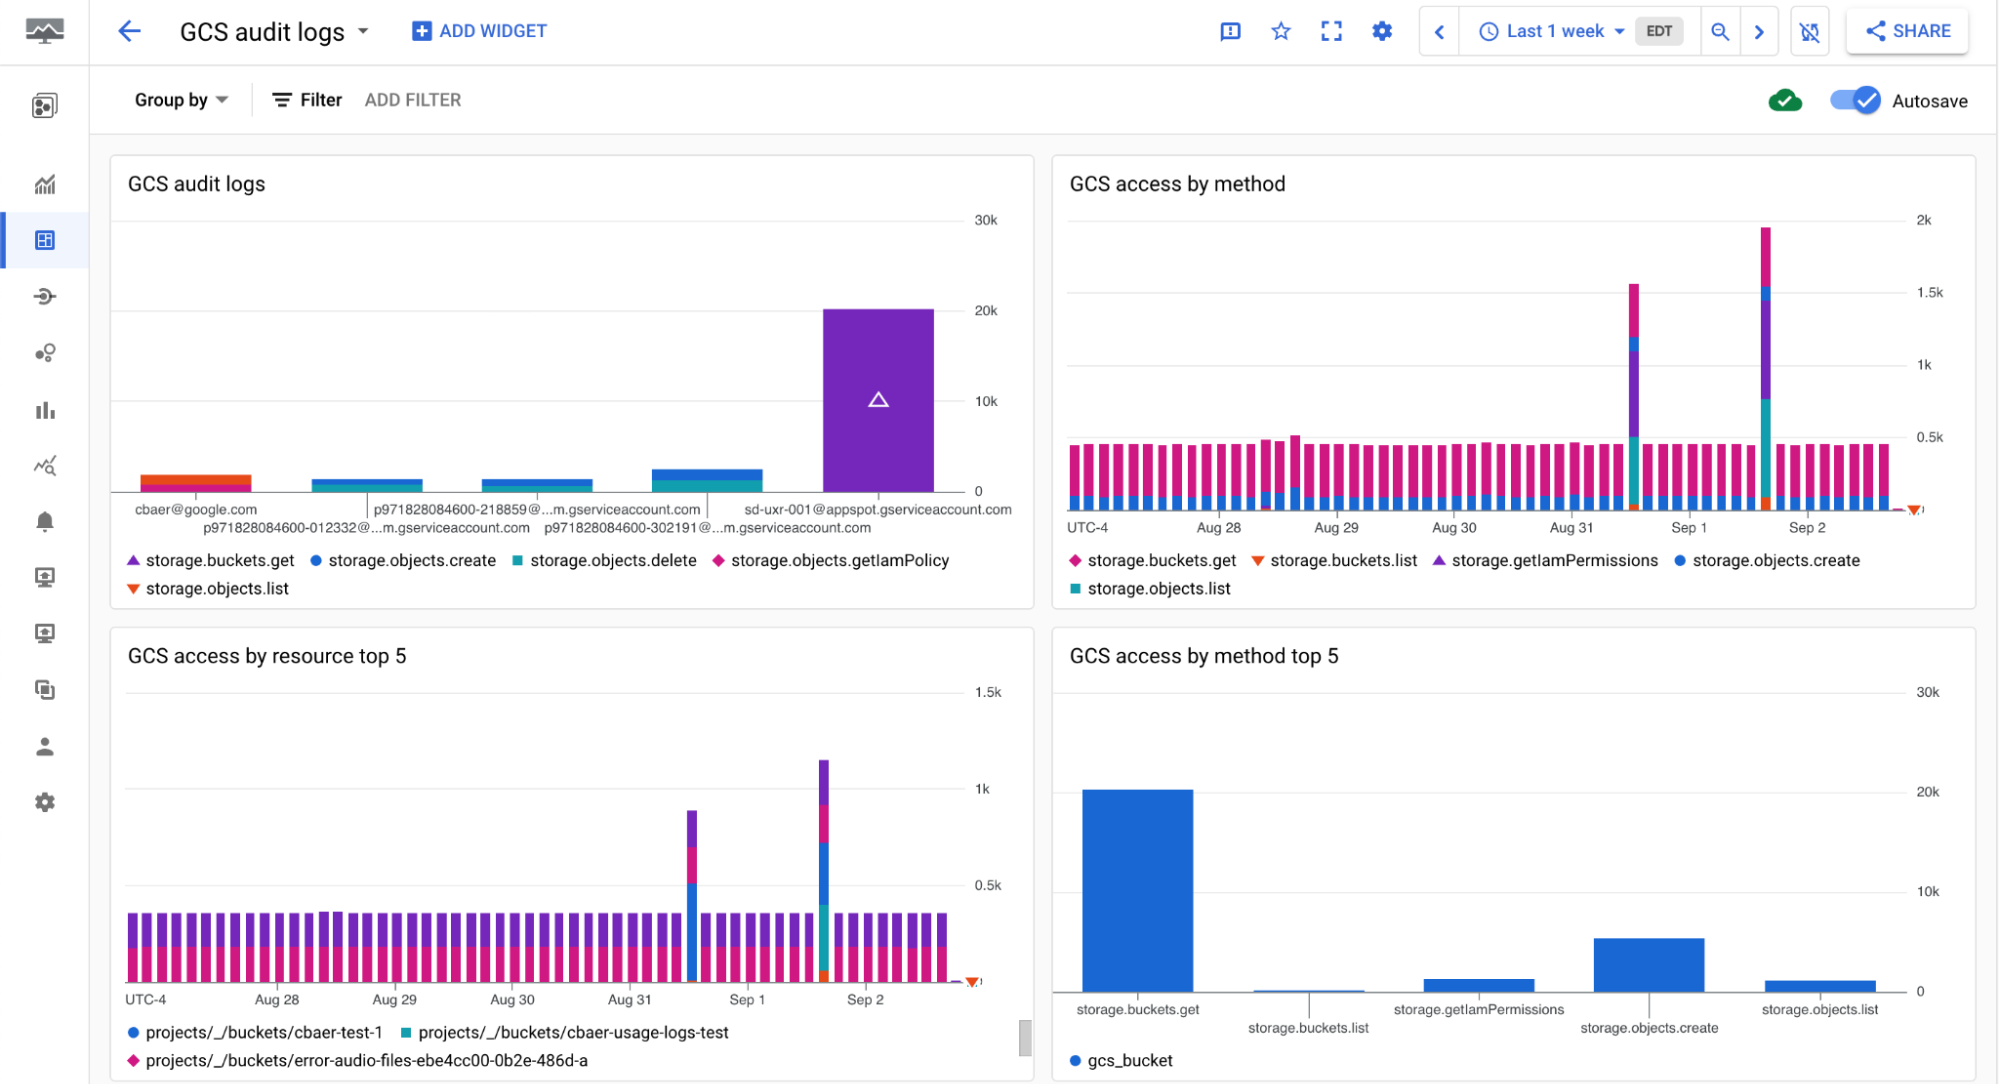
By adding the chart to a dashboard, you can save the chart for later and get a clear picture of what’s happening in Cloud Storage.
How charting and dashboarding works
To use the chart feature, first run a query in Log Analytics. By default, the query results are displayed in a table with the TABLE tab selected. To view a chart, click the CHART tab and once selected, an automatic charting configuration will be applied to the query results. You can customize the chart by selecting different chart types, dimensions, measures, measure functions and even breakdown the results by a specific field.
To save the chart to a Cloud Monitoring dashboard, use the Save chart button, which will allow you name the chart and select an existing dashboard or create a new one. Once the chart is saved to the dashboard, you can find your dashboards by selecting the dropdown next to the Save chart button. This option provides a quick list of dashboards in the project and an option to open the Cloud Monitoring dashboards list page.
During the preview, editing a dashboard isn’t available directly in Cloud Monitoring. Charts can be removed from Cloud Monitoring and added from Log Analytics. To open a Log Analytics chart in Log Analytics from a Cloud Monitoring dashboard, use the Explore in Logs Analytics option from the three-dot menu on the chart to open the same chart in Log Analytics.
What’s next
These two new features in Cloud Logging can help you gain insights from your logs in new ways. But we’re not stopping there. We’re planning new chart types and full edit support from Cloud Monitoring dashboards. In the meantime, if you haven’t tried charting and dashboarding on Logs Analytics, get started today.