New log-based metrics feature makes it easier than ever to track important logs
Lee Yanco
Senior Product Manager
Mary Koes
Product Manager, Google Cloud
Log-based metrics are a favorite tool of developers, InfoSec, IT, and network operators because they’re a fast and easy way to track, visualize and alert on important logs in your cloud environment. However, until now, one limitation has been the difficulty of aggregating logs from many projects or across the entire organization into a single metric, making it challenging to alert on organization-wide security or audit events. To help, we’ve made creating multi-project log-based metrics easier with the general availability of bucket-scoped log-based metrics.
Better observability across your entire organization
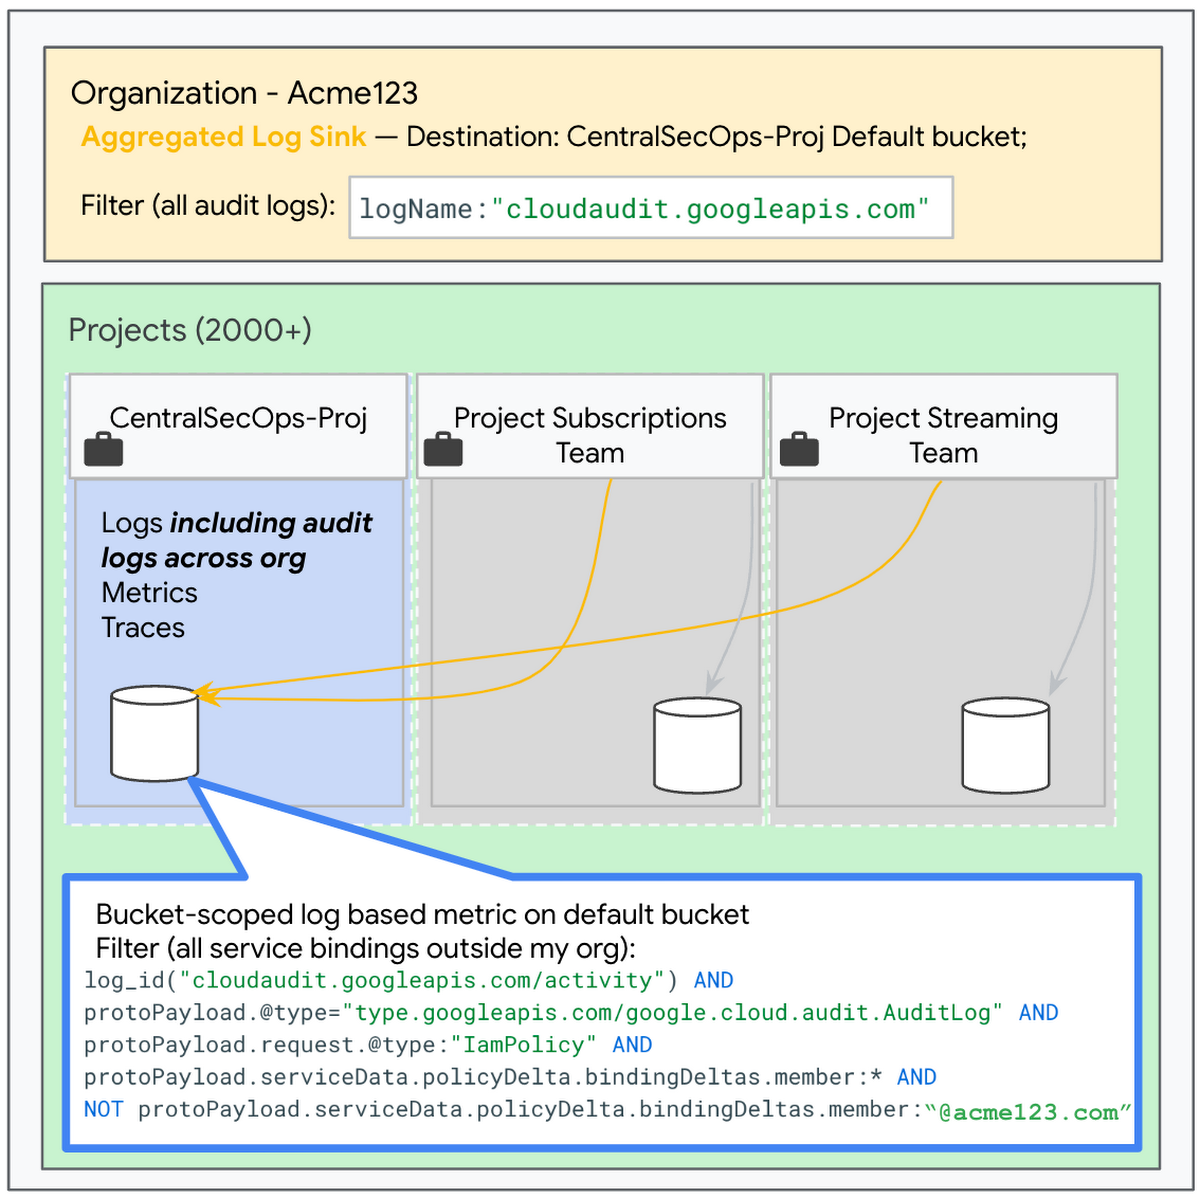
Suppose you centralize your audit logs from across your organization in a log bucket in a single SecOps project and want to track IAM logs granting permission to someone outside your organization. In the past, you had to create a separate log-based metric in each individual project and aggregate the metrics via a metric scope, being sure to add any new projects to the metric scope via Terraform. Using the newly generally available bucket-scoped log-based metric and the previously available aggregated log sink, you can create a single metric on your centralized logs.

Better observability for developers using a multi-tenancy approach
Another common pattern that gets much easier with bucket-scoped log-based metrics is managing a multi-tenant environment in Google Kubernetes Engine (GKE). Without bucket-scoped log-based metrics, a central observability team has to manage log-based metrics for every tenant team since previously, log-based metrics were calculated only based on the multi-tenant GKE project, which individual developers might not have access to. With bucket-scoped log-based metrics, individual teams can manage their own metrics in their own log buckets, resulting in better observability for the team and less work for the centralized observability team.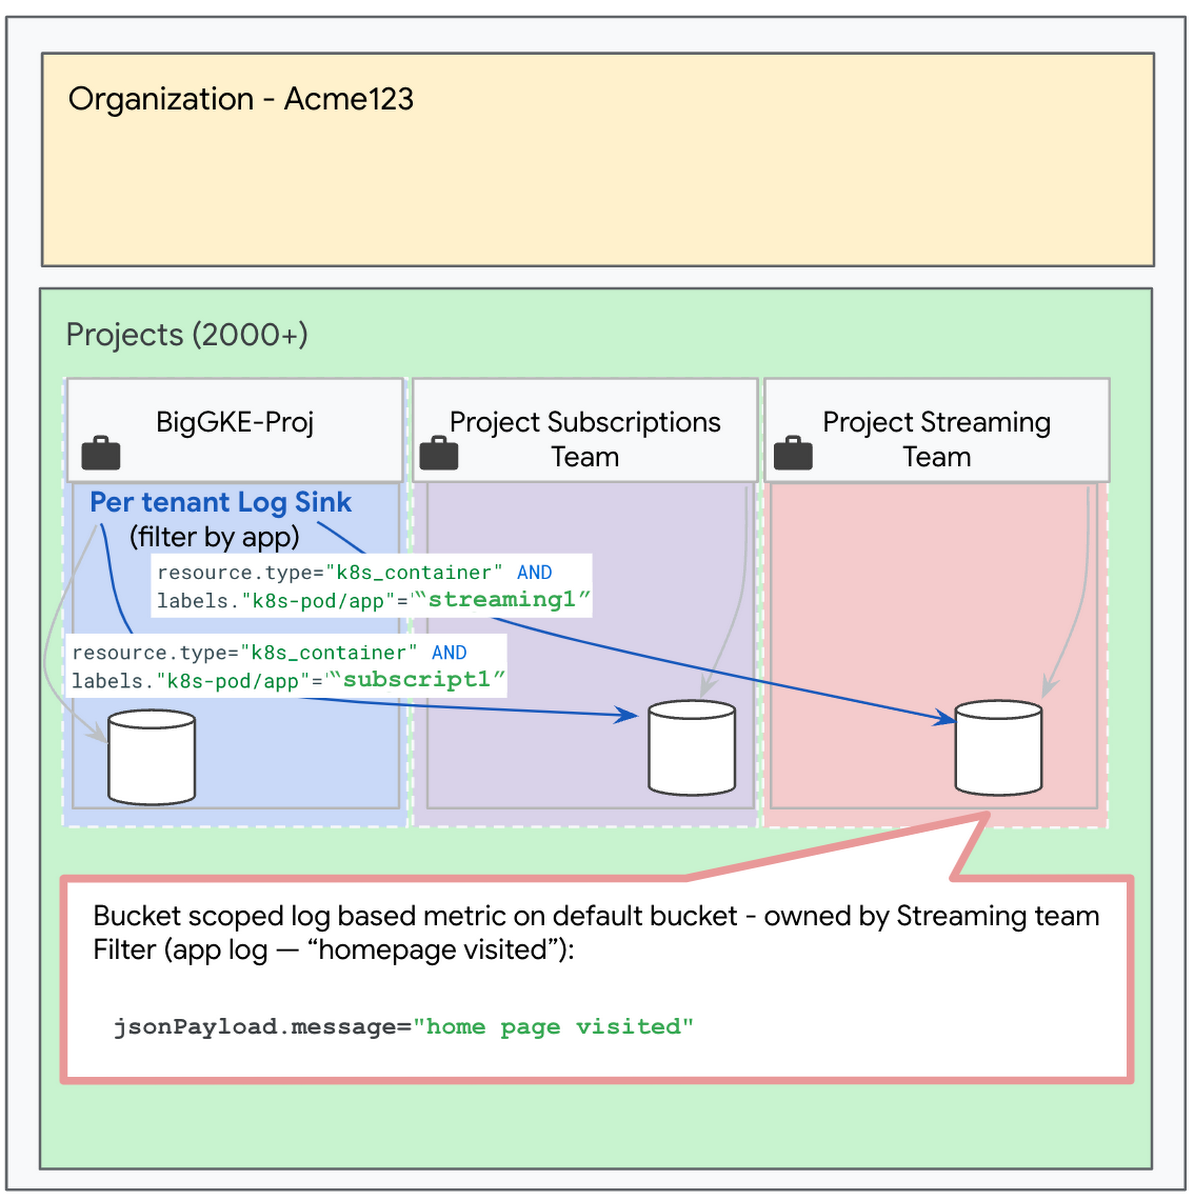

Additionally, power users will be happy to hear that bucket-scoped log-based metrics are also supported in Terraform.
Query log-based metrics using PromQL
These bucket-scoped metrics can even be charted using the popular open-source query language PromQL, making it easier for Kubernetes developers to start using them in their dashboards and alerts. Even if you’re not a user of Managed Service for Prometheus, you can query these metrics right alongside your other metrics using PromQL in either Cloud Monitoring or Grafana.
To create the right query, follow the instructions in PromQL for Cloud Monitoring metrics. For example, if your log-based metric is called “your-bucket-lbm-name”, then the PromQL for getting a per-second rate would be:
rate(logging_googleapis_com:user_your_bucket_lbm_name{monitored_resource="logging_bucket"}[1m])
You can visualize this in Cloud Monitoring or Grafana:
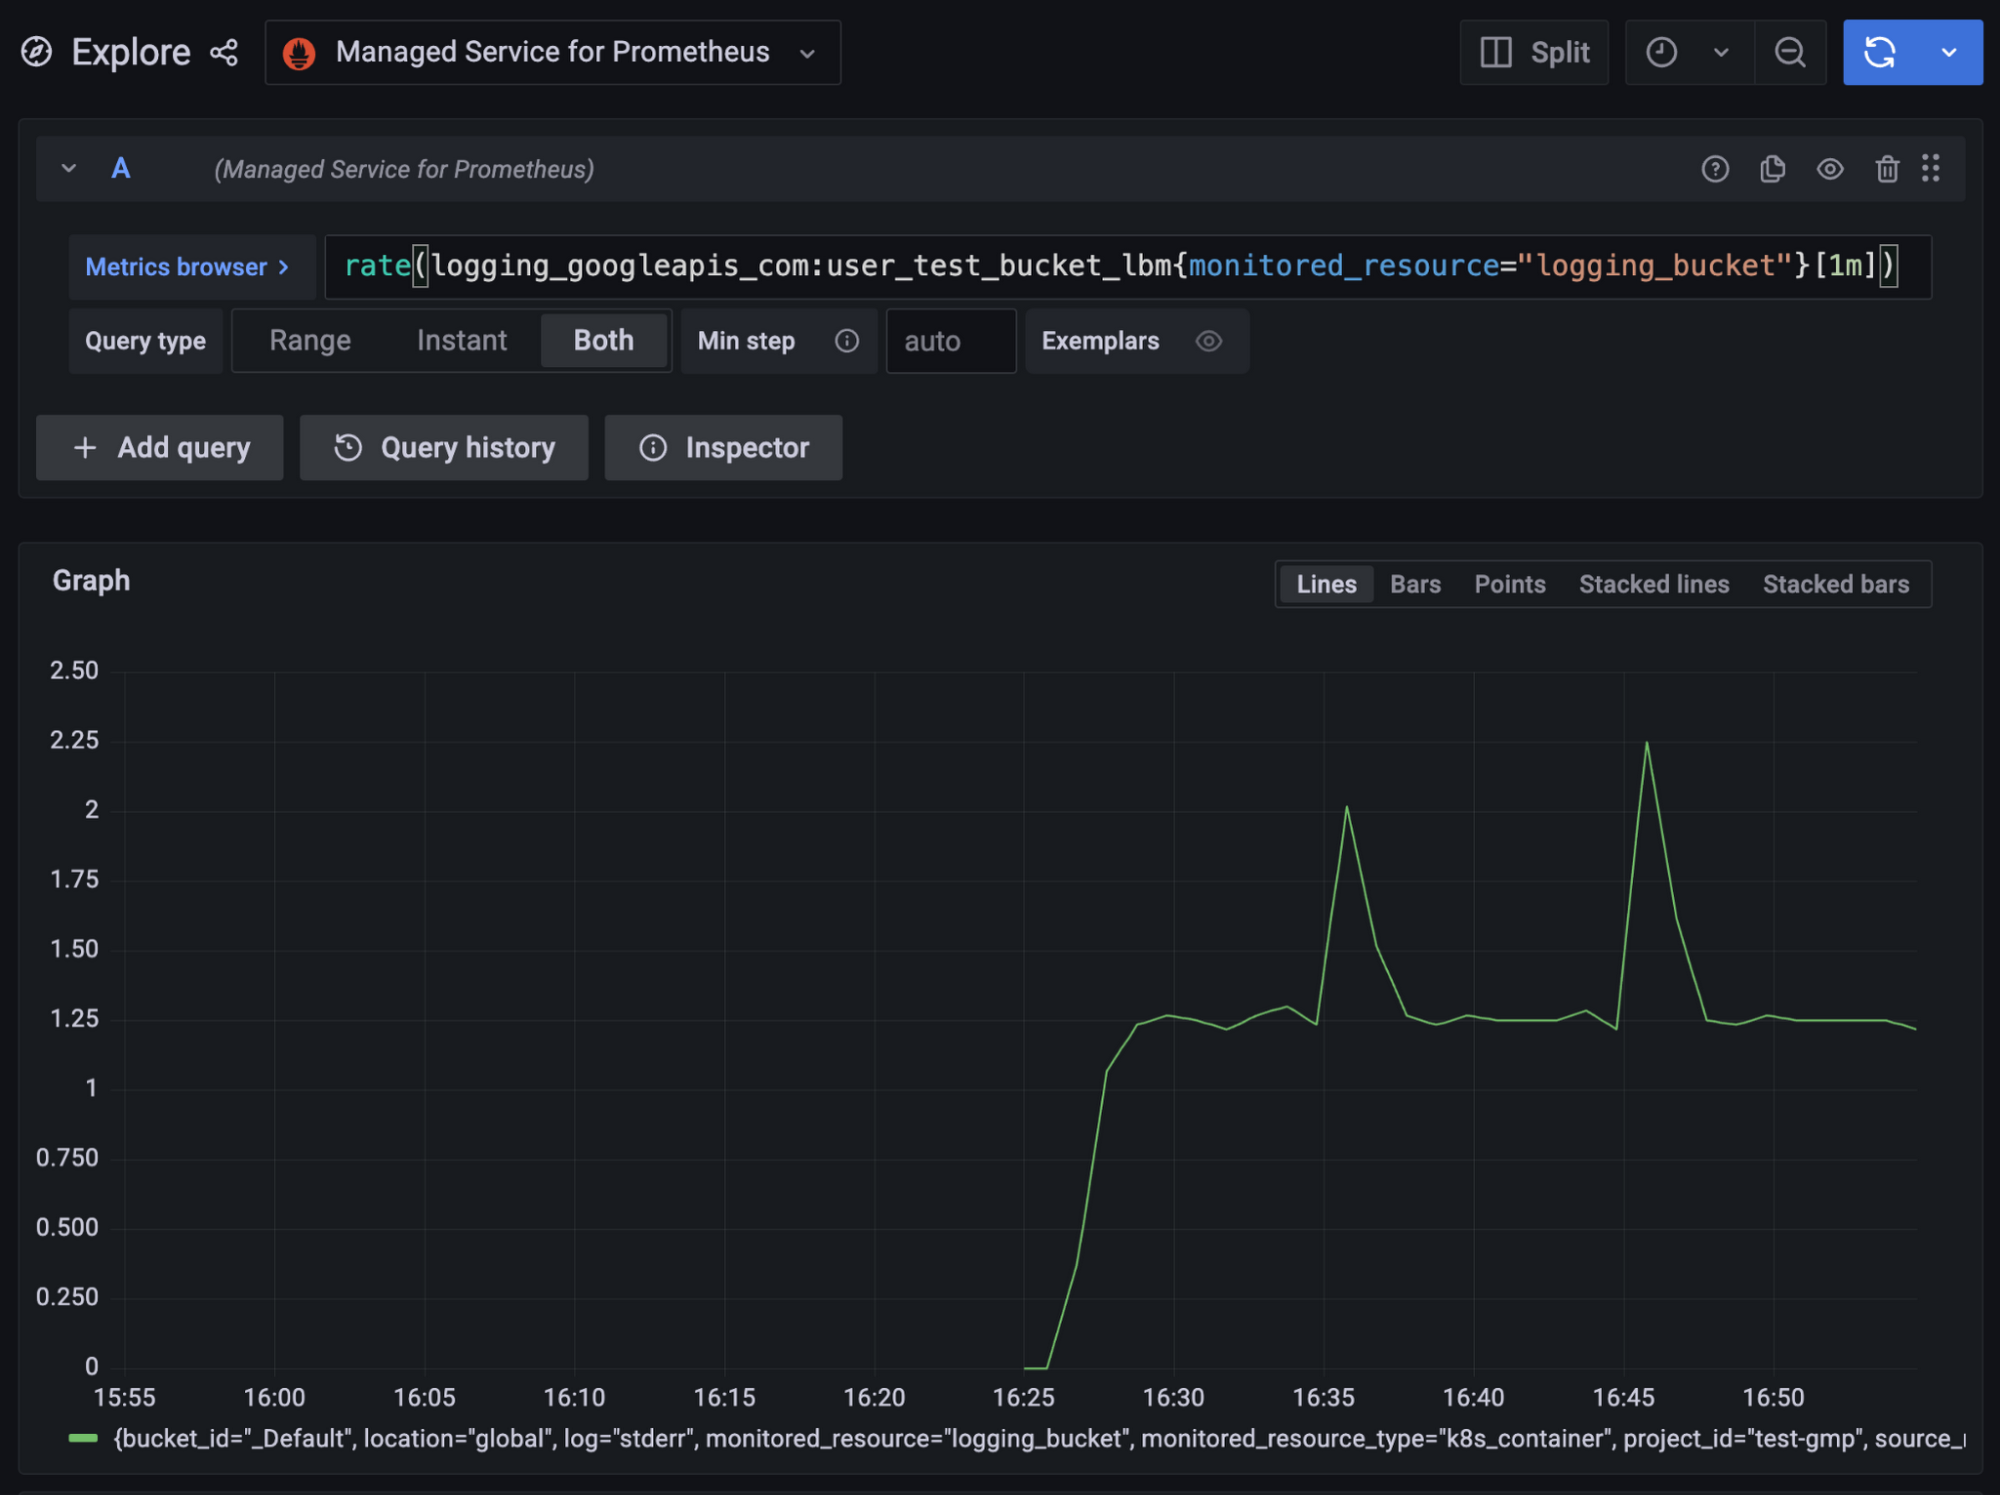

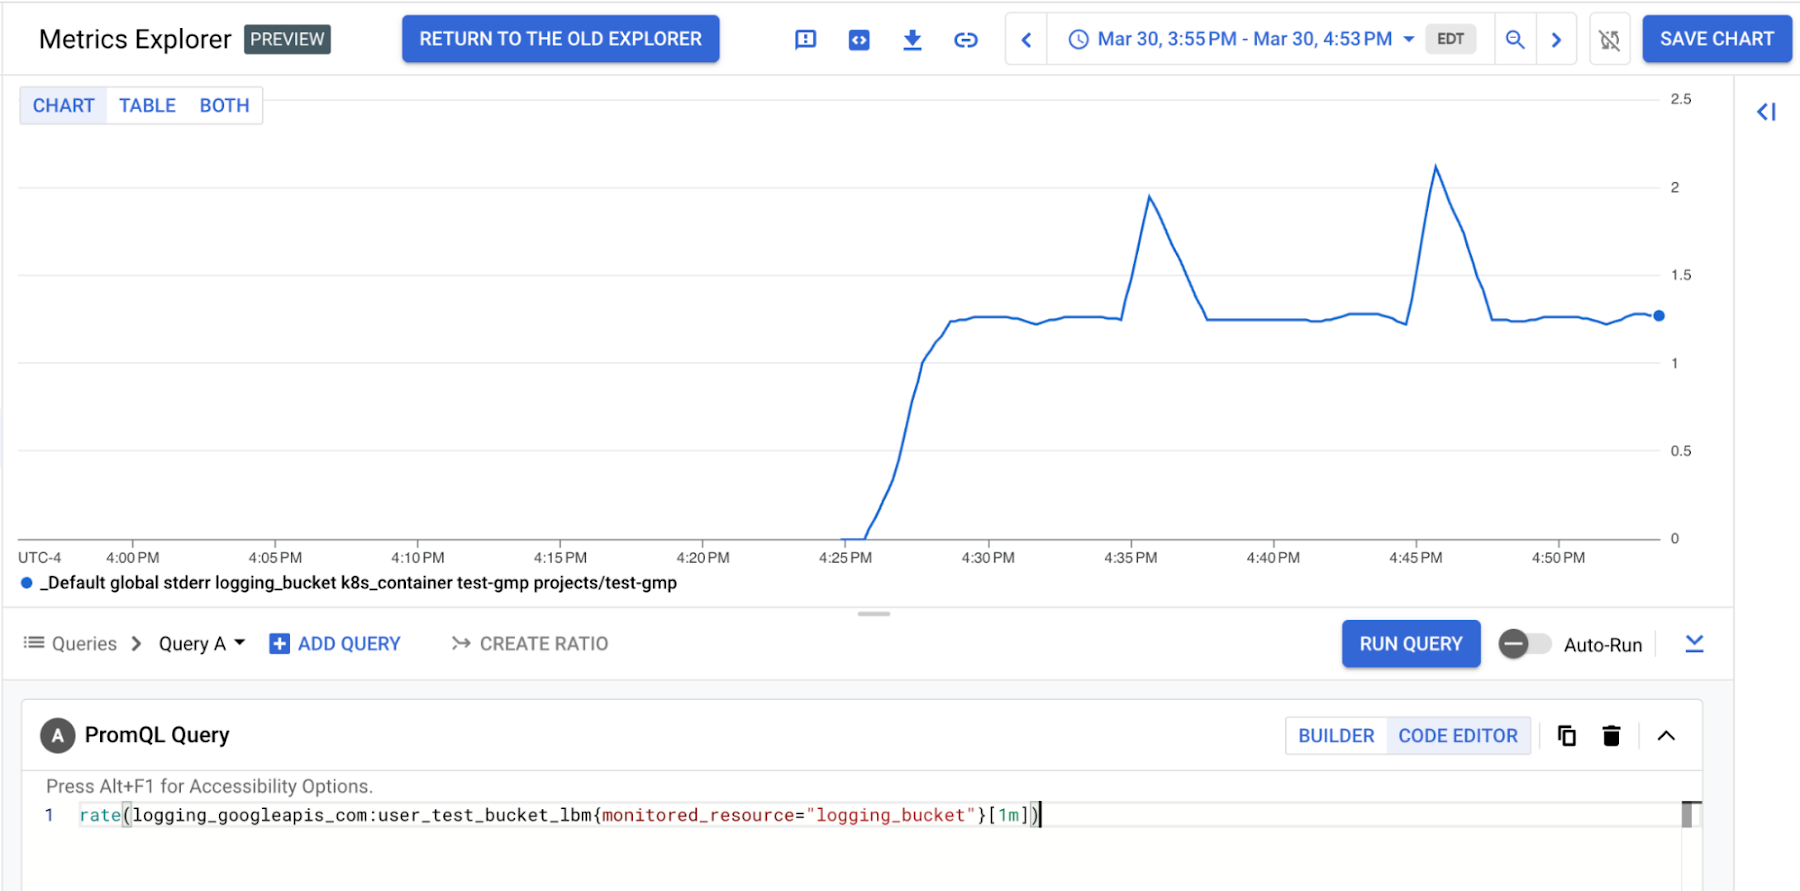

And of course, you can set alerts on these metrics using Cloud Alerting or Managed Service for Prometheus alerting.
Bringing logs and metrics together has never been easier. Get started today with bucket-scoped log-based metrics to track, visualize and alert on important logs across your organization.
