Better troubleshooting with a new Cloud Logging plugin for Grafana
Charles Baer
Product Manager, Google Cloud
Xiang Shen
Solutions Architect
Try Google Cloud
Start building on Google Cloud with $300 in free credits and 20+ always free products.
Free trialLogs are a critical resource during the troubleshooting process no matter where the troubleshooting journey starts. One advantage of Google Cloud Logging is support for open source solutions through the ecosystem. For example, Cloud Logging integrates with 3rd party products through the Logs Router making it easy to get your logs wherever you need them.
Today, we’re pleased to announce a new data source plugin that brings your Cloud Logging logs to Grafana which provides yet another way that Cloud Logging integrates with the developer ecosystem. Using the plugin, you can securely store your logs in Cloud Logging, use Grafana Explore to find your logs and add your logs to Grafana dashboards. For example, if you use Grafana to monitor your GKE clusters and applications, you can now get all the benefits of secure, reliable, scalable and compliant storage in Cloud Logging and use the tools in Grafana to more easily dig into error logs.
Using the datasource plugin, you can add logs to your dashboards so that you can use your Prometheus metrics from GKE (Google-managed Prometheus makes this really easy), infrastructure metrics from Cloud Monitoring and your logs from Cloud Logging, all together. This can help reduce the amount of time spent troubleshooting and resolving application issues.
How it works
The Cloud Logging plugin is a commercially signed data source plugin hosted in Grafana’s catalog and available to all Grafana users. You can install and configure it the same way as any other data source plugins. The code for the plugin is open sourced and available in the GitHub repository. The plugin uses the Cloud Logging API to retrieve logs stored in Cloud Logging. The same Google Cloud IAM permission model applies when accessing logs in the datasource to appropriately control access to log data.
What you can do with the plugin
Once the plugin is installed and configured, you can use logs from Cloud Logging in Grafana Explore, dashboards via a logs panel widget and use a deep link to open the same logs in Cloud Logging.
Use Grafana Explore
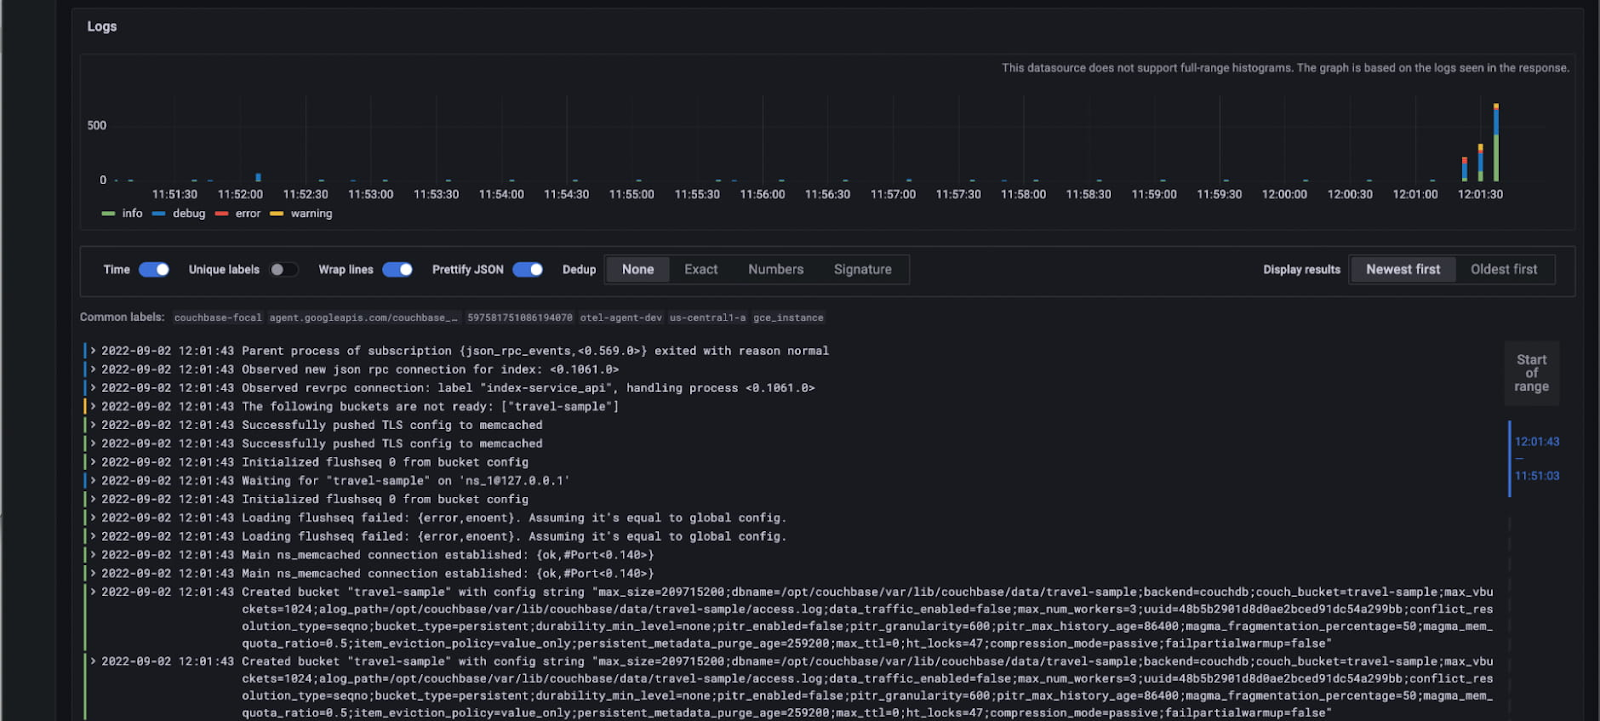
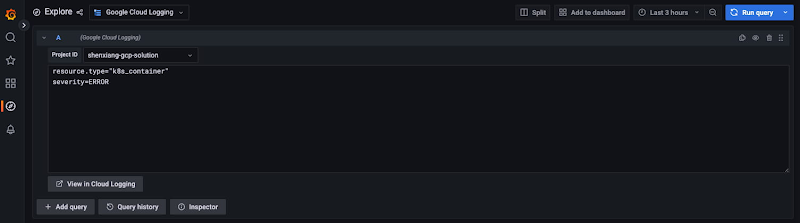
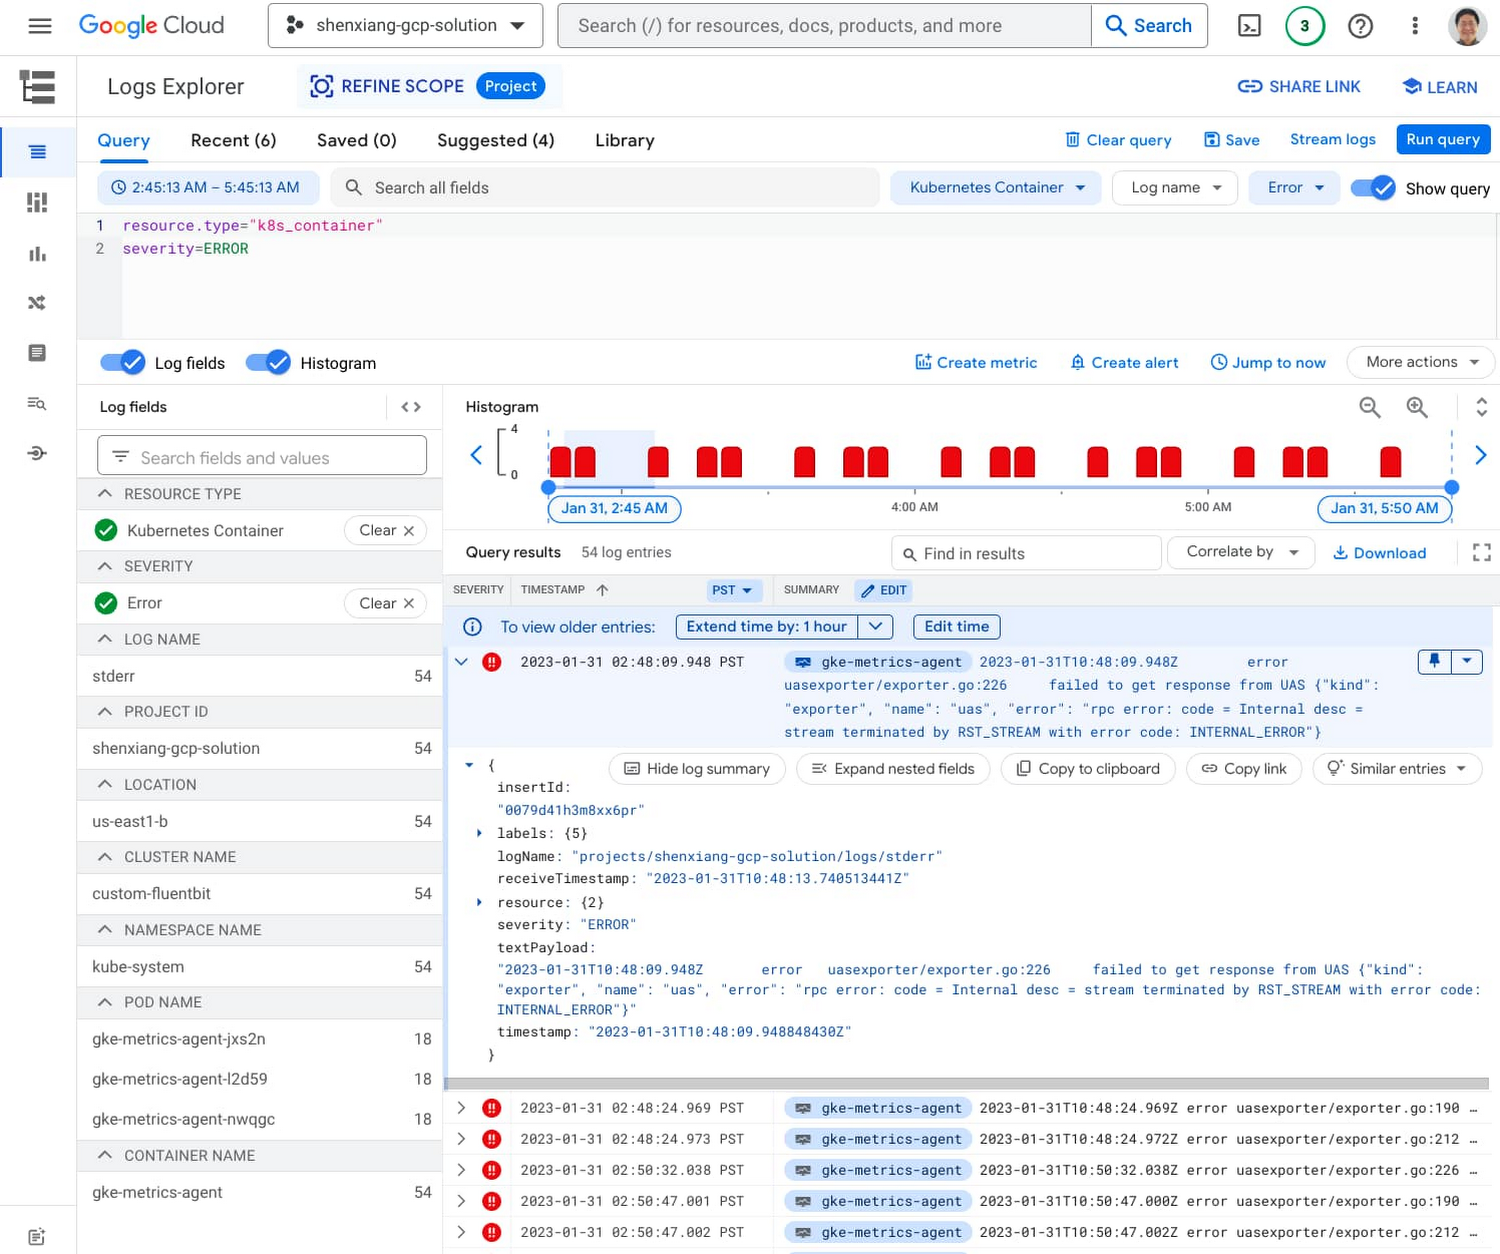
Cloud Logging uses Logging query language to find logs and display them like any other logs in Grafana Explore. You can enter Cloud Logging query language search terms to find their logs. For example, entering resource.type="k8s_container" AND severity="ERROR" will load the error logs from the selected project. You can find logs for different projects by selecting the project name from the drop-down. The list of projects matches the IAM permissions that are granted to the plugin in the configuration.
The histogram of the number of logs and individual logs are then displayed.
If you need to view the query in Cloud Logging, you can click the View in Cloud Logging link which will open the Logs Explorer with the query:
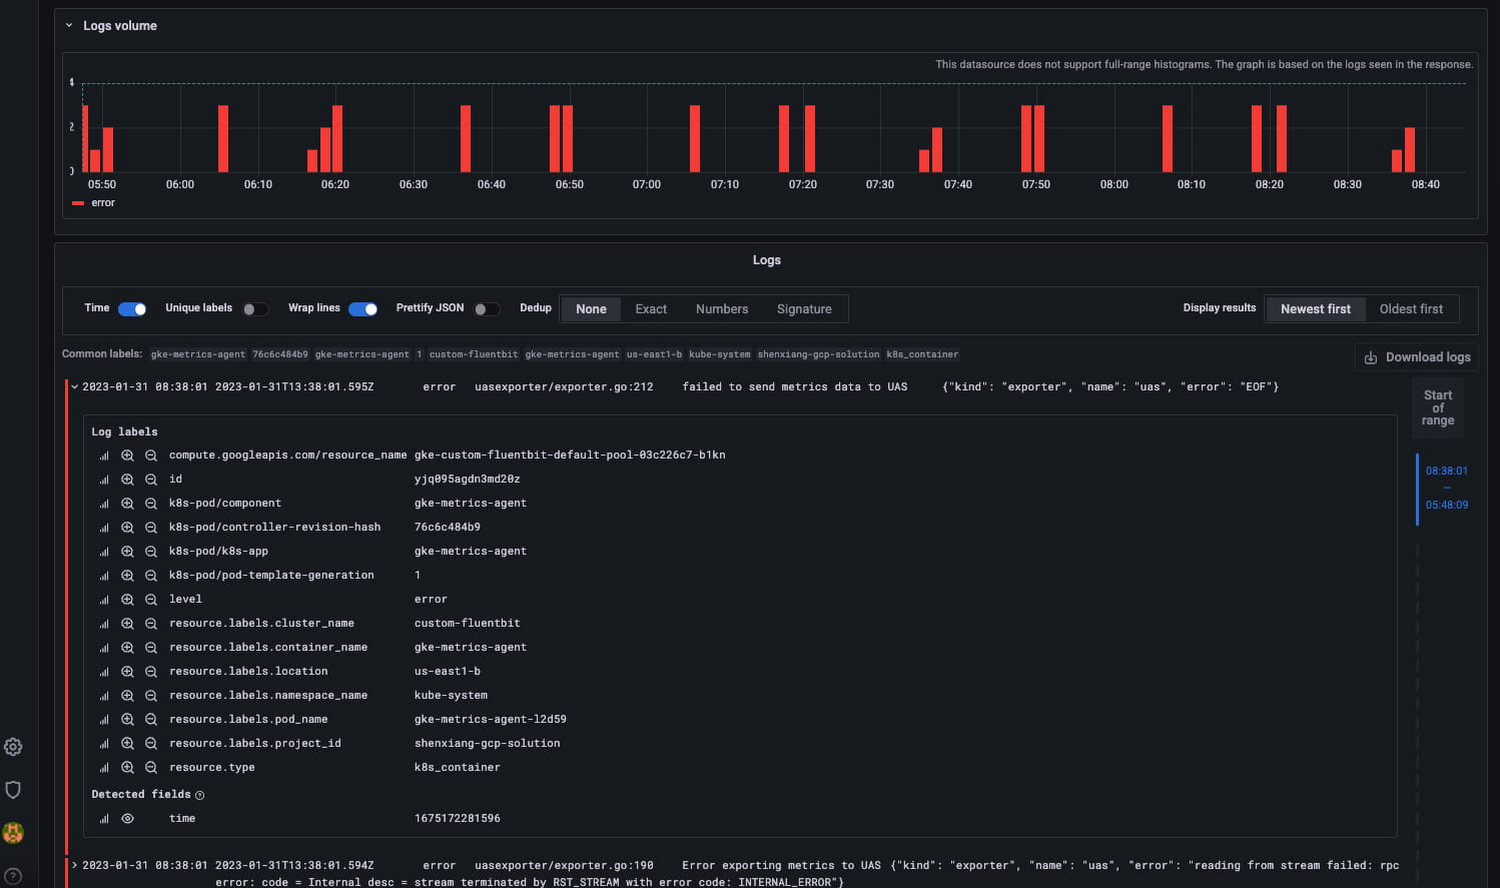
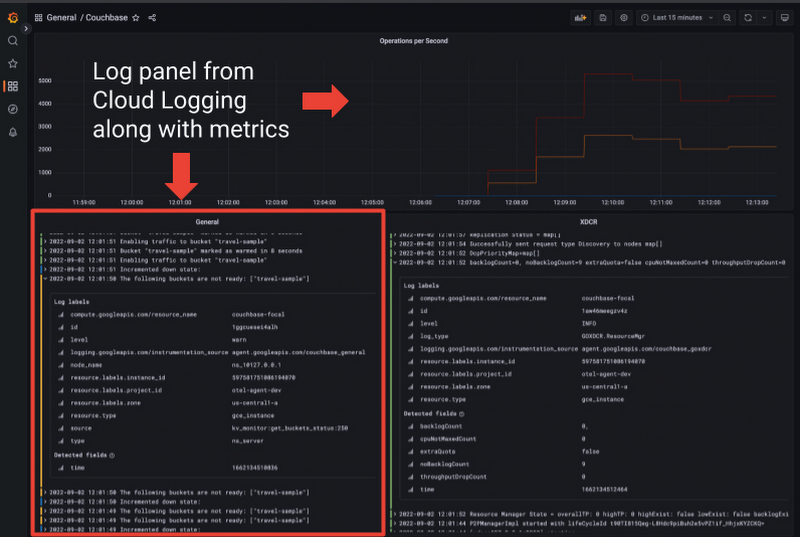
View logs on Grafana Dashboards
You can add your Cloud Logging logs to dashboards by using log panels. Log panels offer the same options as Grafana Explore including selecting the project for the logs and specifying a query to match specific logs.
Get started today
In Cloud Logging, we understand how critical having reliable, secure and scalable access to logs is to the troubleshooting process which is why we’re excited about this new datasource plugin. If you already use Grafana as a part of your troubleshooting tools, get started by setting up the datasource plugin today.