Canary analysis: Lessons learned and best practices from Google and Waze

Eran Davidovich
System Operations Engineer, Waze
Théo Chamley
Solutions Architect, Google Cloud
Spinnaker is an open-source, continuous delivery system built by Netflix and Google to manage deploying apps to different computing platforms, including Google App Engine, Google Kubernetes Engine, Google Compute Engine, AWS, Azure, and more.
Using Spinnaker, you can implement advanced deployment methods, for example, canary. In a canary deployment, you expose a new version of your app to a small portion of your production traffic and analyze its behavior before going ahead with the full deployment. This lets you mitigate risks before deploying a new version to all of your users. Waze, maker of the community-based traffic navigation app, uses Spinnaker and estimates that canary releases can prevent a quarter of all incidents on their services, including most user-facing incidents.
Netflix and Google have collaborated to create the new automated canary analysis feature for Spinnaker called Kayenta, based on our own experience. You could build your own system for canary deployments (and other advanced deployment patterns) but it would likely be a labor-intensive, error-prone process. Spinnaker and Kayenta make it much easier and more reliable.
Deploying an application at Waze
Here is a real Spinnaker deployment pipeline with canary analysis currently being tested at Waze:
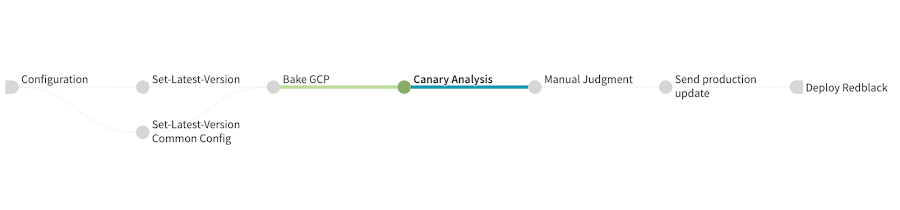
Let’s go through the different stages of this pipeline:
- Set-Latest-Version and Set-Latest-Version Common Config retrieve information about the latest promoted application version and set variables for the rest of the pipeline.
- Bake GCP creates the Compute Engine image with the new version of the application that will be used in the rest of the pipeline.
- Canary Analysis deploys the baseline and canary versions, actually runs the canary analysis and then cleans up the infrastructure.
- Manual Judgment After Canary Analysis waits for an operator to manually validate the result of the canary analysis.
- Send production update sends a notification to developers to inform them of the progress of the pipeline just before deploying to production.
- Deploy Redblack actually deploys the new version of the application to production with a blue/green deployment (blue/green is called red/black by Netflix and Spinnaker).
What you need before you can implement canary deployments
The pipeline above is the result of a lot of work and is optimized for Waze. You can take inspiration from it, but you will need to adapt it to your own applications. To help you get started,
let’s first review what you need to have before doing canary deployments:
- Spinnaker relies on an external monitoring system to provide the data for canary analysis. Your application needs to be instrumented to provide metrics to that external system. Spinnaker supports Stackdriver, Prometheus, and Datadog. The Spinnaker community is working on adding support for more systems, and you are welcome to contribute.
- You need to know what metrics and what values for those metrics indicate your application’s health.
If your application and your monitoring systems fit those requirements, you can start developing a Spinnaker pipeline with an automated canary analysis.
Advice for developing a canary configuration in Spinnaker
Configuring a canary is a non-trivial amount of work. You also need to maintain it in the long run, like any critical piece of your IT systems. This section outlines some high-level advice for creating a successful and reliable canary deployment pipeline in Spinnaker. For a deep-dive on the actual technical steps and parameters available to you, we recommend you go through the Automating Canary Analysis on Google Kubernetes Engine with Spinnaker tutorial.
Don’t start by modifying your production pipeline
If you want to do canary deployments on an application that is already running in production, start by creating a new canary deployment pipeline. Developing a canary configuration involves a lot of trial and error, and you don’t want to mess with your actual production pipelines.
Obviously, start your deployment tests on a non-production environment. But a canary is only meaningful if you have traffic to measure. Inject traffic on the environment you are using, either by mirroring production traffic, by replaying it, or by generating fake traffic.
Have good and bad versions of your app
Your goal is to get Spinnaker to give you the same answer about the health of a canary that you would get by carefully examining every relevant metric. To achieve this, you need to test both healthy and faulty canary deployments, and this requires you to have a known good version of your application (to test when the canary analysis should pass) and a known bad version of your application (to test when the canary analysis should fail). If necessary, create a bad version by injecting problems in the code.
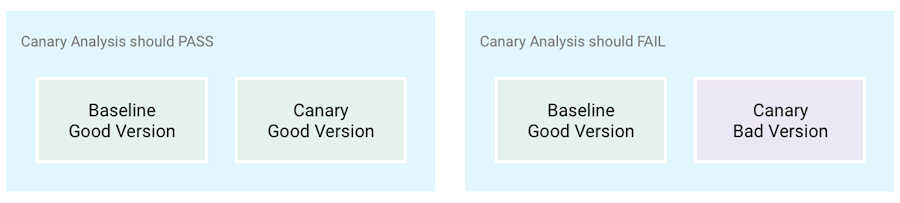
Another advanced method to test the relevance of your canary configuration is to make A-A tests (as opposed to A-B tests) where your canary release is the exact same version as your production release; a canary analysis should always pass those tests.

Use canary reports and their metrics for debugging
The hardest part of developing a canary configuration is adjusting the metrics and the weights you give them, and debugging Kayenta queries against your monitoring system.
It’s important to use all the tools Spinnaker provides. The most important one is the canary report. The canary report shows you the result of the canary analysis for each metric. It lets you see if Spinnaker is getting metrics from your monitoring system and if the results for each metric are what you expect.
You can access the report for your canary analysis, either in the “Canary reports” tab, or by clicking the report icon in the execution stage:
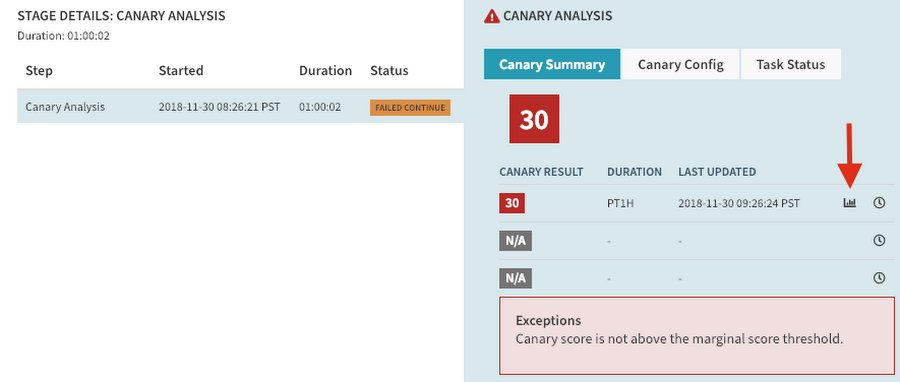
In the report, you can click on the “metrics” link to examine exactly what queries were made and what result they got.
Handcraft the queries to your monitoring system
To get to a working canary configuration, it helps to work backward: start by designing the queries Spinnaker will run against your monitoring system. You need to be able to run those queries manually. In the case of Stackdriver, you can use the APIs Explorer. For Prometheus, use the Expression browser.
Once you’re satisfied with your queries and their results, you can do the “translation” work to replicate them with a canary configuration in Spinnaker. This is where the canary reports are most useful.
Use retrospective mode
A real canary analysis can last several hours. It’s unreasonable to wait that long for each iteration when you’re developing the canary configuration. To avoid this, use retrospective mode, available in the canary stage configuration: it runs the analysis against past, existing metric data rather than waiting for new data to be gathered.
Monitor your new pipeline before you trust it
Finally, even when you’re satisfied with the first iteration of your canary configuration and you’re ready to test it in production, don’t fully rely on it right away. Implement one of the following pipeline schemas to increase your confidence in the canary configuration:
- Put the canary analysis stage in a non-blocking branch of the pipeline. That way, it doesn’t actually influence the result of your deployments, but you can check if the result of the canary analysis on production workloads is what you expect.
- Add a manual judgment stage after the canary analysis where a person checks that the results are what you expect. This is what Waze is doing in the pipeline described above.
After a period of time, you can remove those stages and let the canary analysis fully automate your deployment pipeline.
Canary best practices
As you develop your canary configuration, follow these practices to make your canary analyses reliable and relevant. You can see the full version of these best practices on the Spinnaker website.
Compare the canary against a baseline, not against production
Don’t compare the canary to production instances. Many differences can skew the results of the analysis: cache warmup time, heap size, load-balancing algorithms, etc.
Instead, compare the canary deployment against a baseline deployment that uses the same version and configuration as the production deployment, but that’s otherwise identical to the canary, in terms of:
- time of deployment
- number of instances
- type and amount of traffic
Comparing a canary to a baseline isolates application version and configuration as the only factors differentiating the two deployments.
Run the canary for enough time
You need at least 50 pieces of time-series data per metric for the statistical analysis to be relevant. In Spinnaker, a canary analysis stage can include several canary runs that each need those 50 data points. Depending on the granularity of your monitoring data, this means that you might have to plan for canary analyses that are several hours long.
Carefully choose which metrics to analyze
While you can get started with a single metric, we advise that you use several metrics that represent different aspects of your application’s health.
Three aspects are defined in the SRE book as being particularly important:
- Latency: how long does your application take to respond to a request?
- Errors: how many errors does your application encounter?
- Saturation: how many additional requests can an instance of your application handle in parallel?
You can group metrics together and put different weights on those groups. This lets you increase the importance of a particular group of metrics in the statistical analysis.
Create a standard set of reusable canary configs
Developing a canary configuration is difficult, and you probably can't expect everyone in your organization to do so. To help everyone, and to keep the canary configurations maintainable, create a set of standard configurations that all the teams can use as a starting point. This is much easier to do if all the applications expose the same set of monitoring metrics.
Conclusion
Coming up with a good canary config is a long, iterative process. Expect to spend time fine-tuning parameters, such as:
- metrics to analyze
- weights on metric groups
- thresholds
- length and the number of canary runs
Though Spinnaker makes implementing canary deployments much easier than building a system yourself, you won’t get it exactly right the first time. But investing in canary deployment will greatly increase your confidence in your deployment processes, lower the number of problems that impact your users, increase your velocity, and hopefully lower your stress level!
Next steps
Here are some things to help you learn more about this automated canary analysis in Spinnaker:
- Go through the Spinnaker codelabs, and especially the one focused on Kubernetes.
- Go through the canary analysis tutorial: Automating Canary Analysis on Google Kubernetes Engine with Spinnaker.
- Watch the Google Cloud Next ‘18 talk by Netflix and Waze on this topic.
- Join the Spinnaker community on Slack.
- Sign up to join the Spinnaker community forum.
Acknowledgements
We would like to thank our collaborators for making this blog post and the work associated with it possible:
- Andrew Phillips, Product Manager for Releases & Rollouts
- Matt Duftler, Software Engineer for Spinnaker
- David Dorbin, Technical Writer for Spinnaker